| Param | Original file | Final file |
|---|---|---|
| Filename | modeM0/AS1T04_018T01_9000004494_31130cztM0_level2.evt | modeM0/AS1T04_018T01_9000004494_31130cztM0_level2_quad_clean.evt |
| Size (bytes) | 658,800,000 | 94,167,360 |
| Size | 628.3 MB | 89.8 MB |
| Events in quadrant A | 3,735,787 | 592,759 |
| Events in quadrant B | 6,045,002 | 581,668 |
| Events in quadrant C | 4,059,685 | 570,739 |
| Events in quadrant D | 5,582,348 | 562,375 |
| Mode M0 | |||
|---|---|---|---|
| Quadrant | BADHDUFLAG | Total packets | Discarded packets |
| A | 0 | 16061 | 2 |
| B | 0 | 23911 | 2 |
| C | 0 | 16823 | 2 |
| D | 0 | 22043 | 2 |
| Mode M9 | |||
|---|---|---|---|
| Quadrant | BADHDUFLAG | Total packets | Discarded packets |
| A | 0 | 16 | 0 |
| B | 0 | 16 | 0 |
| C | 0 | 16 | 0 |
| D | 0 | 16 | 0 |
| Mode SS | |||
|---|---|---|---|
| Quadrant | BADHDUFLAG | Total packets | Discarded packets |
| A | 0 | 158 | 0 |
| B | 0 | 158 | 0 |
| C | 0 | 158 | 0 |
| D | 0 | 158 | 0 |
| Quadrant | Total seconds | Saturated seconds | Saturation percentage |
|---|---|---|---|
| A | 7831 | 95 | 1.213127% |
| B | 7831 | 183 | 2.336866% |
| C | 7832 | 220 | 2.808989% |
| D | 7832 | 210 | 2.681307% |
Noise dominated data is calculated using 1-second bins in cleaned event files. If a bin has >2000 counts, and if more than 50% of those come from <1% of pixels, then it is considered to be noise-dominated and hence unusable.
| Quadrant | # 1 sec bins | Bins with >0 counts | Bins with >2000 counts | High rate bins dominated by noise | Noise dominated (total time) | Noise dominated (detector-on time) | Marked lightcurve |
|---|---|---|---|---|---|---|---|
| A | 9301 | 7833 | 0 | 0 | 0.00% | 0.00% |  |
| B | 9301 | 7833 | 7 | 7 | 0.08% | 0.09% | 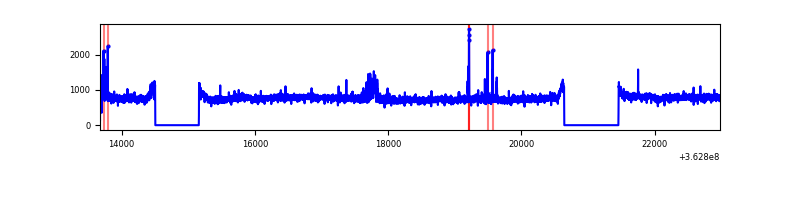 |
| C | 9302 | 7834 | 11 | 11 | 0.12% | 0.14% | 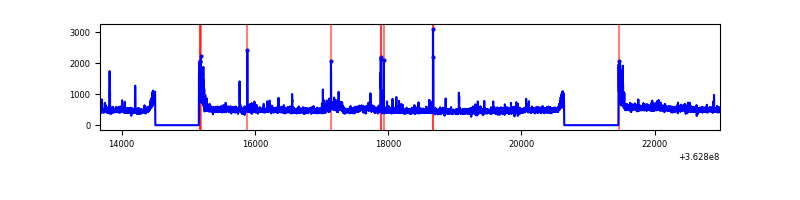 |
| D | 9302 | 7834 | 80 | 80 | 0.86% | 1.02% | 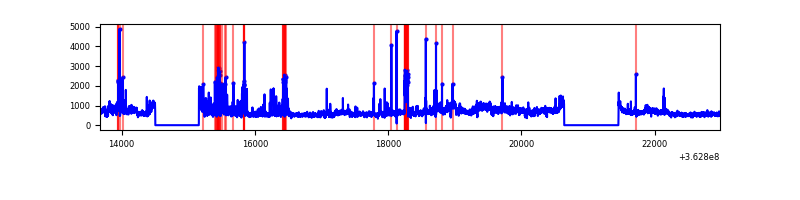 |
Top three noisy pixels from each quadrant. If the there are fewer than three noisy pixels in the level2.evt file, extra rows are filled as -1
| Pixel properties | Quadrant properties | ||||||
|---|---|---|---|---|---|---|---|
| Quadrant | DetID | PixID | Counts | Sigma | Mean | Median | Sigma |
| A | 13 | 254 | 14105 | 67.65 | 966 | 945 | 194.5 |
| A | 3 | 137 | 10087 | 46.99 | 966 | 945 | 194.5 |
| A | 0 | 226 | 7874 | 35.62 | 966 | 945 | 194.5 |
| B | 6 | 159 | 2111395 | 11585.5 | 955 | 928 | 182.2 |
| B | 0 | 190 | 82882 | 449.89 | 955 | 928 | 182.2 |
| B | 12 | 111 | 23388 | 123.3 | 955 | 928 | 182.2 |
| C | 0 | 10 | 169723 | 776.11 | 928 | 934 | 217.5 |
| C | 14 | 238 | 148558 | 678.79 | 928 | 934 | 217.5 |
| C | 14 | 225 | 79966 | 363.4 | 928 | 934 | 217.5 |
| D | 8 | 195 | 1481314 | 6007.58 | 926 | 907 | 246.4 |
| D | 13 | 174 | 361435 | 1463.04 | 926 | 907 | 246.4 |
| D | 2 | 250 | 135489 | 546.14 | 926 | 907 | 246.4 |
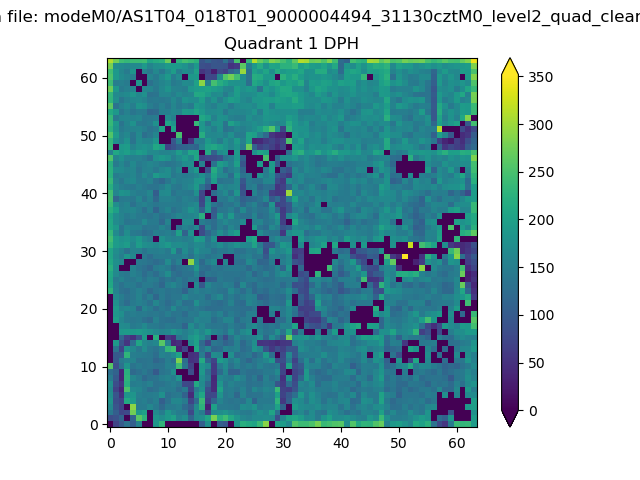
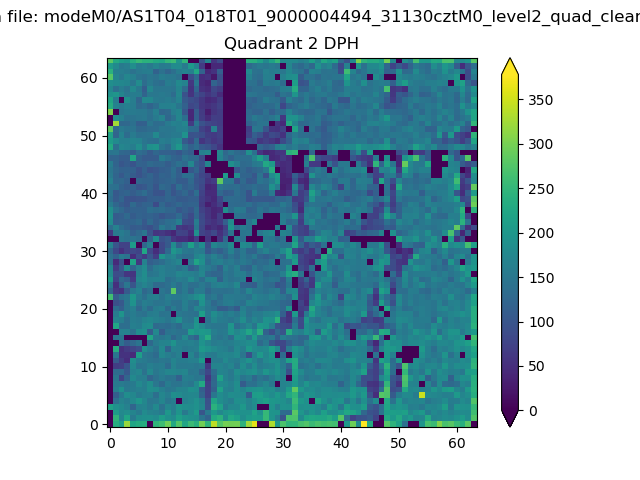
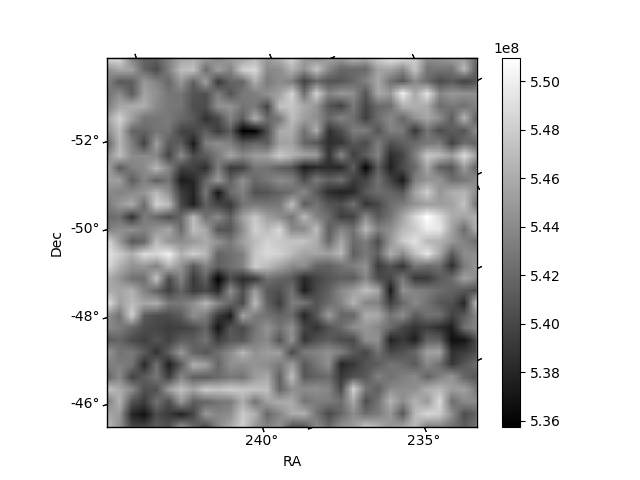
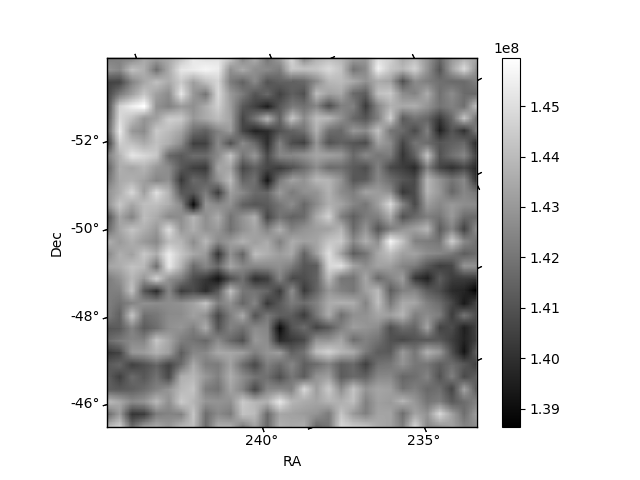
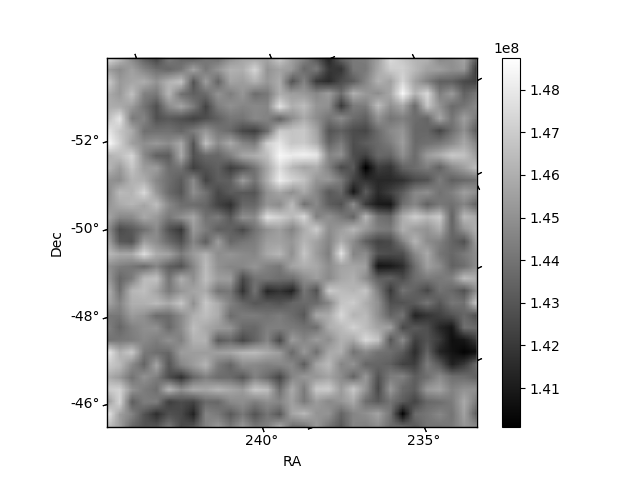
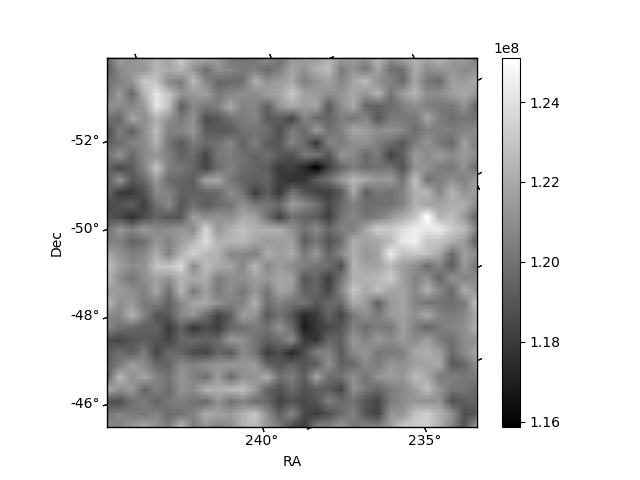
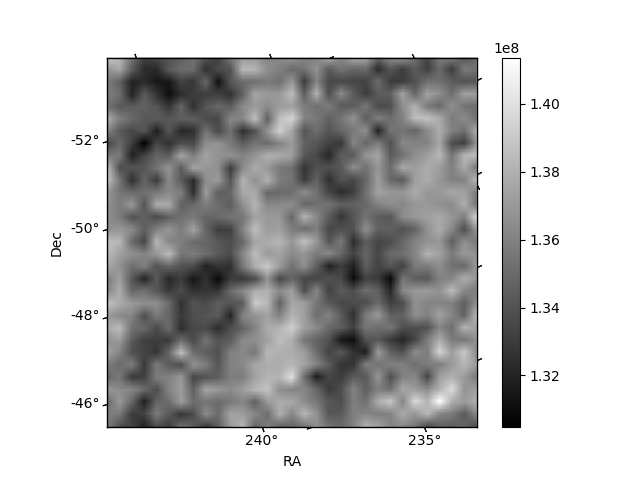
Histogram calculated using DETX and DETY for each event in the final _common_clean file
| Quadrant A | 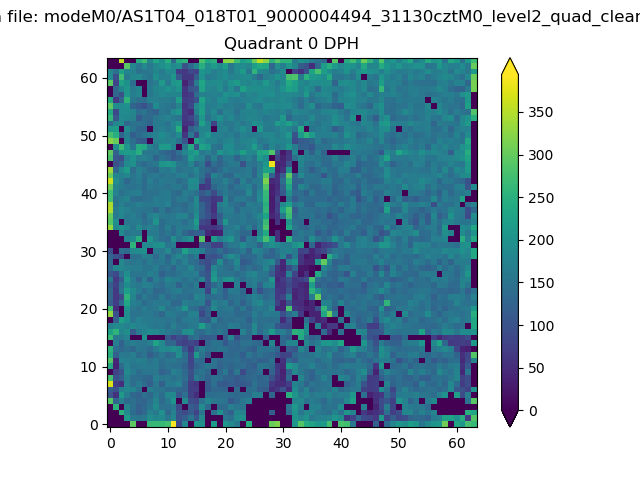 |
 |
Quadrant B |
|---|---|---|---|
| Quadrant D | 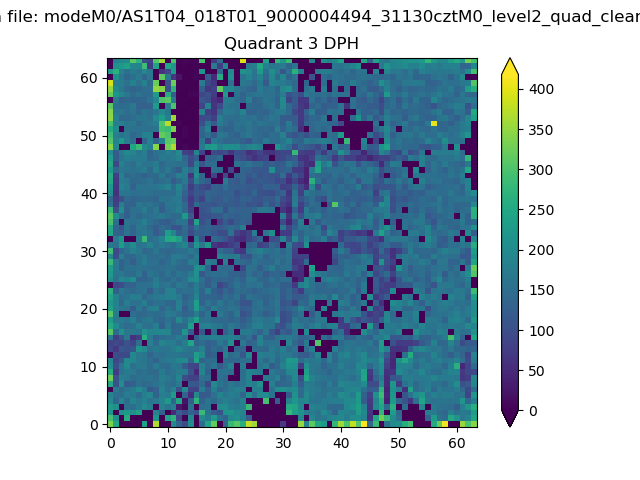 |
 |
Quadrant C |
| Plot type | Count rate plots | Images |
|---|---|---|
| Comparison with Poisson distribution Blue bars denote a histogram of data divided into 1 sec bins. Red curve is a Poisson curve with rate = median count rate of data. |
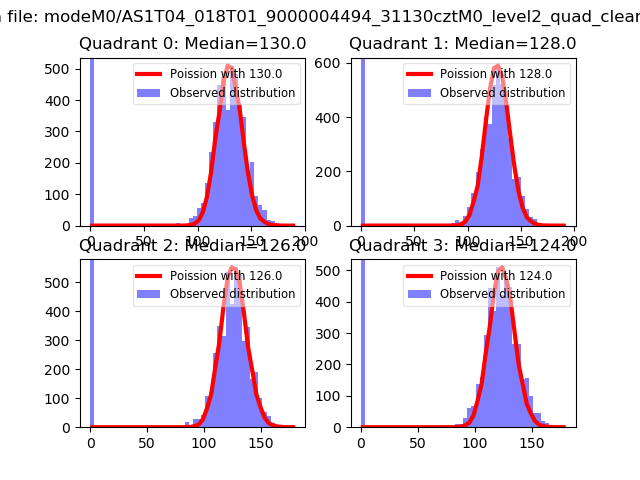 |
 |
| Quadrant-wise count rates Data is divided into 100 sec bins |
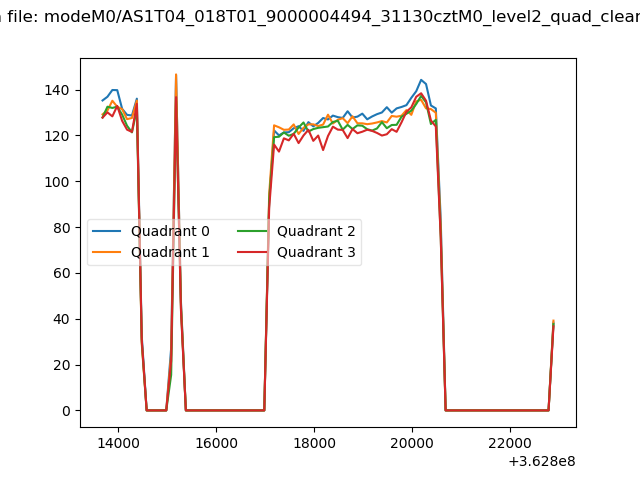 |
|
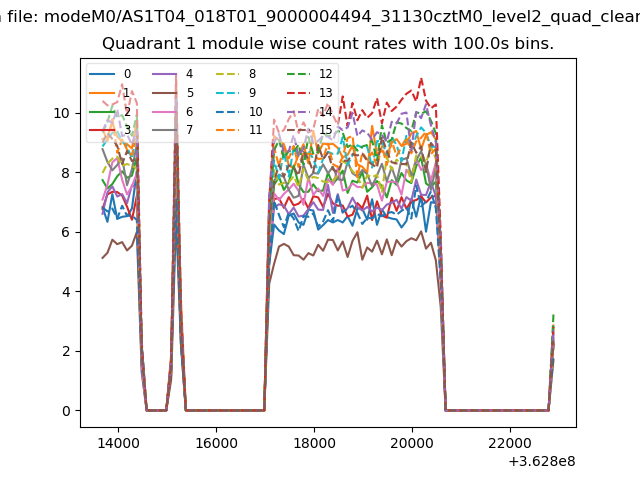
| Module-wise count rates for Quadrant A Data is divided into 100 sec bins |
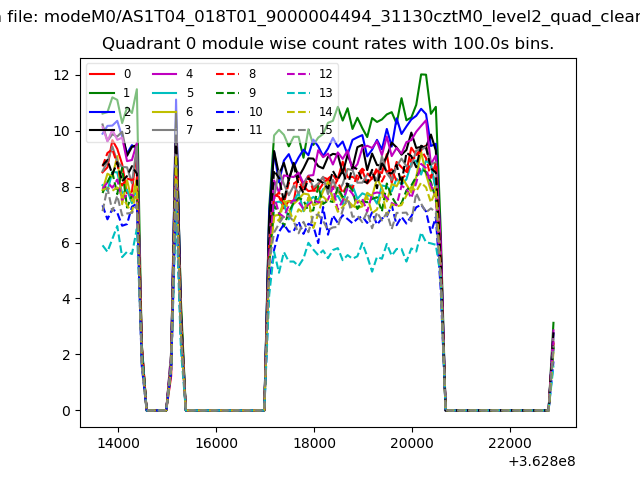 |
 |
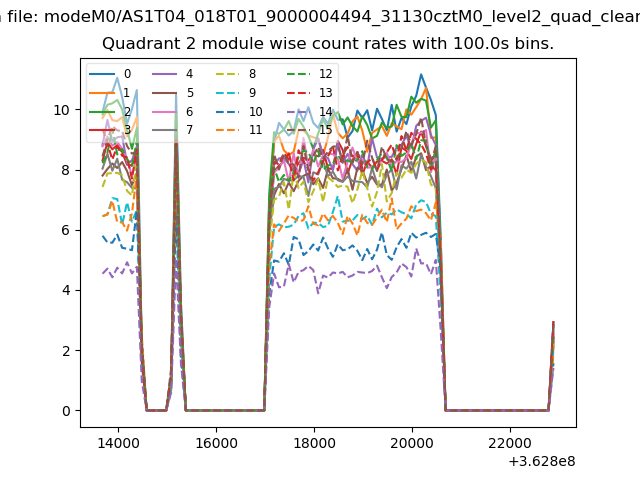
| Module-wise count rates for Quadrant B Data is divided into 100 sec bins |
 |
 |
| Module-wise count rates for Quadrant C Data is divided into 100 sec bins |
 |
 |
| Module-wise count rates for Quadrant D Data is divided into 100 sec bins |
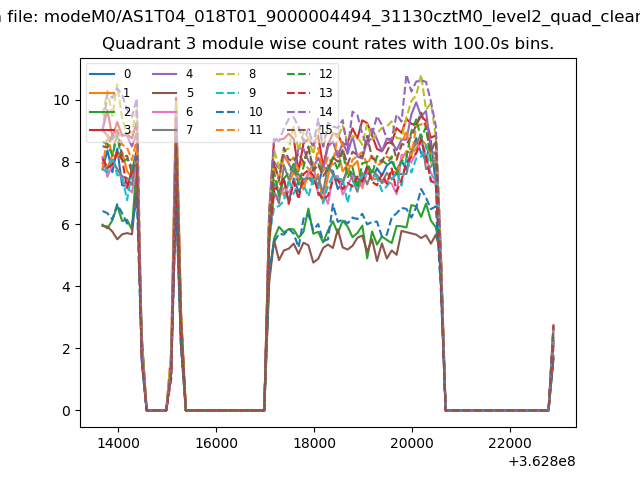 |
 |
| Parameter | Plot |
|---|---|
| CZT HV Monitor | 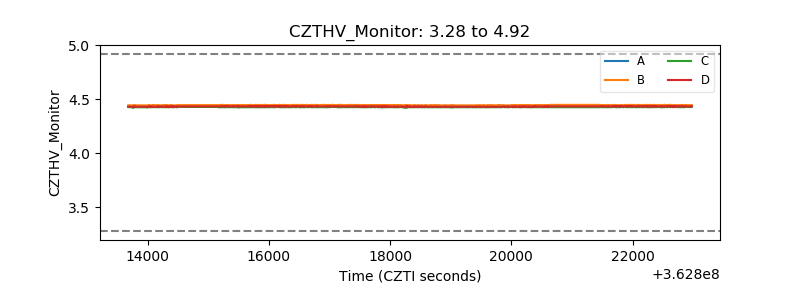 |
| D_VDD | 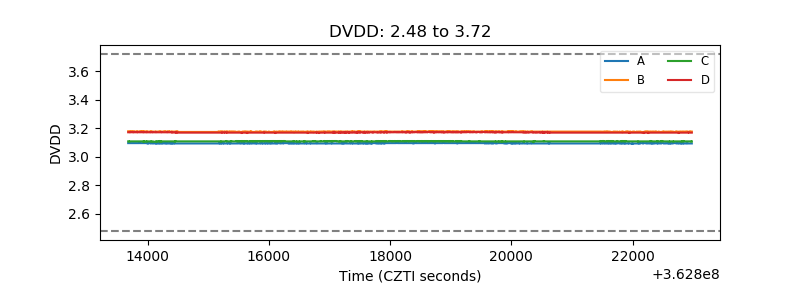 |
| Temperature 1 |  |
| Veto HV Monitor | 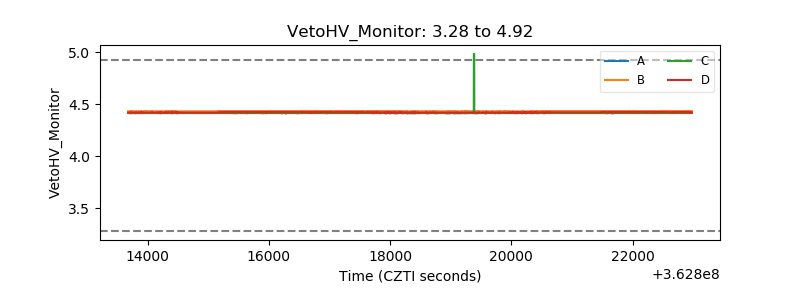 |
| Veto LLD | 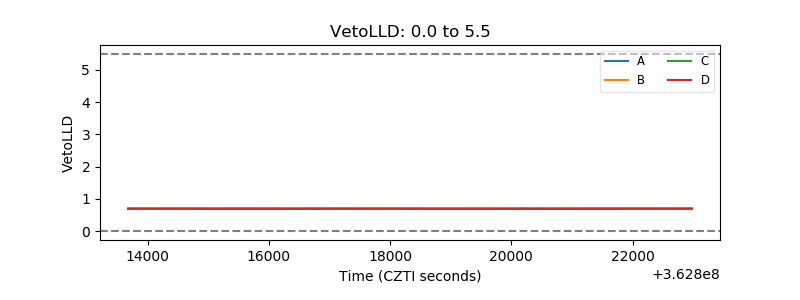 |
| Alpha Counter | 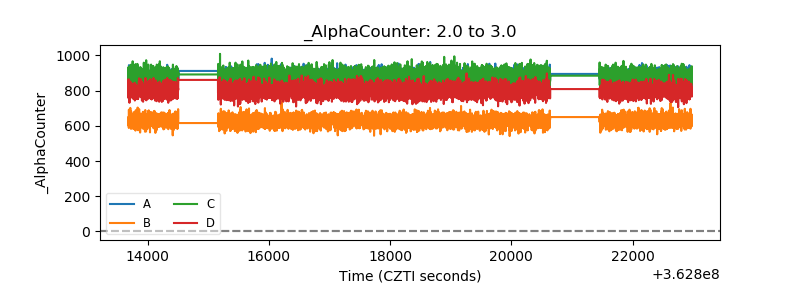 |
| _CPM_Rate | 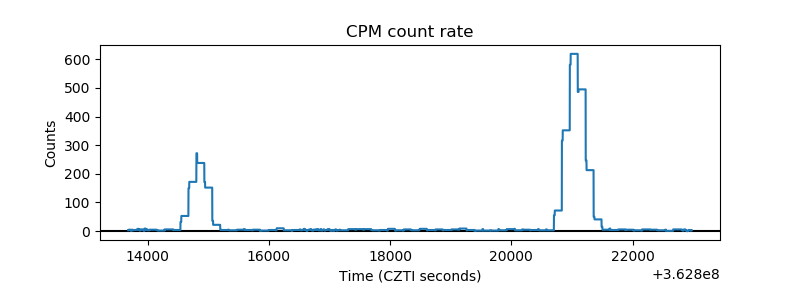 |
| CZT Counter | 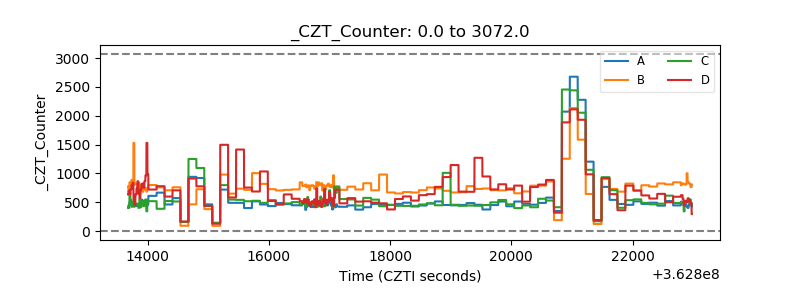 |
| +2.5 Volts monitor |  |
| +5 Volts monitor | 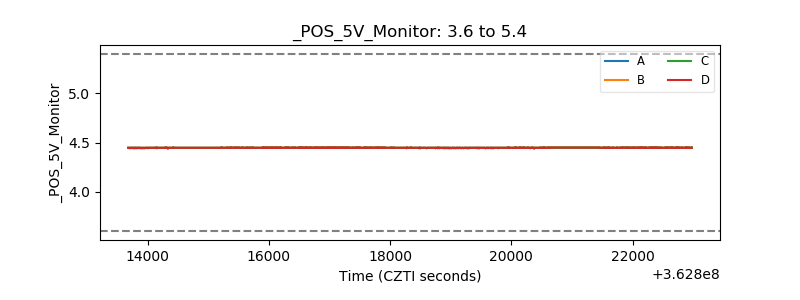 |
| _ROLL_ROT | 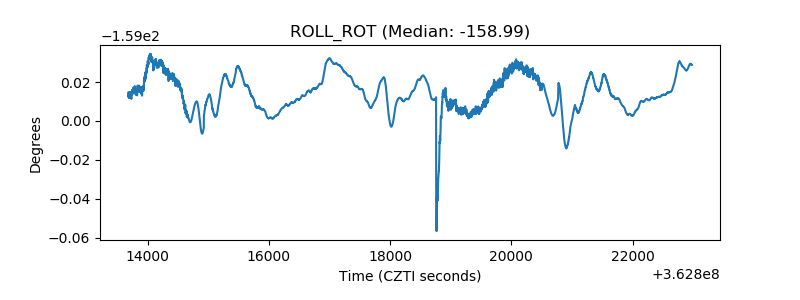 |
| _Roll_DEC | 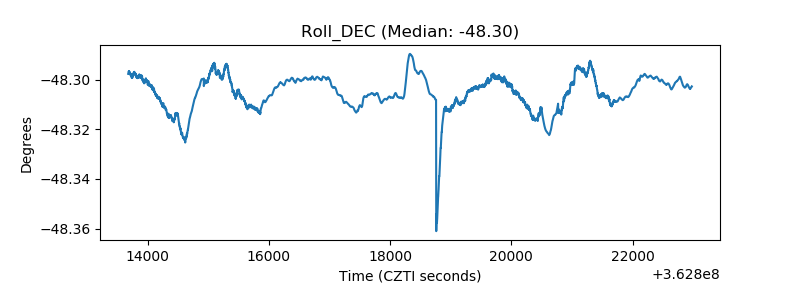 |
| _Roll_RA | 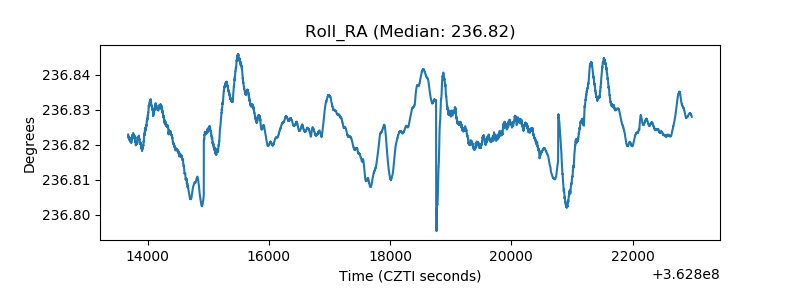 |
| Veto Counter | 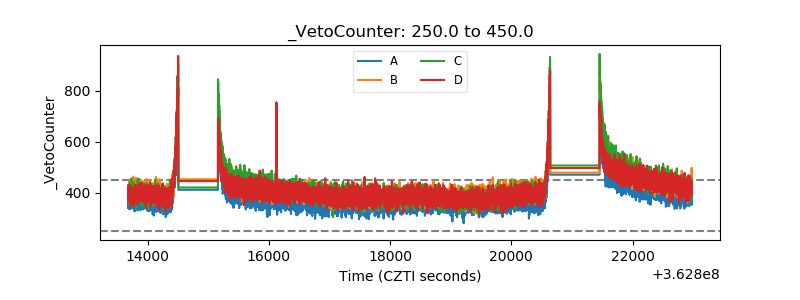 |