| Param | Original file | Final file |
|---|---|---|
| Filename | modeM0/AS1T04_018T01_9000004494_31133cztM0_level2.evt | modeM0/AS1T04_018T01_9000004494_31133cztM0_level2_quad_clean.evt |
| Size (bytes) | 555,886,080 | 102,427,200 |
| Size | 530.1 MB | 97.7 MB |
| Events in quadrant A | 3,342,837 | 678,053 |
| Events in quadrant B | 5,182,754 | 671,804 |
| Events in quadrant C | 3,639,643 | 652,971 |
| Events in quadrant D | 4,227,711 | 643,976 |
| Mode M0 | |||
|---|---|---|---|
| Quadrant | BADHDUFLAG | Total packets | Discarded packets |
| A | 0 | 14159 | 2 |
| B | 0 | 20121 | 2 |
| C | 0 | 15070 | 2 |
| D | 0 | 17472 | 2 |
| Mode M9 | |||
|---|---|---|---|
| Quadrant | BADHDUFLAG | Total packets | Discarded packets |
| A | 0 | 18 | 0 |
| B | 0 | 19 | 0 |
| C | 0 | 19 | 0 |
| D | 0 | 19 | 0 |
| Mode SS | |||
|---|---|---|---|
| Quadrant | BADHDUFLAG | Total packets | Discarded packets |
| A | 0 | 130 | 0 |
| B | 0 | 130 | 0 |
| C | 0 | 130 | 0 |
| D | 0 | 130 | 0 |
| Quadrant | Total seconds | Saturated seconds | Saturation percentage |
|---|---|---|---|
| A | 6538 | 67 | 1.024778% |
| B | 6538 | 149 | 2.278984% |
| C | 6538 | 242 | 3.701438% |
| D | 6538 | 74 | 1.131845% |
Noise dominated data is calculated using 1-second bins in cleaned event files. If a bin has >2000 counts, and if more than 50% of those come from <1% of pixels, then it is considered to be noise-dominated and hence unusable.
| Quadrant | # 1 sec bins | Bins with >0 counts | Bins with >2000 counts | High rate bins dominated by noise | Noise dominated (total time) | Noise dominated (detector-on time) | Marked lightcurve |
|---|---|---|---|---|---|---|---|
| A | 7653 | 6539 | 0 | 0 | 0.00% | 0.00% | 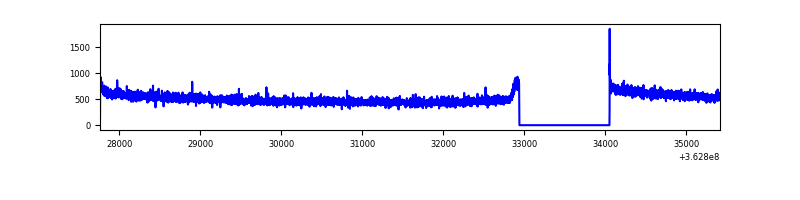 |
| B | 7653 | 6539 | 4 | 4 | 0.05% | 0.06% | 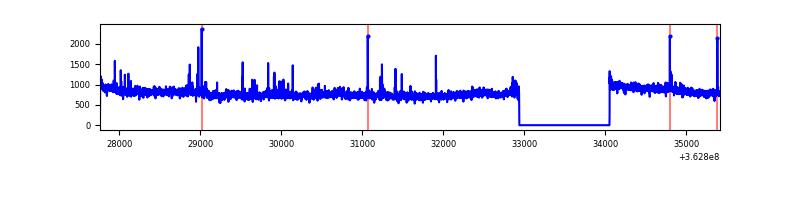 |
| C | 7653 | 6539 | 30 | 30 | 0.39% | 0.46% | 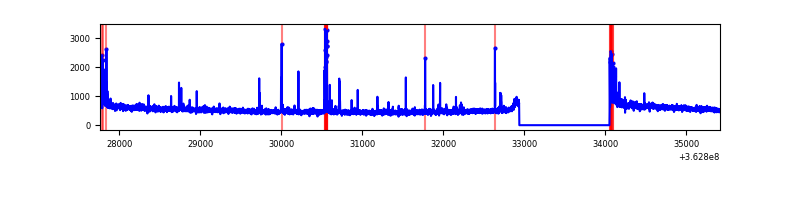 |
| D | 7653 | 6539 | 11 | 11 | 0.14% | 0.17% | 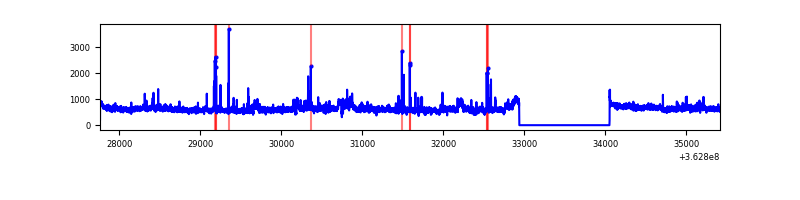 |
Top three noisy pixels from each quadrant. If the there are fewer than three noisy pixels in the level2.evt file, extra rows are filled as -1
| Pixel properties | Quadrant properties | ||||||
|---|---|---|---|---|---|---|---|
| Quadrant | DetID | PixID | Counts | Sigma | Mean | Median | Sigma |
| A | 13 | 254 | 12111 | 66.11 | 865 | 850 | 170.3 |
| A | 3 | 137 | 8302 | 43.75 | 865 | 850 | 170.3 |
| A | 0 | 226 | 7421 | 38.57 | 865 | 850 | 170.3 |
| B | 6 | 159 | 1736224 | 10817.45 | 849 | 829 | 160.4 |
| B | 0 | 190 | 31283 | 189.83 | 849 | 829 | 160.4 |
| B | 0 | 230 | 19691 | 117.57 | 849 | 829 | 160.4 |
| C | 0 | 10 | 210731 | 1102.79 | 819 | 826 | 190.3 |
| C | 14 | 238 | 134617 | 702.91 | 819 | 826 | 190.3 |
| C | 14 | 176 | 59156 | 306.45 | 819 | 826 | 190.3 |
| D | 8 | 195 | 932365 | 4369.08 | 832 | 817 | 213.2 |
| D | 2 | 250 | 64609 | 299.19 | 832 | 817 | 213.2 |
| D | 2 | 120 | 27883 | 126.94 | 832 | 817 | 213.2 |
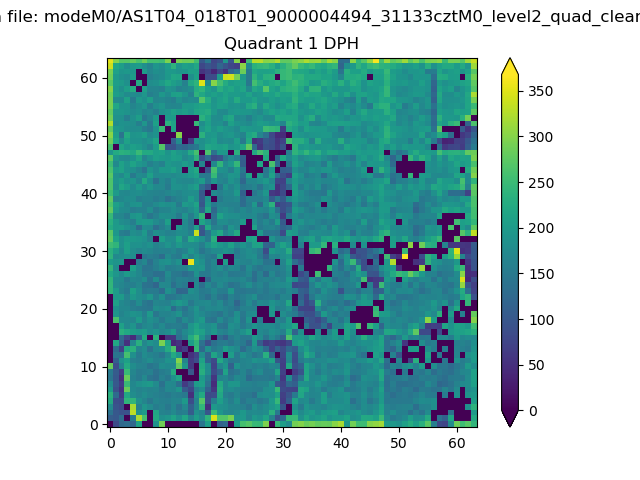
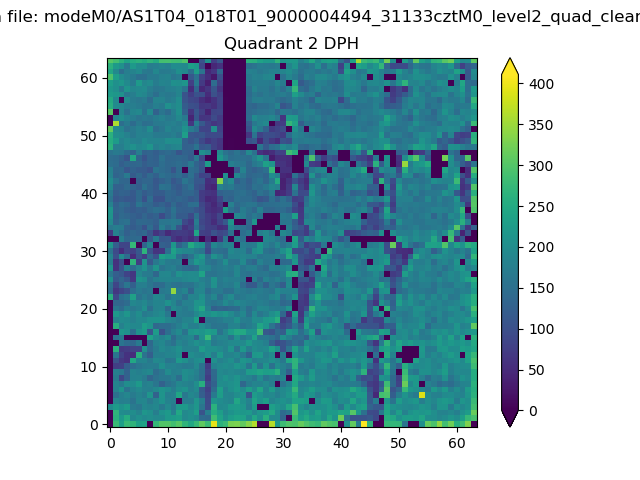
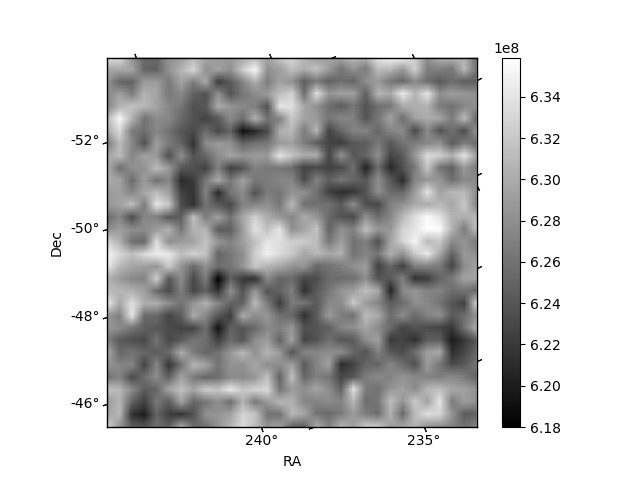
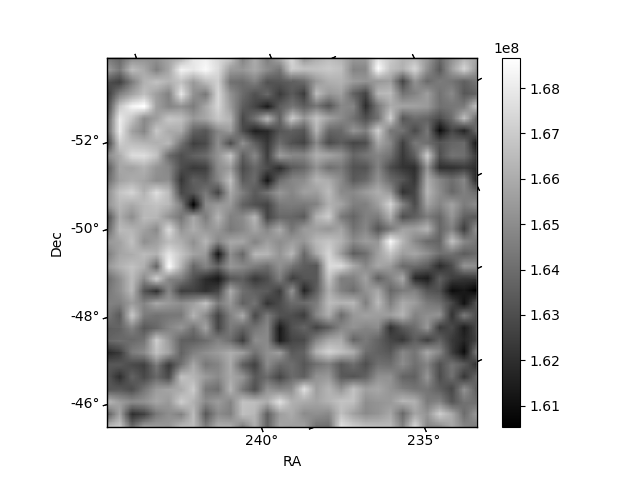
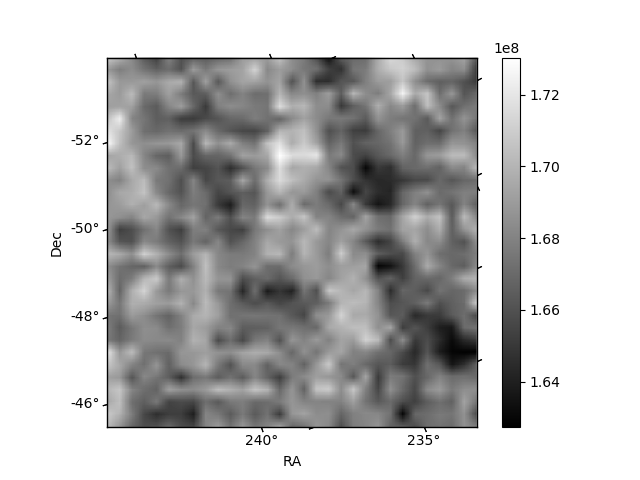
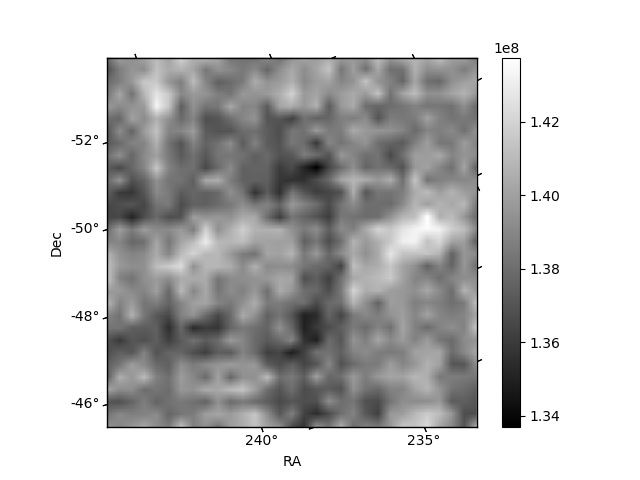
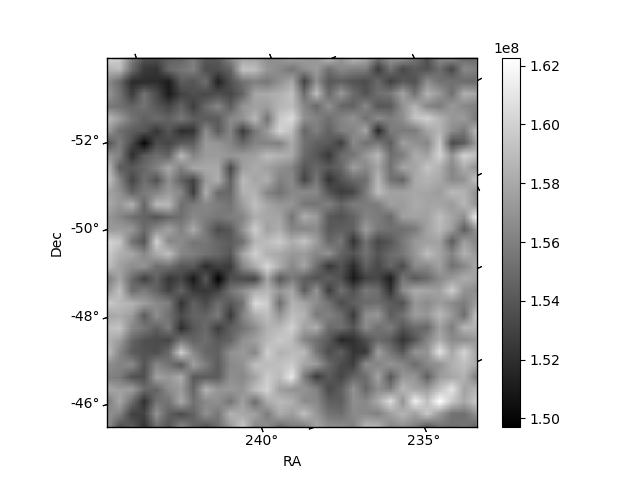
Histogram calculated using DETX and DETY for each event in the final _common_clean file
| Quadrant A |  |
 |
Quadrant B |
|---|---|---|---|
| Quadrant D | 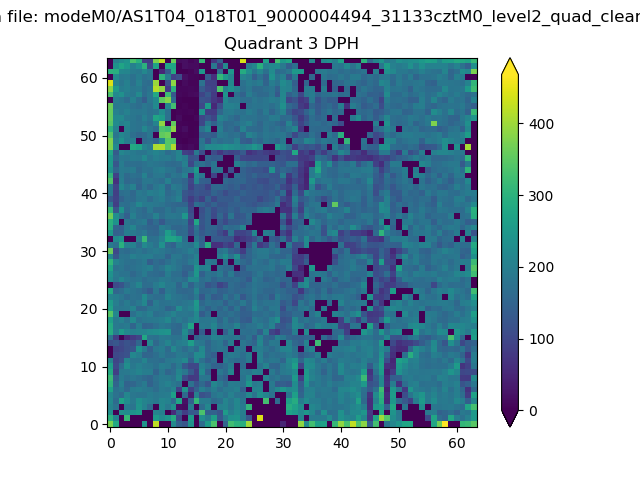 |
 |
Quadrant C |
| Plot type | Count rate plots | Images |
|---|---|---|
| Comparison with Poisson distribution Blue bars denote a histogram of data divided into 1 sec bins. Red curve is a Poisson curve with rate = median count rate of data. |
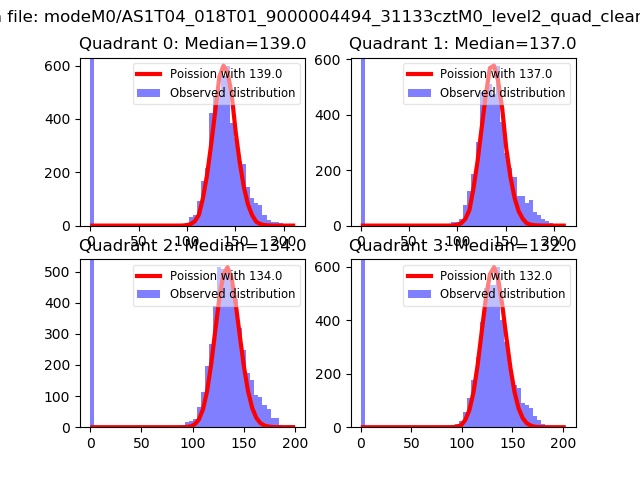 |
 |
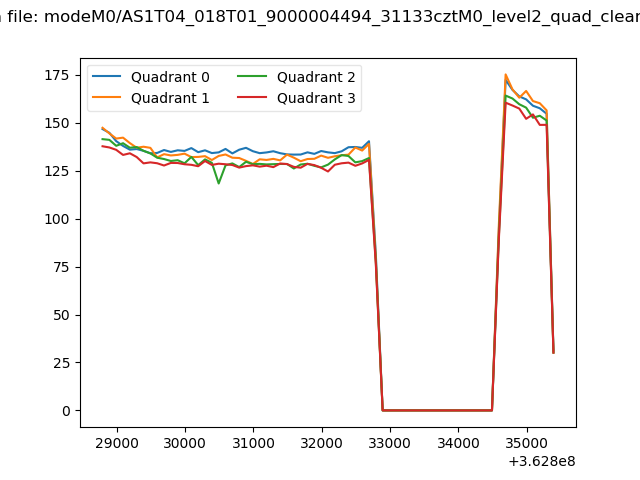
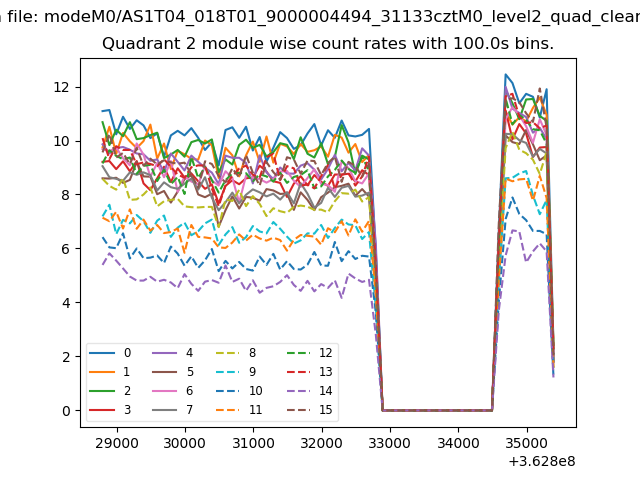
| Quadrant-wise count rates Data is divided into 100 sec bins |
 |
|
| Module-wise count rates for Quadrant A Data is divided into 100 sec bins |
 |
 |
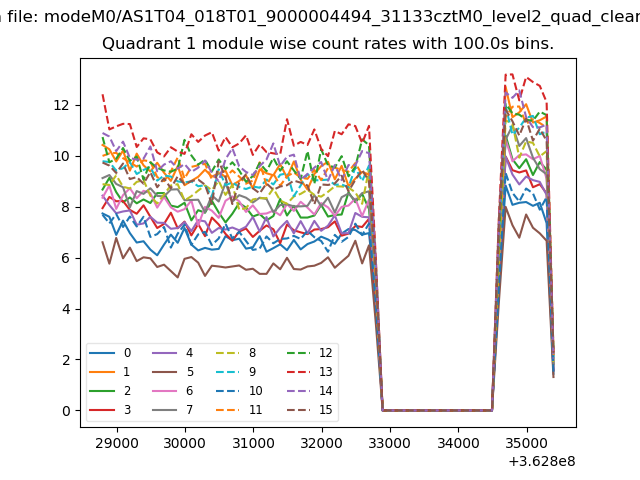
| Module-wise count rates for Quadrant B Data is divided into 100 sec bins |
 |
 |
| Module-wise count rates for Quadrant C Data is divided into 100 sec bins |
 |
 |
| Module-wise count rates for Quadrant D Data is divided into 100 sec bins |
 |
 |
| Parameter | Plot |
|---|---|
| CZT HV Monitor |  |
| D_VDD | 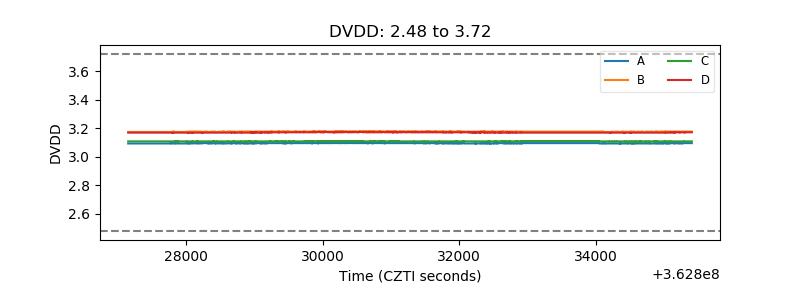 |
| Temperature 1 |  |
| Veto HV Monitor | 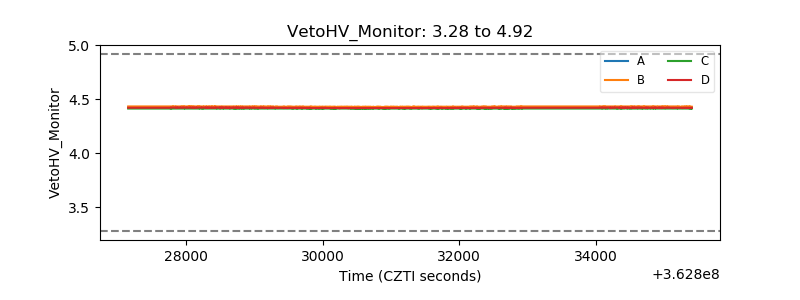 |
| Veto LLD | 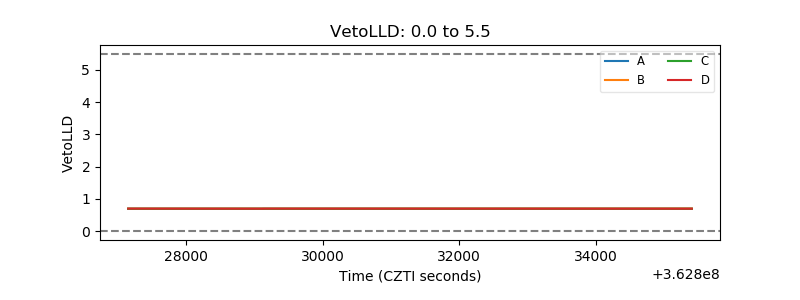 |
| Alpha Counter | 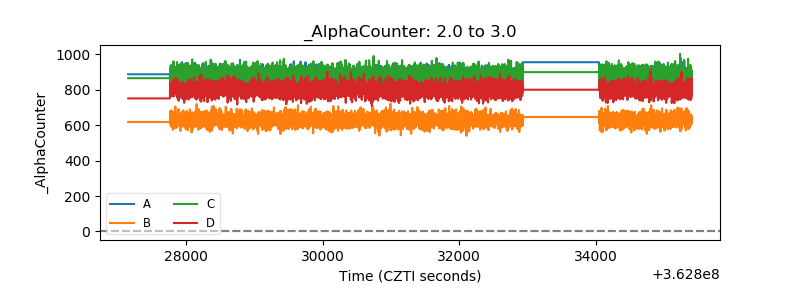 |
| _CPM_Rate | 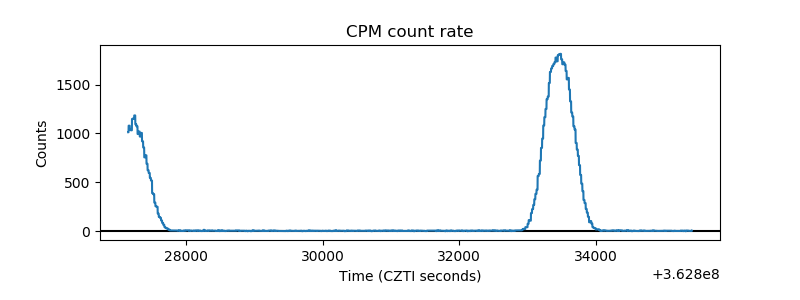 |
| CZT Counter | 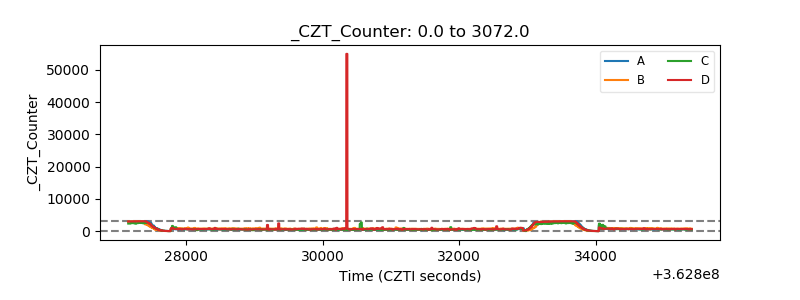 |
| +2.5 Volts monitor | 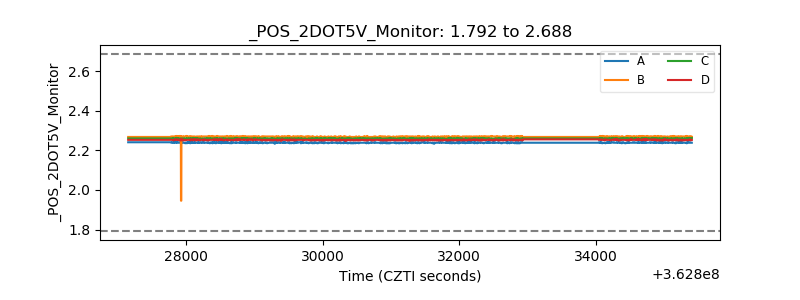 |
| +5 Volts monitor |  |
| _ROLL_ROT |  |
| _Roll_DEC | 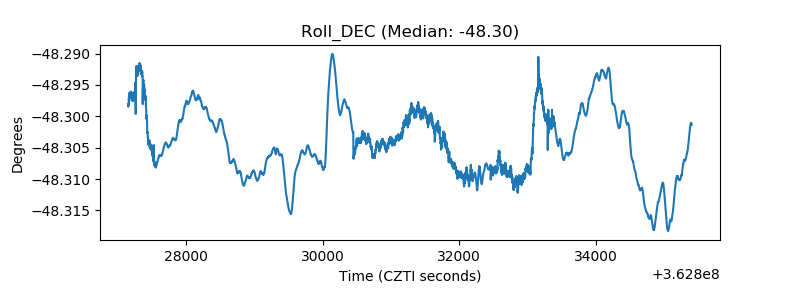 |
| _Roll_RA | 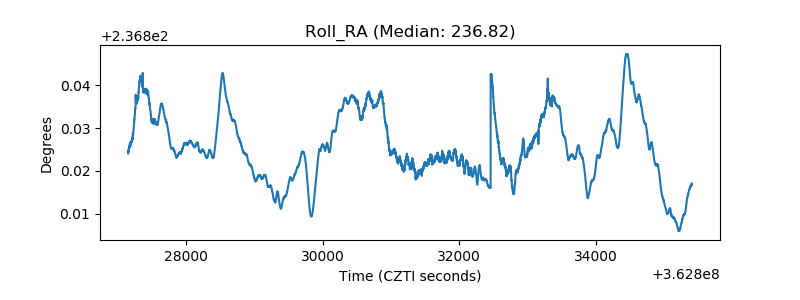 |
| Veto Counter | 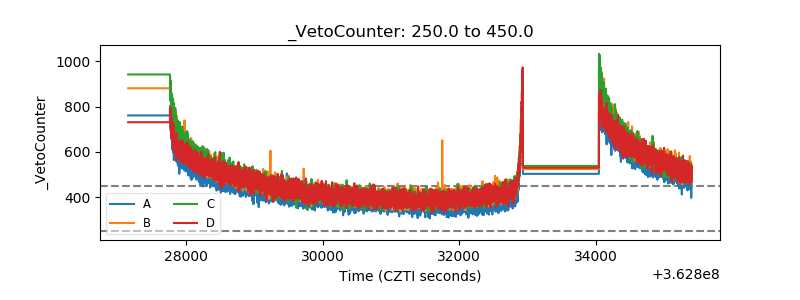 |