| Param | Original file | Final file |
|---|---|---|
| Filename | modeM0/AS1T04_018T01_9000004494_31134cztM0_level2.evt | modeM0/AS1T04_018T01_9000004494_31134cztM0_level2_quad_clean.evt |
| Size (bytes) | 190,054,080 | 39,991,680 |
| Size | 181.2 MB | 38.1 MB |
| Events in quadrant A | 1,148,809 | 271,255 |
| Events in quadrant B | 1,749,380 | 270,312 |
| Events in quadrant C | 1,157,976 | 261,321 |
| Events in quadrant D | 1,553,461 | 253,921 |
| Mode M0 | |||
|---|---|---|---|
| Quadrant | BADHDUFLAG | Total packets | Discarded packets |
| A | 0 | 4734 | 0 |
| B | 0 | 6574 | 0 |
| C | 0 | 4836 | 0 |
| D | 0 | 6312 | 0 |
| Mode SS | |||
|---|---|---|---|
| Quadrant | BADHDUFLAG | Total packets | Discarded packets |
| A | 0 | 42 | 0 |
| B | 0 | 42 | 0 |
| C | 0 | 42 | 0 |
| D | 0 | 42 | 0 |
| Quadrant | Total seconds | Saturated seconds | Saturation percentage |
|---|---|---|---|
| A | 2124 | 2 | 0.094162% |
| B | 2125 | 20 | 0.941176% |
| C | 2125 | 24 | 1.129412% |
| D | 2125 | 9 | 0.423529% |
Noise dominated data is calculated using 1-second bins in cleaned event files. If a bin has >2000 counts, and if more than 50% of those come from <1% of pixels, then it is considered to be noise-dominated and hence unusable.
| Quadrant | # 1 sec bins | Bins with >0 counts | Bins with >2000 counts | High rate bins dominated by noise | Noise dominated (total time) | Noise dominated (detector-on time) | Marked lightcurve |
|---|---|---|---|---|---|---|---|
| A | 2124 | 2124 | 0 | 0 | 0.00% | 0.00% | 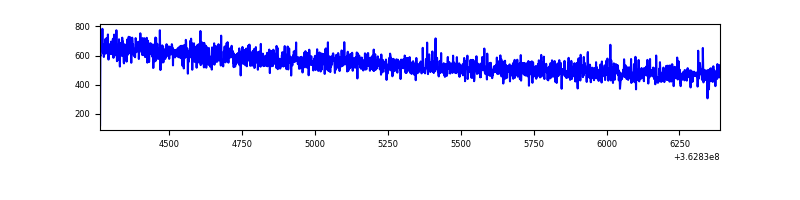 |
| B | 2125 | 2125 | 2 | 2 | 0.09% | 0.09% | 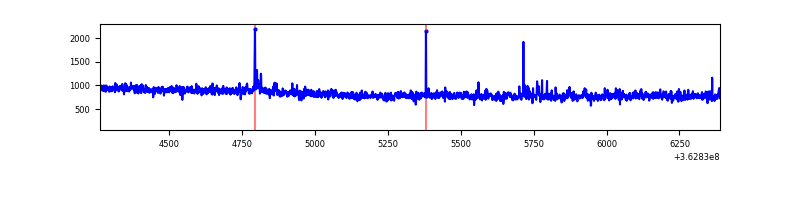 |
| C | 2125 | 2125 | 0 | 0 | 0.00% | 0.00% | 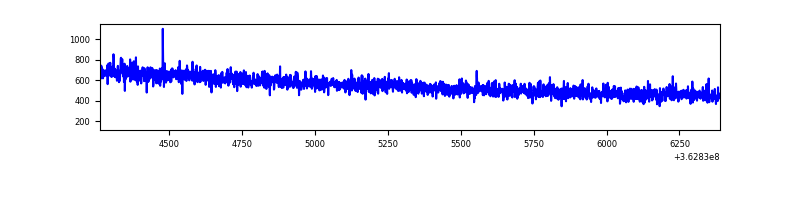 |
| D | 2125 | 2125 | 4 | 4 | 0.19% | 0.19% | 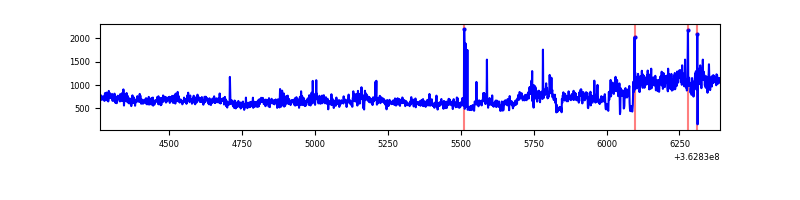 |
Top three noisy pixels from each quadrant. If the there are fewer than three noisy pixels in the level2.evt file, extra rows are filled as -1
| Pixel properties | Quadrant properties | ||||||
|---|---|---|---|---|---|---|---|
| Quadrant | DetID | PixID | Counts | Sigma | Mean | Median | Sigma |
| A | 13 | 254 | 3652 | 55.6 | 298 | 293 | 60.4 |
| A | 3 | 137 | 2681 | 39.52 | 298 | 293 | 60.4 |
| A | 0 | 226 | 2644 | 38.91 | 298 | 293 | 60.4 |
| B | 6 | 159 | 570750 | 10096.74 | 289 | 282 | 56.5 |
| B | 0 | 190 | 14321 | 248.48 | 289 | 282 | 56.5 |
| B | 0 | 230 | 9036 | 154.94 | 289 | 282 | 56.5 |
| C | 14 | 238 | 47461 | 715.3 | 280 | 282 | 66.0 |
| C | 12 | 175 | 6780 | 98.52 | 280 | 282 | 66.0 |
| C | 0 | 10 | 4795 | 68.42 | 280 | 282 | 66.0 |
| D | 8 | 195 | 426077 | 5570.13 | 286 | 282 | 76.4 |
| D | 2 | 250 | 13702 | 175.56 | 286 | 282 | 76.4 |
| D | 12 | 218 | 8576 | 108.5 | 286 | 282 | 76.4 |
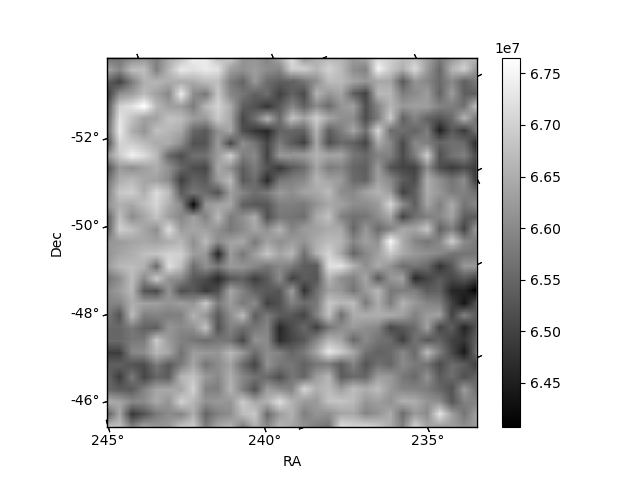
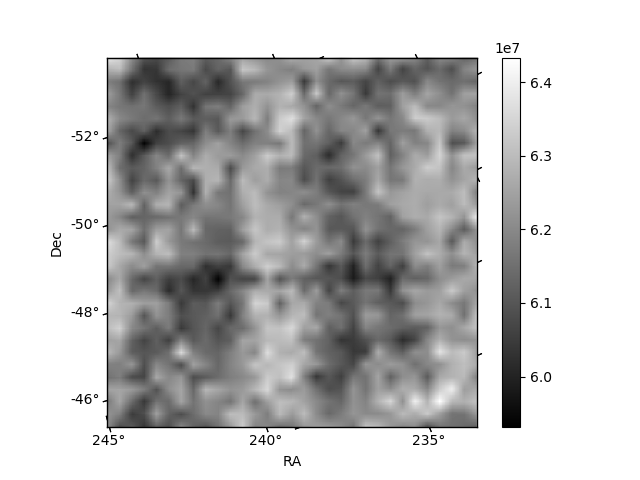
Histogram calculated using DETX and DETY for each event in the final _common_clean file
| Quadrant A |  |
 |
Quadrant B |
|---|---|---|---|
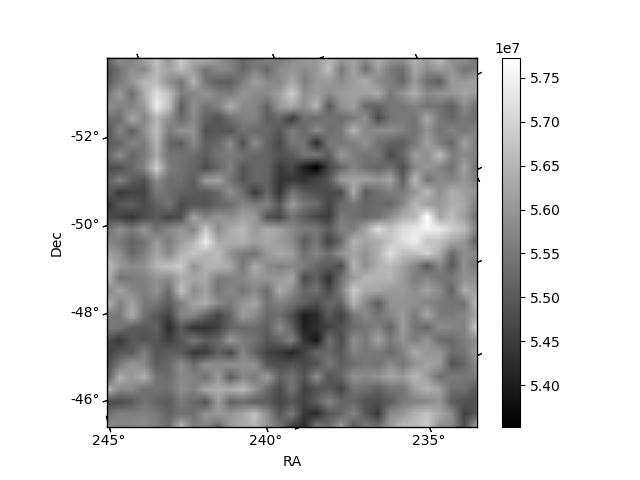
| Quadrant D |  |
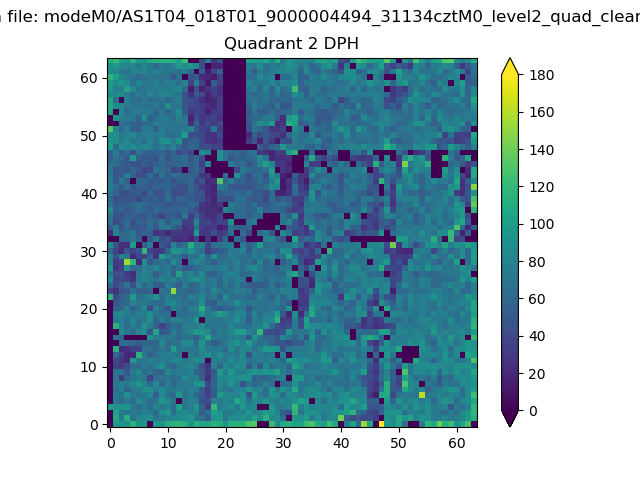 |
Quadrant C |
| Plot type | Count rate plots | Images |
|---|---|---|
| Comparison with Poisson distribution Blue bars denote a histogram of data divided into 1 sec bins. Red curve is a Poisson curve with rate = median count rate of data. |
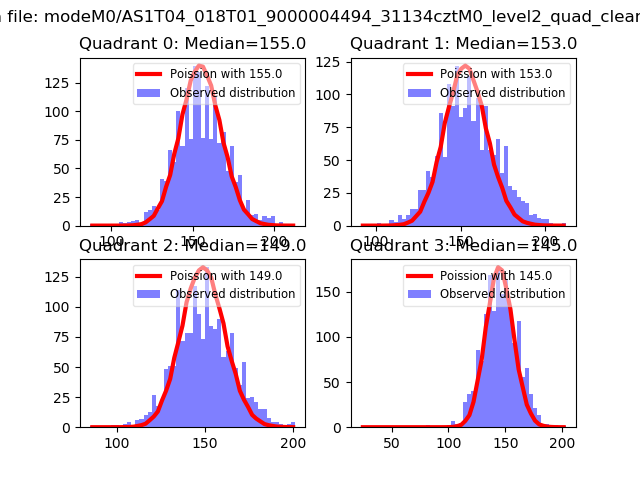 |
 |
| Quadrant-wise count rates Data is divided into 100 sec bins |
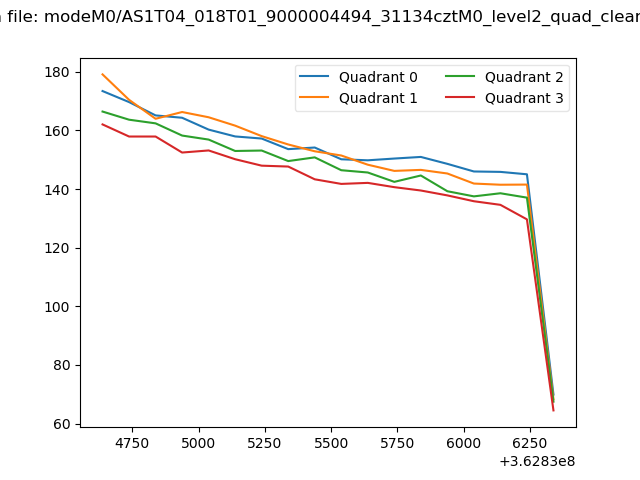 |
|
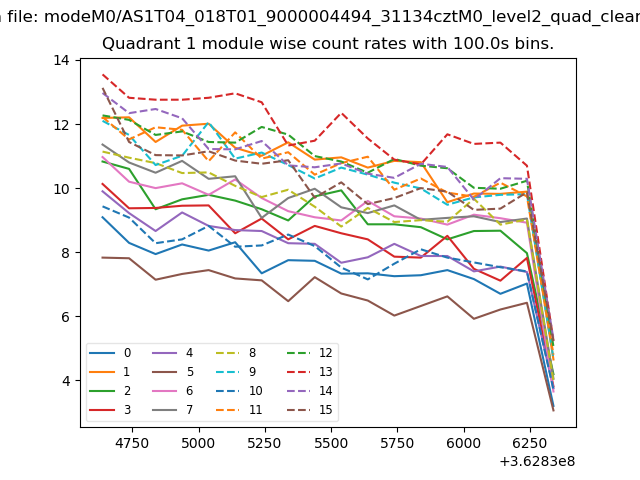
| Module-wise count rates for Quadrant A Data is divided into 100 sec bins |
 |
 |
| Module-wise count rates for Quadrant B Data is divided into 100 sec bins |
 |
 |
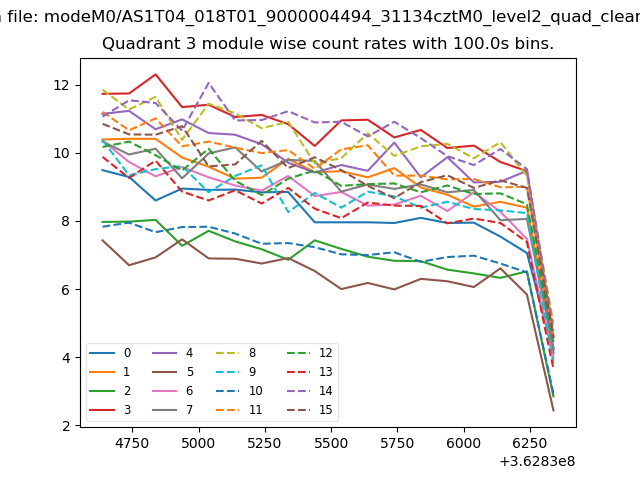
| Module-wise count rates for Quadrant C Data is divided into 100 sec bins |
 |
 |
| Module-wise count rates for Quadrant D Data is divided into 100 sec bins |
 |
 |
| Parameter | Plot |
|---|---|
| CZT HV Monitor |  |
| D_VDD | 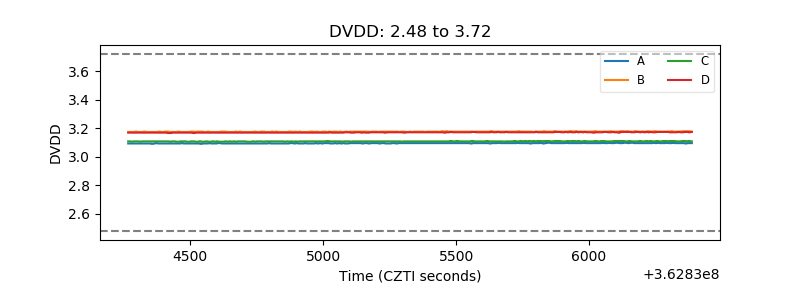 |
| Temperature 1 | 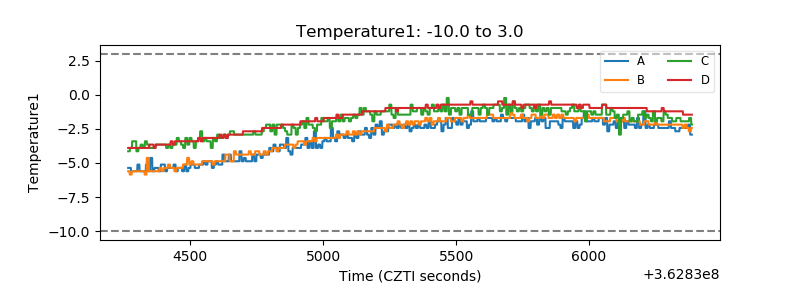 |
| Veto HV Monitor | 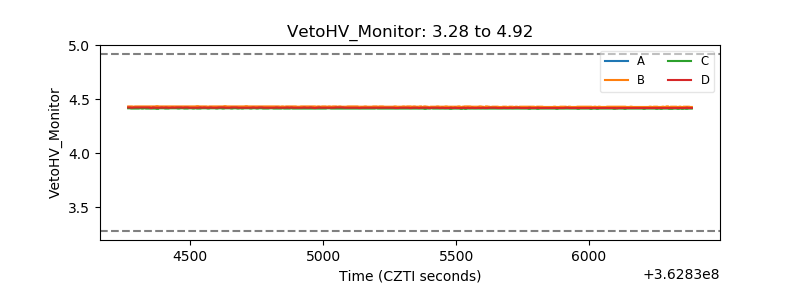 |
| Veto LLD | 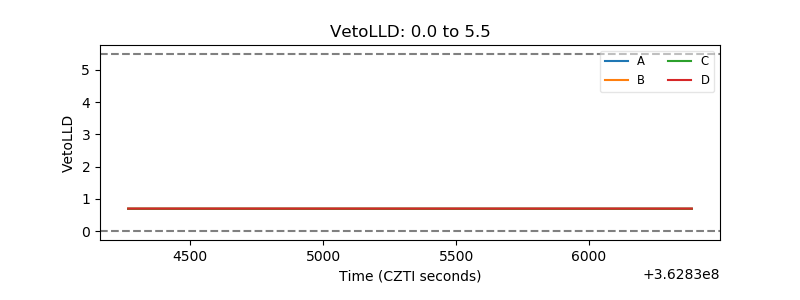 |
| Alpha Counter | 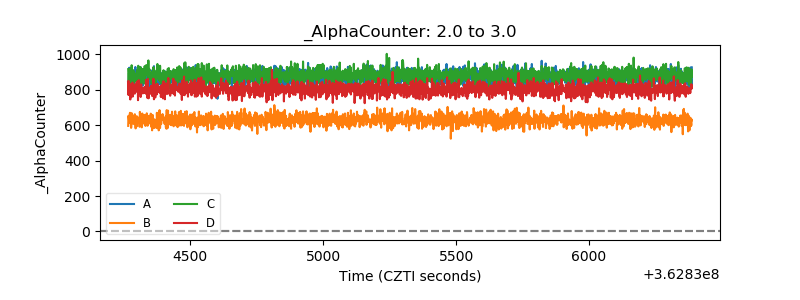 |
| _CPM_Rate | 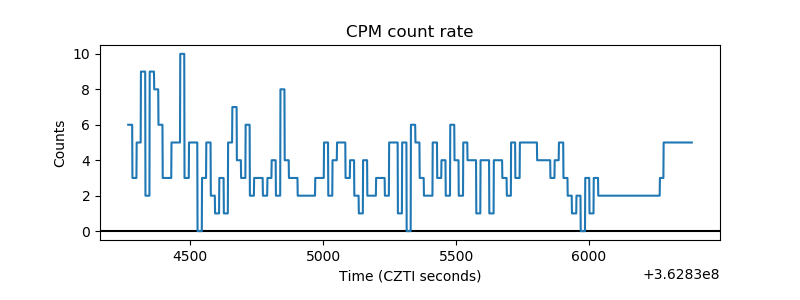 |
| CZT Counter | 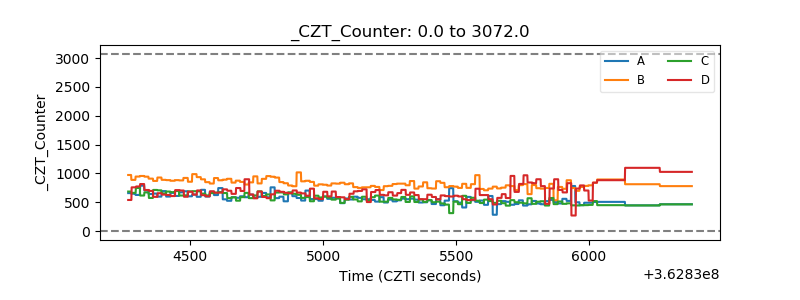 |
| +2.5 Volts monitor |  |
| +5 Volts monitor | 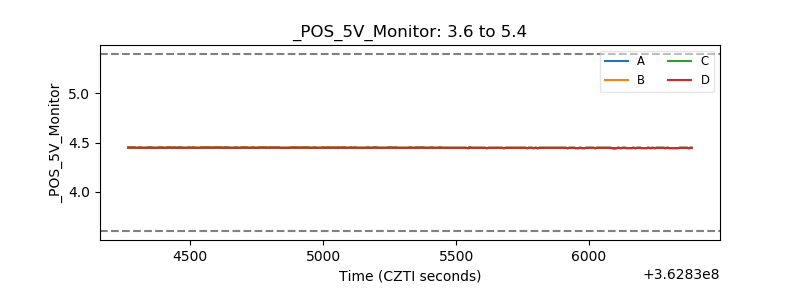 |
| _ROLL_ROT | 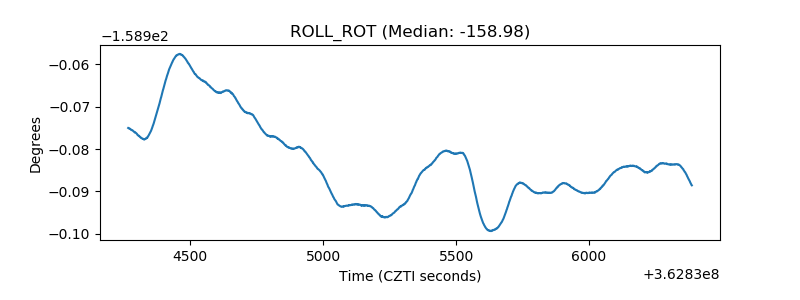 |
| _Roll_DEC | 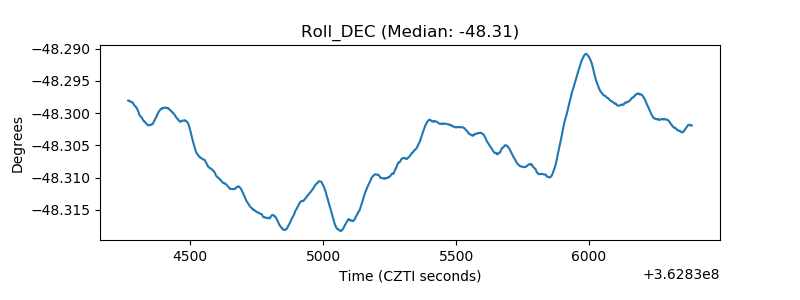 |
| _Roll_RA | 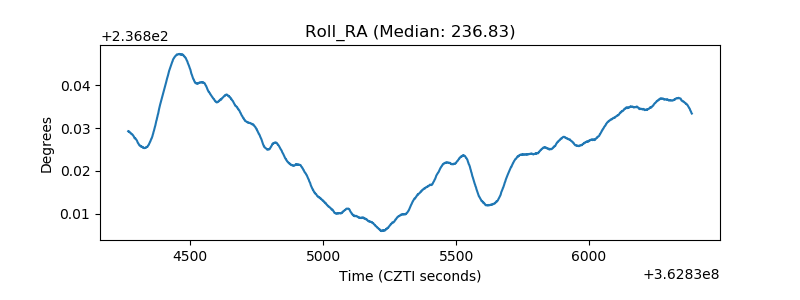 |
| Veto Counter | 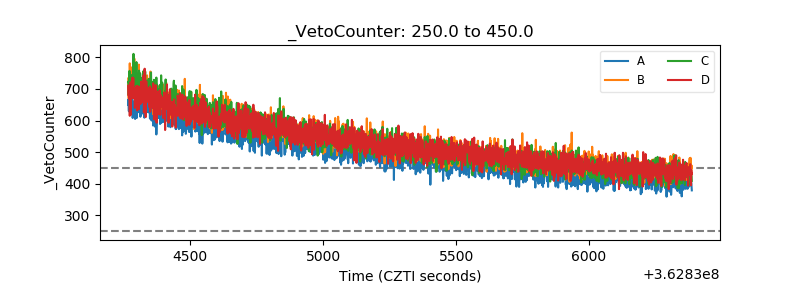 |