| Param | Original file | Final file |
|---|---|---|
| Filename | modeM0/AS1T04_018T01_9000004494_31307cztM0_level2.evt | modeM0/AS1T04_018T01_9000004494_31307cztM0_level2_quad_clean.evt |
| Size (bytes) | 124,392,960 | 35,400,960 |
| Size | 118.6 MB | 33.8 MB |
| Events in quadrant A | 798,392 | 250,431 |
| Events in quadrant B | 1,181,849 | 246,126 |
| Events in quadrant C | 836,883 | 233,143 |
| Events in quadrant D | 848,311 | 233,653 |
| Mode M0 | |||
|---|---|---|---|
| Quadrant | BADHDUFLAG | Total packets | Discarded packets |
| A | 0 | 3669 | 442 |
| B | 0 | 5021 | 579 |
| C | 0 | 3820 | 458 |
| D | 0 | 3862 | 442 |
| Mode M9 | |||
|---|---|---|---|
| Quadrant | BADHDUFLAG | Total packets | Discarded packets |
| A | 0 | 9 | 2 |
| B | 0 | 12 | 3 |
| C | 0 | 10 | 3 |
| D | 0 | 10 | 2 |
| Mode SS | |||
|---|---|---|---|
| Quadrant | BADHDUFLAG | Total packets | Discarded packets |
| A | 0 | 36 | 6 |
| B | 0 | 34 | 4 |
| C | 0 | 35 | 5 |
| D | 0 | 34 | 6 |
| Quadrant | Total seconds | Saturated seconds | Saturation percentage |
|---|---|---|---|
| A | 1455 | 8 | 0.549828% |
| B | 1443 | 27 | 1.871102% |
| C | 1469 | 21 | 1.429544% |
| D | 1464 | 7 | 0.478142% |
Noise dominated data is calculated using 1-second bins in cleaned event files. If a bin has >2000 counts, and if more than 50% of those come from <1% of pixels, then it is considered to be noise-dominated and hence unusable.
| Quadrant | # 1 sec bins | Bins with >0 counts | Bins with >2000 counts | High rate bins dominated by noise | Noise dominated (total time) | Noise dominated (detector-on time) | Marked lightcurve |
|---|---|---|---|---|---|---|---|
| A | 1490 | 1482 | 0 | 0 | 0.00% | 0.00% | 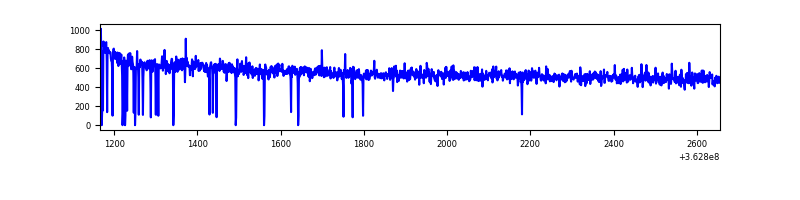 |
| B | 1490 | 1478 | 0 | 0 | 0.00% | 0.00% | 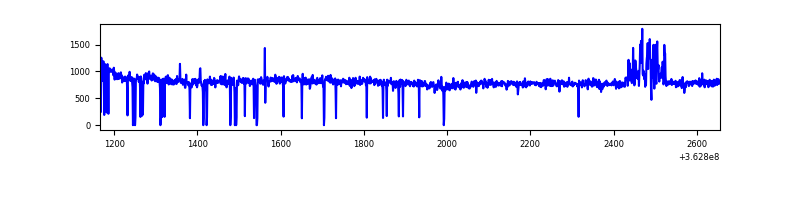 |
| C | 1490 | 1486 | 1 | 1 | 0.07% | 0.07% | 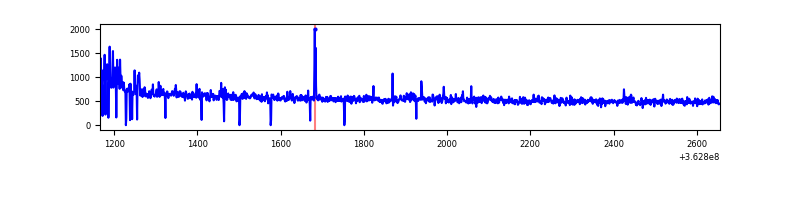 |
| D | 1490 | 1481 | 0 | 0 | 0.00% | 0.00% | 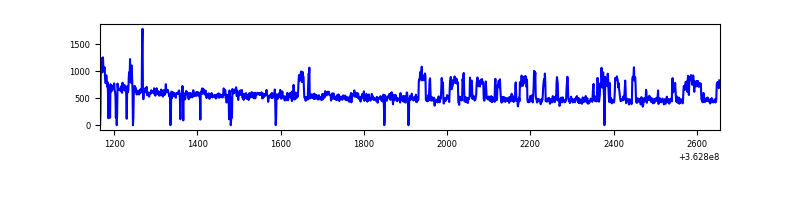 |
Top three noisy pixels from each quadrant. If the there are fewer than three noisy pixels in the level2.evt file, extra rows are filled as -1
| Pixel properties | Quadrant properties | ||||||
|---|---|---|---|---|---|---|---|
| Quadrant | DetID | PixID | Counts | Sigma | Mean | Median | Sigma |
| A | 13 | 254 | 2555 | 56.52 | 206 | 203 | 41.6 |
| A | 0 | 226 | 1726 | 36.6 | 206 | 203 | 41.6 |
| A | 3 | 137 | 1716 | 36.36 | 206 | 203 | 41.6 |
| B | 6 | 159 | 370156 | 9471.57 | 199 | 196 | 39.1 |
| B | 15 | 33 | 27470 | 698.26 | 199 | 196 | 39.1 |
| B | 12 | 111 | 4409 | 107.86 | 199 | 196 | 39.1 |
| C | 14 | 238 | 32792 | 700.67 | 193 | 195 | 46.5 |
| C | 3 | 233 | 27411 | 585.01 | 193 | 195 | 46.5 |
| C | 0 | 10 | 19683 | 418.89 | 193 | 195 | 46.5 |
| D | 8 | 195 | 106072 | 2222.56 | 195 | 191 | 47.6 |
| D | 2 | 234 | 3875 | 77.33 | 195 | 191 | 47.6 |
| D | 3 | 238 | 2994 | 58.84 | 195 | 191 | 47.6 |
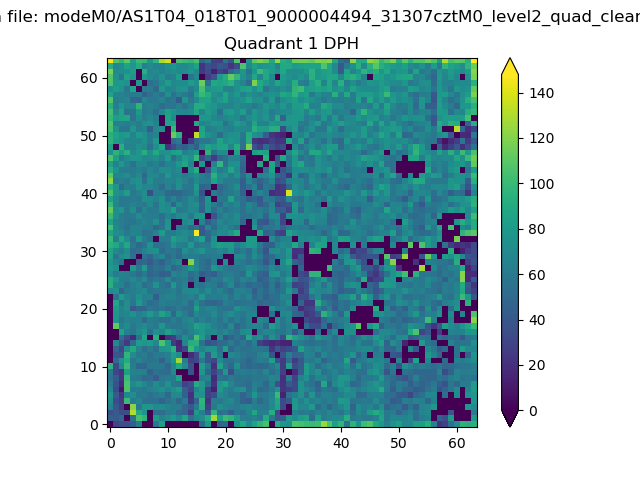
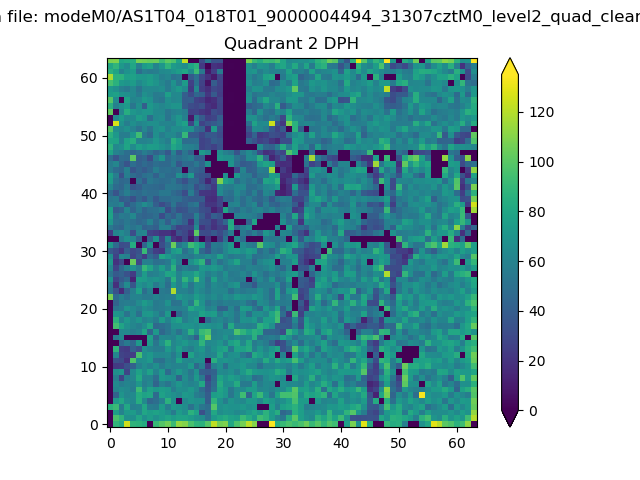
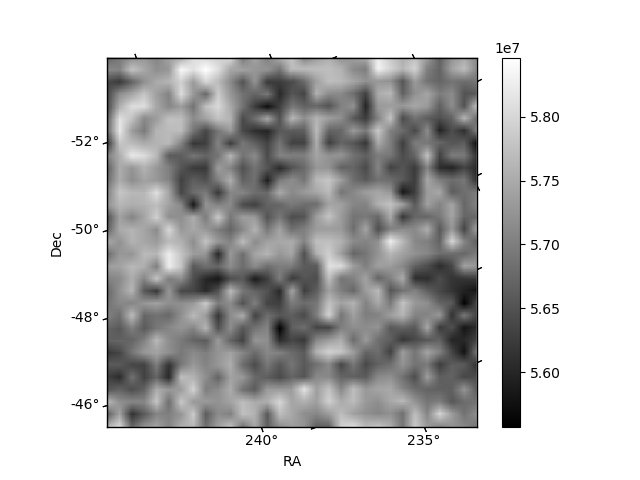
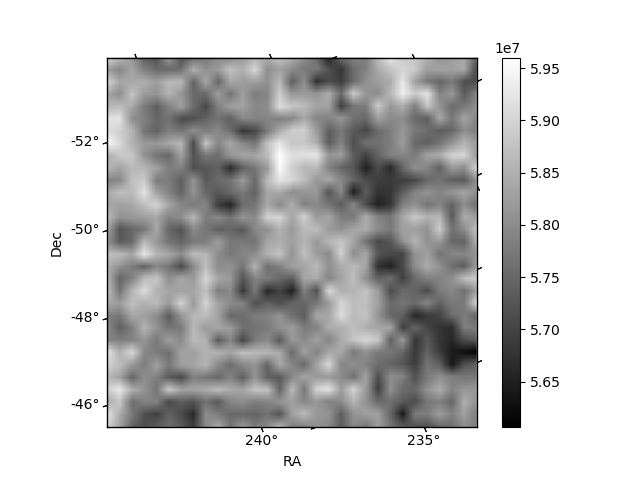
Histogram calculated using DETX and DETY for each event in the final _common_clean file
| Quadrant A |  |
 |
Quadrant B |
|---|---|---|---|
| Quadrant D |  |
 |
Quadrant C |
| Plot type | Count rate plots | Images |
|---|---|---|
| Comparison with Poisson distribution Blue bars denote a histogram of data divided into 1 sec bins. Red curve is a Poisson curve with rate = median count rate of data. |
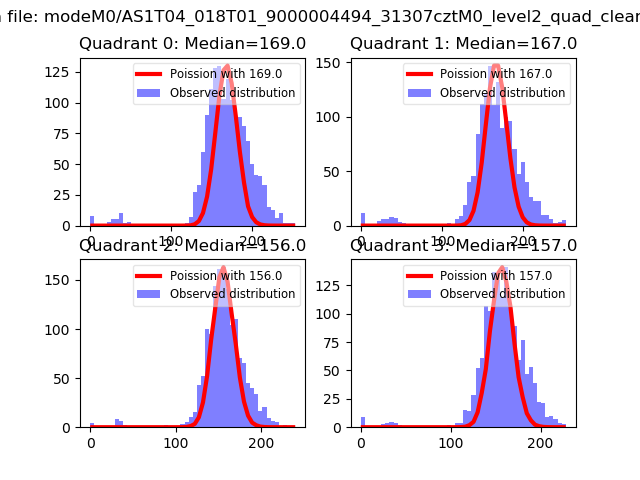 |
 |
| Quadrant-wise count rates Data is divided into 100 sec bins |
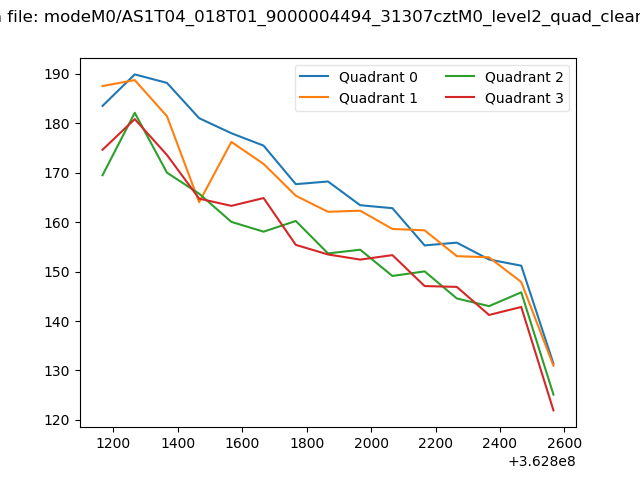 |
|
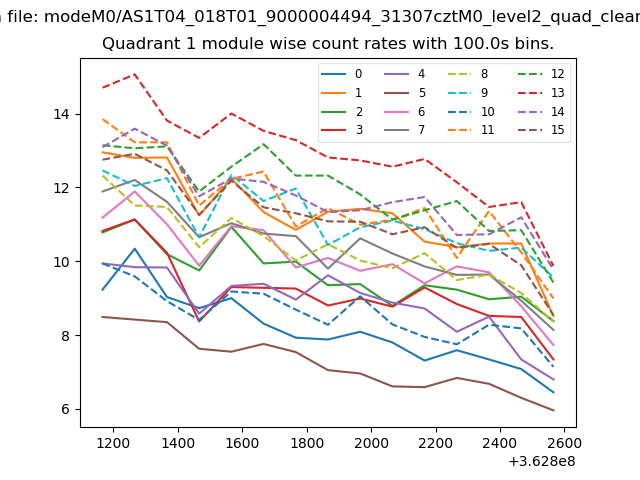
| Module-wise count rates for Quadrant A Data is divided into 100 sec bins |
 |
 |
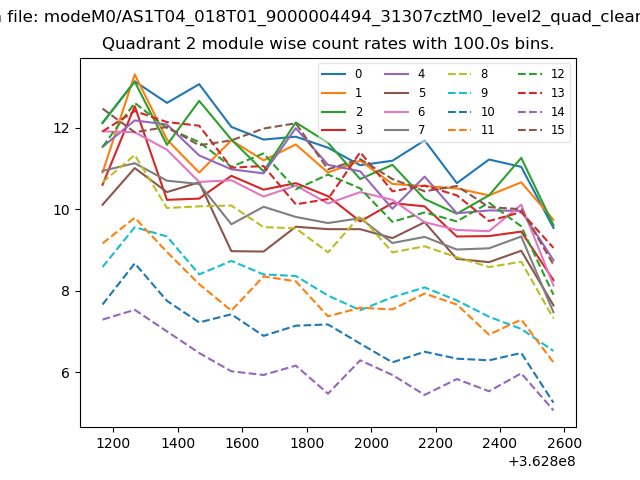
| Module-wise count rates for Quadrant B Data is divided into 100 sec bins |
 |
 |
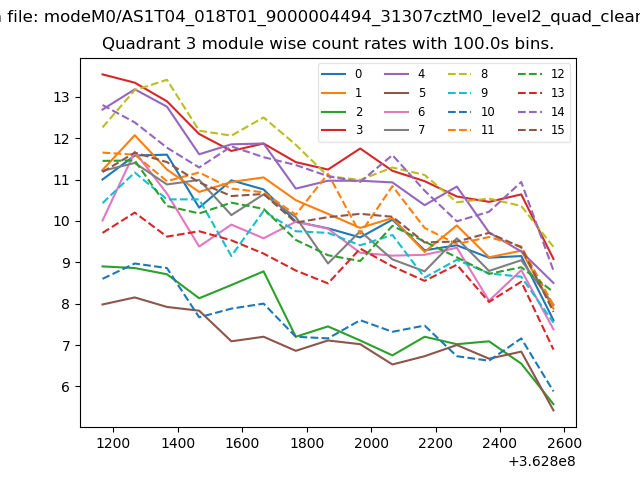
| Module-wise count rates for Quadrant C Data is divided into 100 sec bins |
 |
 |
| Module-wise count rates for Quadrant D Data is divided into 100 sec bins |
 |
 |
| Parameter | Plot |
|---|---|
| CZT HV Monitor |  |
| D_VDD |  |
| Temperature 1 | 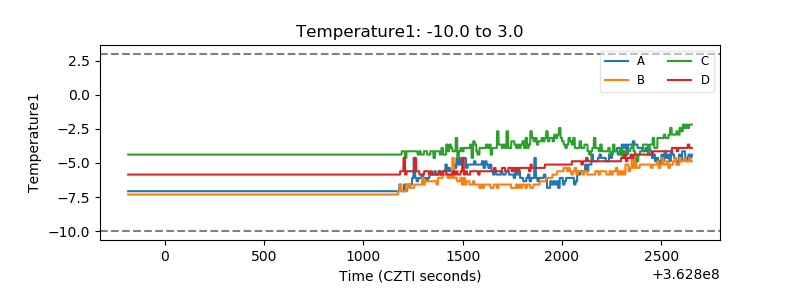 |
| Veto HV Monitor | 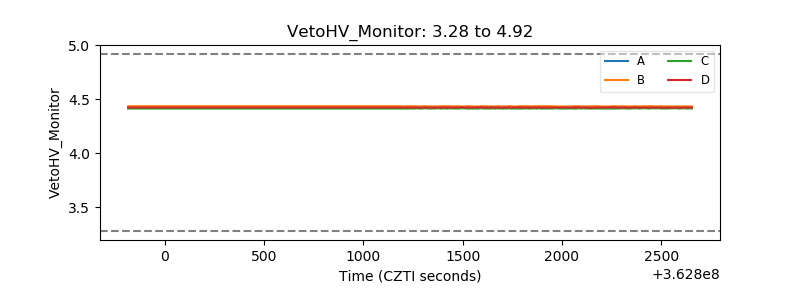 |
| Veto LLD | 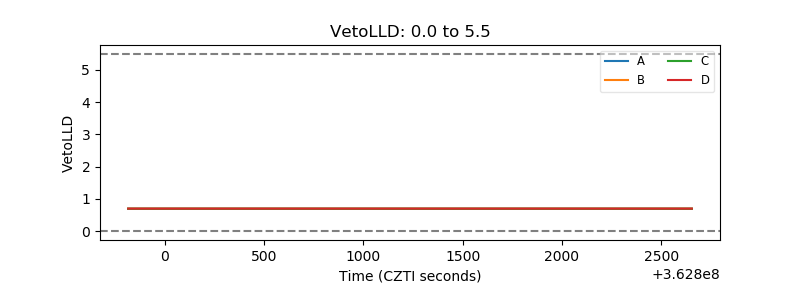 |
| Alpha Counter | 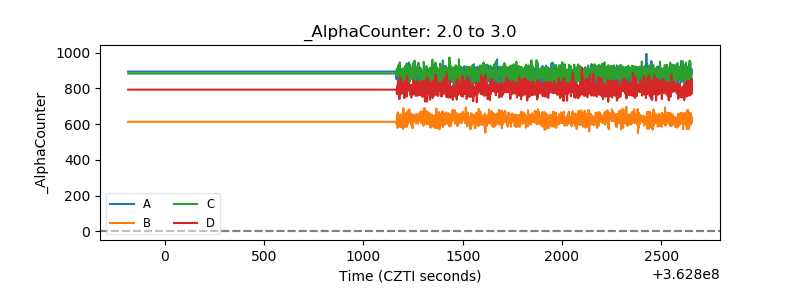 |
| _CPM_Rate | 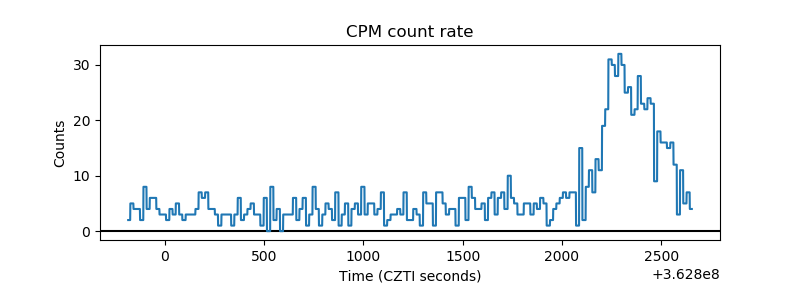 |
| CZT Counter | 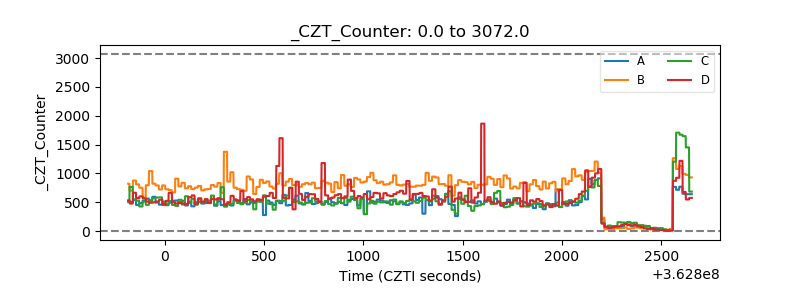 |
| +2.5 Volts monitor |  |
| +5 Volts monitor |  |
| _ROLL_ROT |  |
| _Roll_DEC | 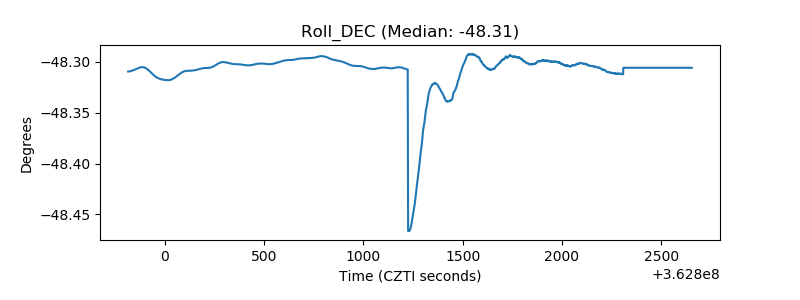 |
| _Roll_RA | 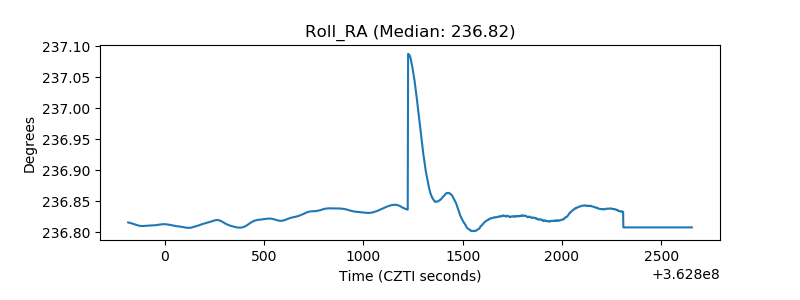 |
| Veto Counter | 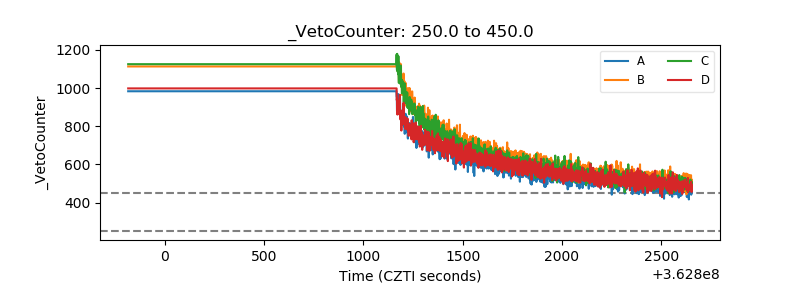 |