| Param | Original file | Final file |
|---|---|---|
| Filename | modeM0/AS1C06_002T01_9000004500cztM0_level2.fits | modeM0/AS1C06_002T01_9000004500cztM0_level2_quad_clean.evt |
| Size (bytes) | 493,810,560 | 405,933,120 |
| Size | 470.9 MB | 387.1 MB |
| Events in quadrant A | 3,150,442 | 2,407,973 |
| Events in quadrant B | 2,886,450 | 2,317,270 |
| Events in quadrant C | 3,014,548 | 2,268,393 |
| Events in quadrant D | 2,513,868 | 1,910,941 |
| Mode M0 | |||
|---|---|---|---|
| Quadrant | BADHDUFLAG | Total packets | Discarded packets |
| A | 0 | 104208 | 0 |
| B | 0 | 155581 | 0 |
| C | 0 | 110640 | 0 |
| D | 0 | 195859 | 0 |
| Mode SS | |||
|---|---|---|---|
| Quadrant | BADHDUFLAG | Total packets | Discarded packets |
| A | 0 | 1006 | 0 |
| B | 0 | 1006 | 0 |
| C | 0 | 1006 | 0 |
| D | 0 | 1006 | 0 |
| Mode M9 | |||
|---|---|---|---|
| Quadrant | BADHDUFLAG | Total packets | Discarded packets |
| A | 0 | 88 | 0 |
| B | 0 | 88 | 0 |
| C | 0 | 88 | 0 |
| D | 0 | 88 | 0 |
| Quadrant | Total seconds | Saturated seconds | Saturation percentage |
|---|---|---|---|
| A | 49353 | 508 | 1.029319% |
| B | 49353 | 1320 | 2.674609% |
| C | 49353 | 1530 | 3.100115% |
| D | 49353 | 6074 | 12.307256% |
Noise dominated data is calculated using 1-second bins in cleaned event files. If a bin has >2000 counts, and if more than 50% of those come from <1% of pixels, then it is considered to be noise-dominated and hence unusable.
| Quadrant | # 1 sec bins | Bins with >0 counts | Bins with >2000 counts | High rate bins dominated by noise | Noise dominated (total time) | Noise dominated (detector-on time) | Marked lightcurve |
|---|---|---|---|---|---|---|---|
| A | 58188 | 49353 | 0 | 0 | 0.00% | 0.00% |  |
| B | 58188 | 49353 | 0 | 0 | 0.00% | 0.00% |  |
| C | 58188 | 49324 | 0 | 0 | 0.00% | 0.00% |  |
| D | 58188 | 49339 | 0 | 0 | 0.00% | 0.00% |  |
Top three noisy pixels from each quadrant. If the there are fewer than three noisy pixels in the level2.evt file, extra rows are filled as -1
| Pixel properties | Quadrant properties | ||||||
|---|---|---|---|---|---|---|---|
| Quadrant | DetID | PixID | Counts | Sigma | Mean | Median | Sigma |
| A | 0 | 29 | 3028 | 11.29 | 821 | 779 | 199.2 |
| A | 7 | 110 | 2459 | 8.44 | 821 | 779 | 199.2 |
| A | 9 | 19 | 2416 | 8.22 | 821 | 779 | 199.2 |
| B | 2 | 9 | 2277 | 10.41 | 767 | 738 | 147.9 |
| B | 3 | 17 | 1943 | 8.15 | 767 | 738 | 147.9 |
| B | 5 | 128 | 1936 | 8.1 | 767 | 738 | 147.9 |
| C | 12 | 241 | 2134 | 6.84 | 800 | 756 | 201.5 |
| C | 3 | 187 | 2078 | 6.56 | 800 | 756 | 201.5 |
| C | 3 | 126 | 2063 | 6.49 | 800 | 756 | 201.5 |
| D | 15 | 46 | 1939 | 6.65 | 721 | 662 | 192.1 |
| D | 10 | 189 | 1875 | 6.31 | 721 | 662 | 192.1 |
| D | 6 | 231 | 1849 | 6.18 | 721 | 662 | 192.1 |
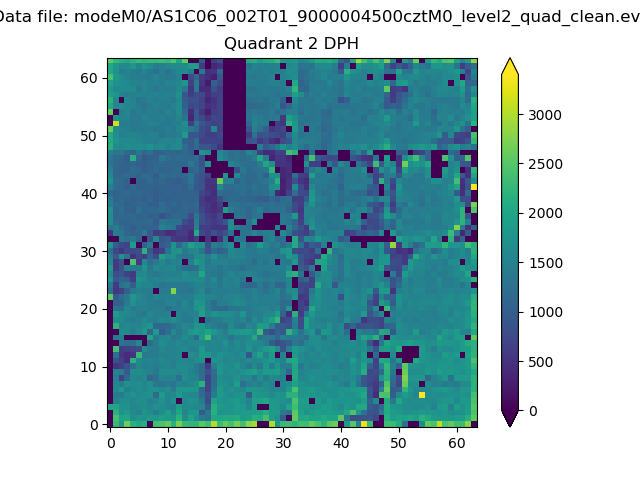
Histogram calculated using DETX and DETY for each event in the final _common_clean file
| Quadrant A |  |
 |
Quadrant B |
|---|---|---|---|
| Quadrant D | 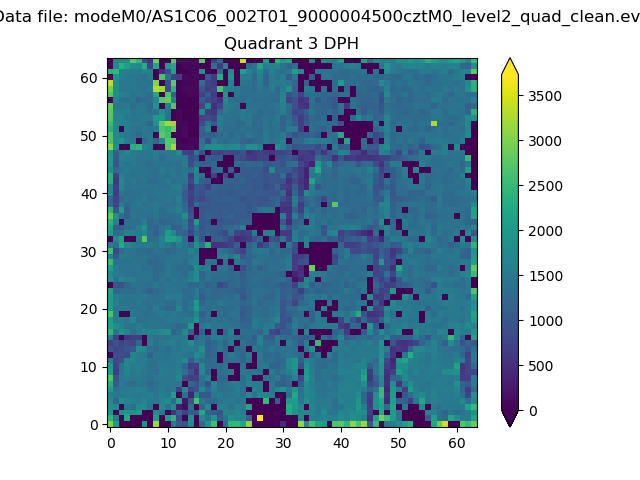 |
 |
Quadrant C |
| Plot type | Count rate plots | Images |
|---|---|---|
| Comparison with Poisson distribution Blue bars denote a histogram of data divided into 1 sec bins. Red curve is a Poisson curve with rate = median count rate of data. |
 |
 |
| Quadrant-wise count rates Data is divided into 100 sec bins |
 |
|
| Module-wise count rates for Quadrant A Data is divided into 100 sec bins |
 |
 |
| Module-wise count rates for Quadrant B Data is divided into 100 sec bins |
 |
 |
| Module-wise count rates for Quadrant C Data is divided into 100 sec bins |
 |
 |
| Module-wise count rates for Quadrant D Data is divided into 100 sec bins |
 |
 |
| Parameter | Plot |
|---|---|
| CZT HV Monitor |  |
| D_VDD | 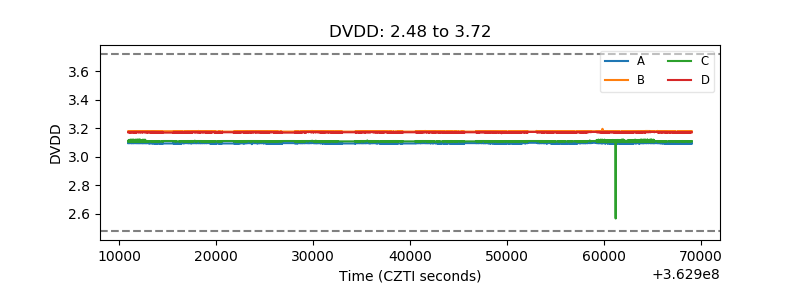 |
| Temperature 1 |  |
| Veto HV Monitor |  |
| Veto LLD |  |
| Alpha Counter |  |
| _CPM_Rate |  |
| CZT Counter |  |
| +2.5 Volts monitor |  |
| +5 Volts monitor |  |
| _ROLL_ROT |  |
| _Roll_DEC |  |
| _Roll_RA |  |
| Veto Counter |  |