| Param | Original file | Final file |
|---|---|---|
| Filename | modeM0/AS1C06_002T01_9000004500_31147cztM0_level2.evt | modeM0/AS1C06_002T01_9000004500_31147cztM0_level2_quad_clean.evt |
| Size (bytes) | 508,227,840 | 86,682,240 |
| Size | 484.7 MB | 82.7 MB |
| Events in quadrant A | 2,545,926 | 593,327 |
| Events in quadrant B | 4,182,057 | 580,658 |
| Events in quadrant C | 2,746,622 | 560,562 |
| Events in quadrant D | 5,567,168 | 528,142 |
| Mode M0 | |||
|---|---|---|---|
| Quadrant | BADHDUFLAG | Total packets | Discarded packets |
| A | 0 | 10927 | 1 |
| B | 0 | 16030 | 2 |
| C | 0 | 11258 | 1 |
| D | 0 | 20433 | 1 |
| Mode SS | |||
|---|---|---|---|
| Quadrant | BADHDUFLAG | Total packets | Discarded packets |
| A | 0 | 106 | 0 |
| B | 0 | 106 | 0 |
| C | 0 | 106 | 0 |
| D | 0 | 106 | 0 |
| Mode M9 | |||
|---|---|---|---|
| Quadrant | BADHDUFLAG | Total packets | Discarded packets |
| A | 0 | 10 | 0 |
| B | 0 | 10 | 0 |
| C | 0 | 10 | 0 |
| D | 0 | 10 | 0 |
| Quadrant | Total seconds | Saturated seconds | Saturation percentage |
|---|---|---|---|
| A | 5168 | 78 | 1.509288% |
| B | 5167 | 123 | 2.380492% |
| C | 5167 | 177 | 3.425585% |
| D | 5167 | 497 | 9.618734% |
Noise dominated data is calculated using 1-second bins in cleaned event files. If a bin has >2000 counts, and if more than 50% of those come from <1% of pixels, then it is considered to be noise-dominated and hence unusable.
| Quadrant | # 1 sec bins | Bins with >0 counts | Bins with >2000 counts | High rate bins dominated by noise | Noise dominated (total time) | Noise dominated (detector-on time) | Marked lightcurve |
|---|---|---|---|---|---|---|---|
| A | 6188 | 5169 | 0 | 0 | 0.00% | 0.00% | 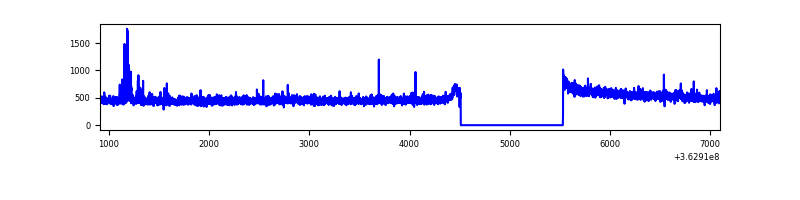 |
| B | 6187 | 5168 | 3 | 3 | 0.05% | 0.06% |  |
| C | 6187 | 5168 | 14 | 14 | 0.23% | 0.27% | 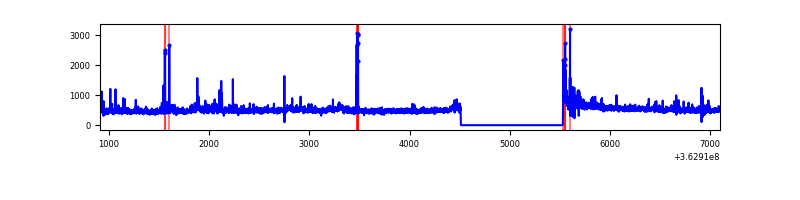 |
| D | 6187 | 5168 | 410 | 410 | 6.63% | 7.93% | 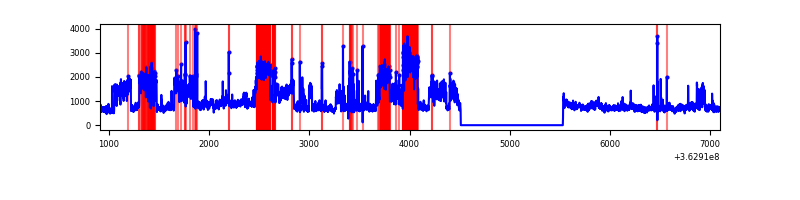 |
Top three noisy pixels from each quadrant. If the there are fewer than three noisy pixels in the level2.evt file, extra rows are filled as -1
| Pixel properties | Quadrant properties | ||||||
|---|---|---|---|---|---|---|---|
| Quadrant | DetID | PixID | Counts | Sigma | Mean | Median | Sigma |
| A | 12 | 96 | 40722 | 306.45 | 648 | 635 | 130.8 |
| A | 13 | 254 | 10499 | 75.41 | 648 | 635 | 130.8 |
| A | 3 | 137 | 6070 | 41.55 | 648 | 635 | 130.8 |
| B | 6 | 159 | 1436808 | 12096.57 | 631 | 615 | 118.7 |
| B | 0 | 183 | 102638 | 859.31 | 631 | 615 | 118.7 |
| B | 0 | 190 | 63878 | 532.84 | 631 | 615 | 118.7 |
| C | 14 | 238 | 115712 | 807.48 | 609 | 613 | 142.5 |
| C | 3 | 233 | 88240 | 614.75 | 609 | 613 | 142.5 |
| C | 0 | 10 | 69043 | 480.07 | 609 | 613 | 142.5 |
| D | 8 | 195 | 2551850 | 16280.45 | 604 | 593 | 156.7 |
| D | 13 | 174 | 499092 | 3181.09 | 604 | 593 | 156.7 |
| D | 13 | 249 | 105167 | 667.32 | 604 | 593 | 156.7 |
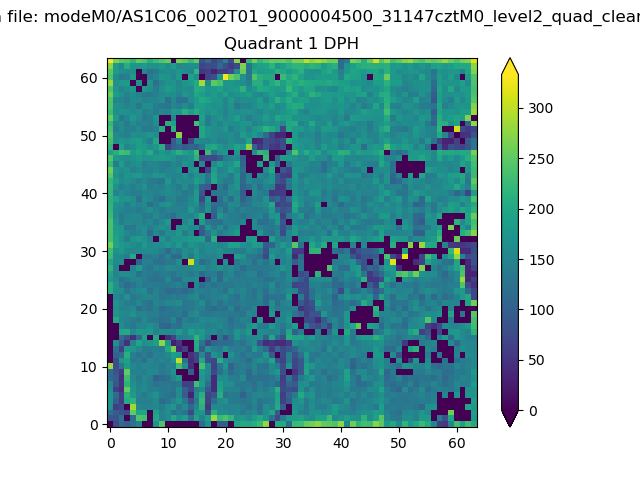
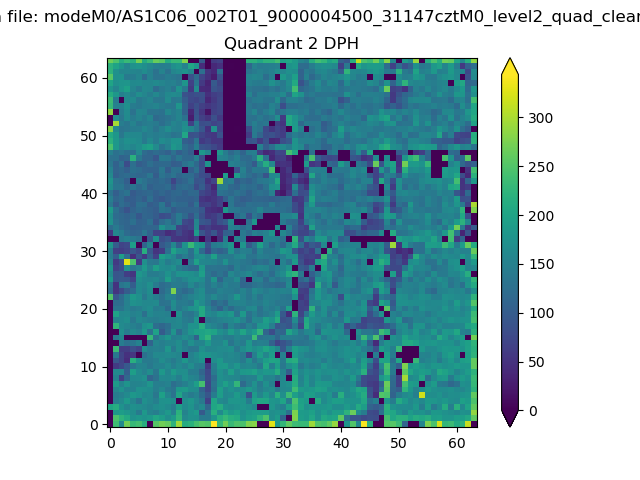
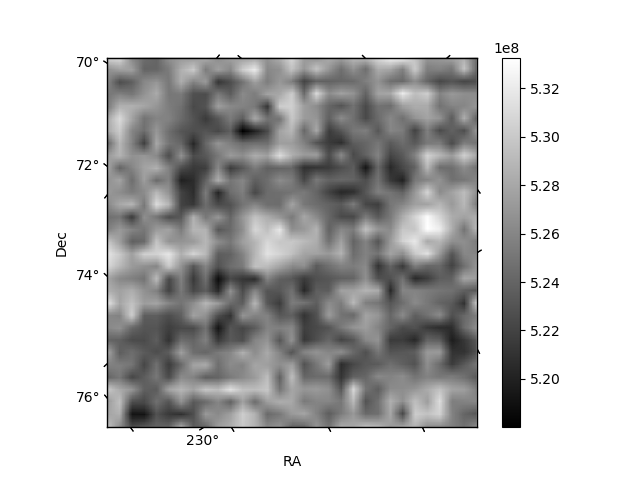
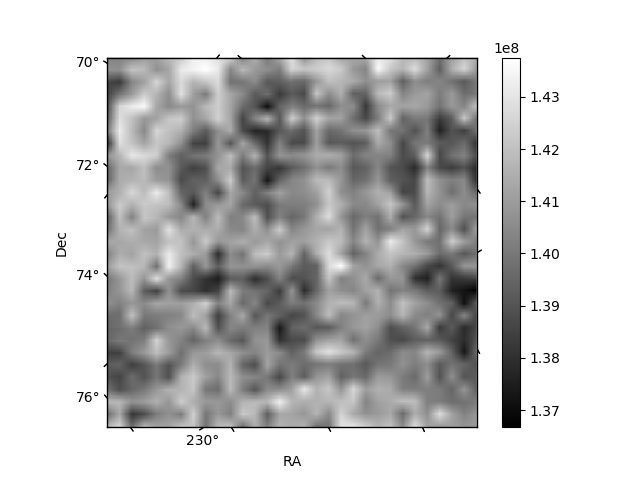
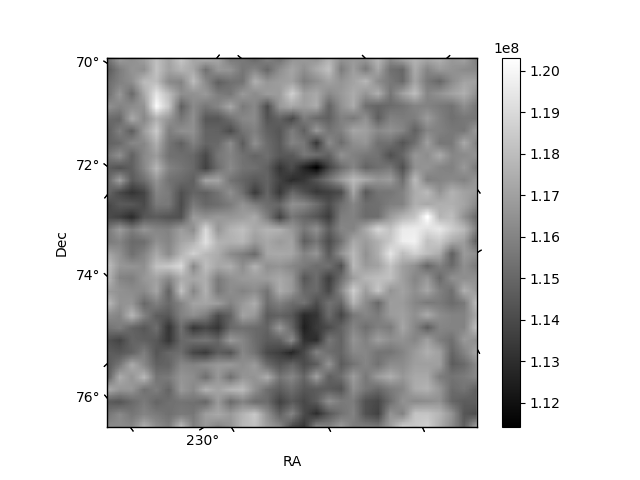
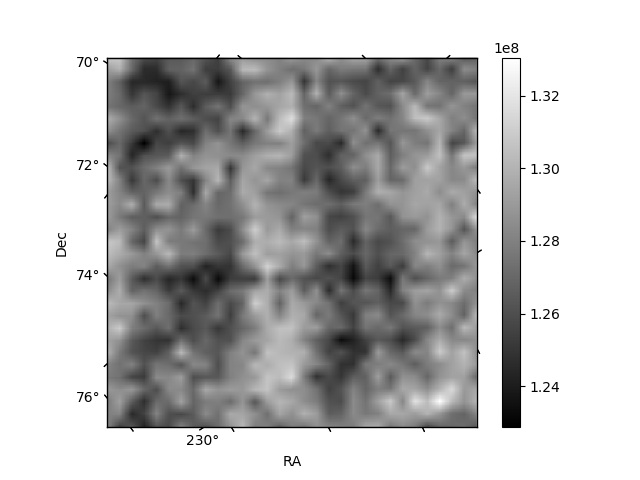
Histogram calculated using DETX and DETY for each event in the final _common_clean file
| Quadrant A | 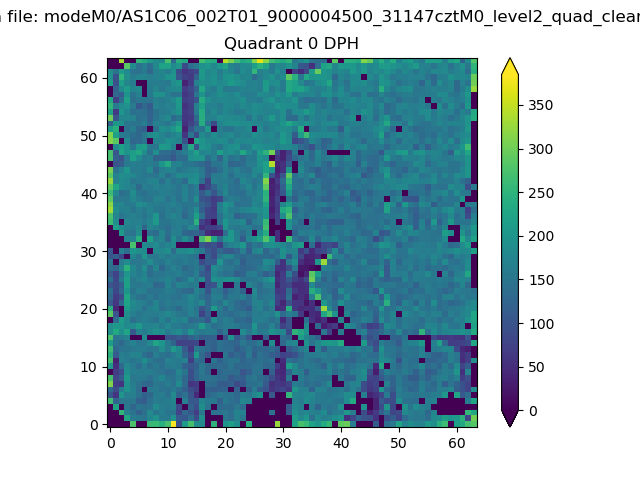 |
 |
Quadrant B |
|---|---|---|---|
| Quadrant D | 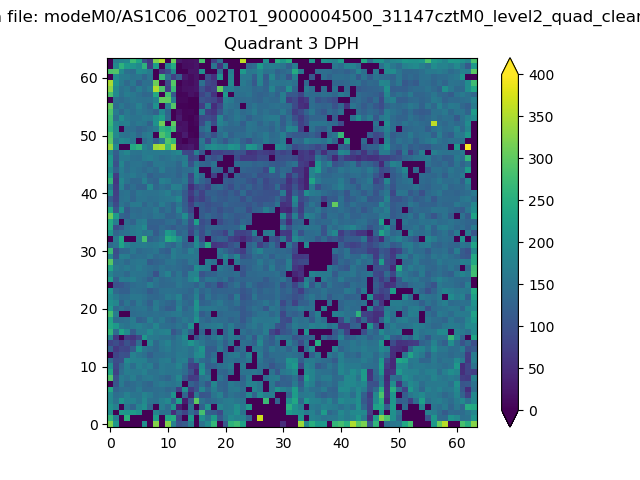 |
 |
Quadrant C |
| Plot type | Count rate plots | Images |
|---|---|---|
| Comparison with Poisson distribution Blue bars denote a histogram of data divided into 1 sec bins. Red curve is a Poisson curve with rate = median count rate of data. |
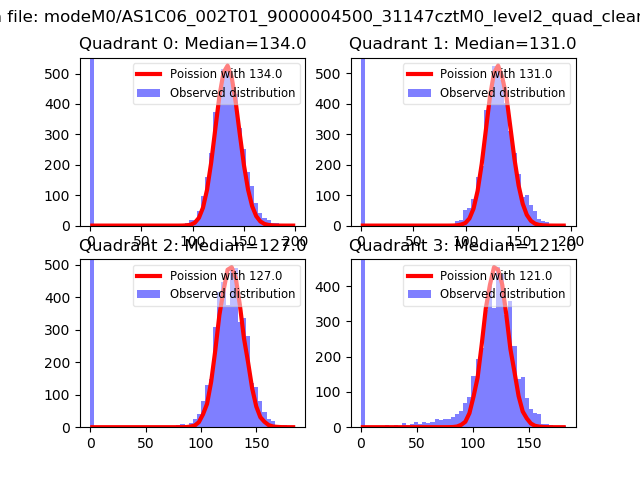 |
 |
| Quadrant-wise count rates Data is divided into 100 sec bins |
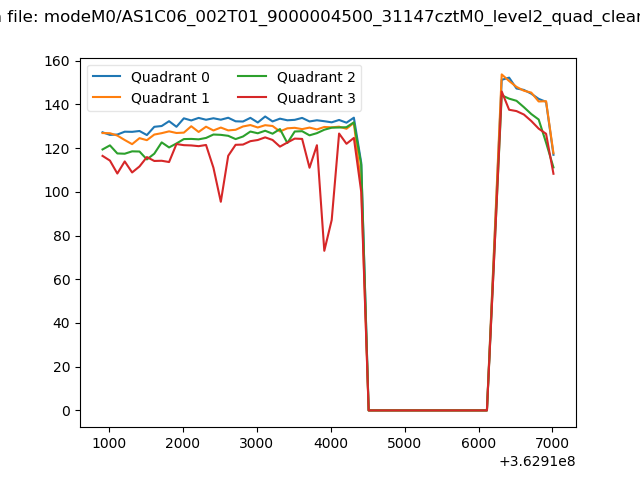 |
|
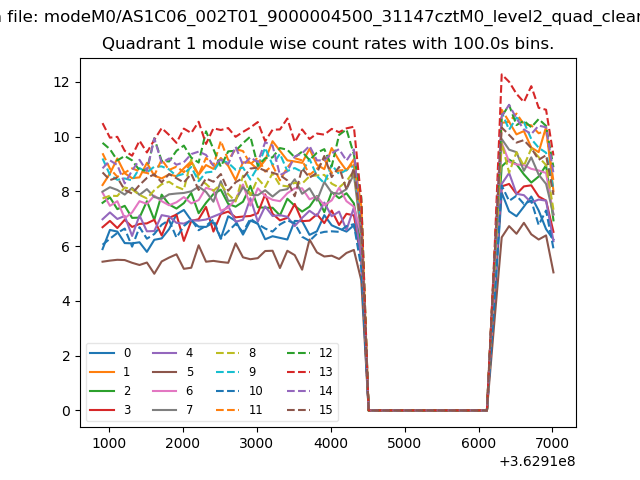
| Module-wise count rates for Quadrant A Data is divided into 100 sec bins |
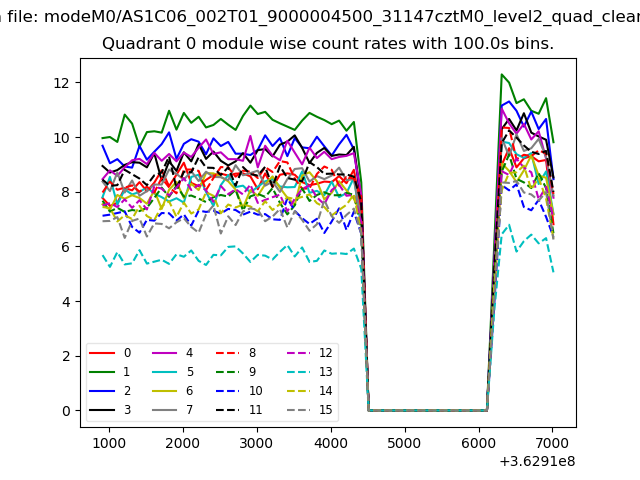 |
 |
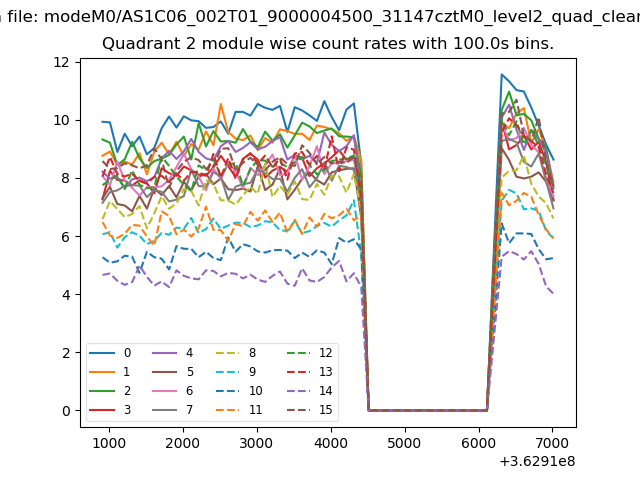
| Module-wise count rates for Quadrant B Data is divided into 100 sec bins |
 |
 |
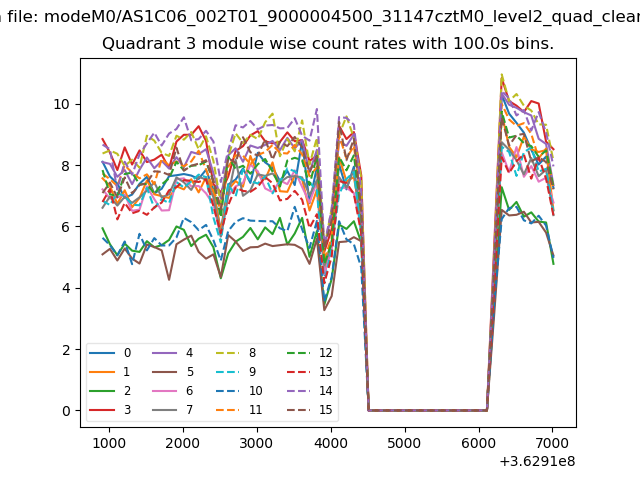
| Module-wise count rates for Quadrant C Data is divided into 100 sec bins |
 |
 |
| Module-wise count rates for Quadrant D Data is divided into 100 sec bins |
 |
 |
| Parameter | Plot |
|---|---|
| CZT HV Monitor | 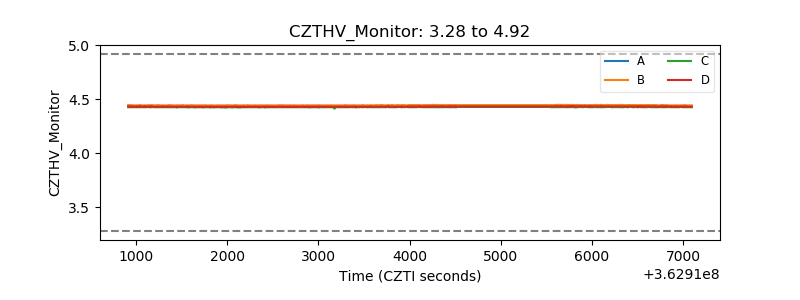 |
| D_VDD |  |
| Temperature 1 | 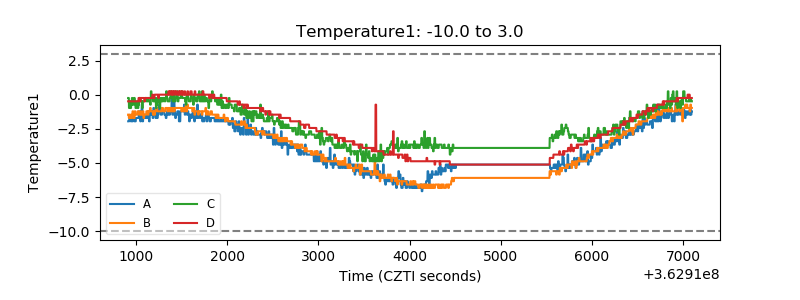 |
| Veto HV Monitor | 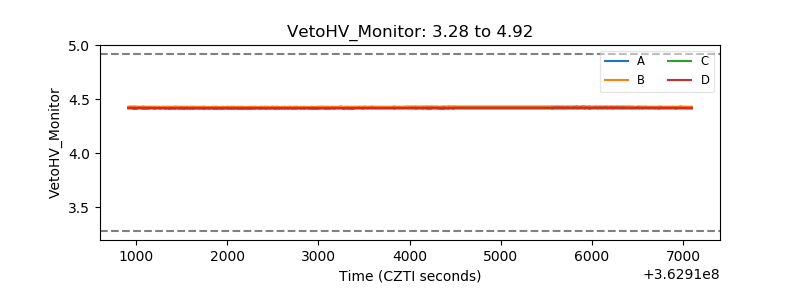 |
| Veto LLD | 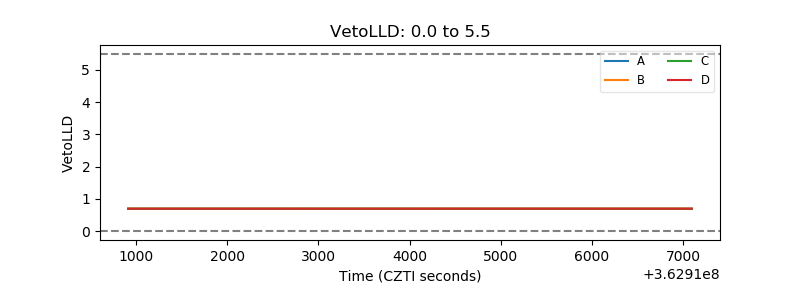 |
| Alpha Counter | 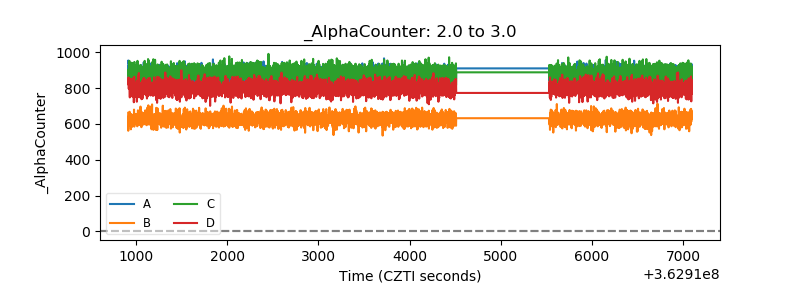 |
| _CPM_Rate | 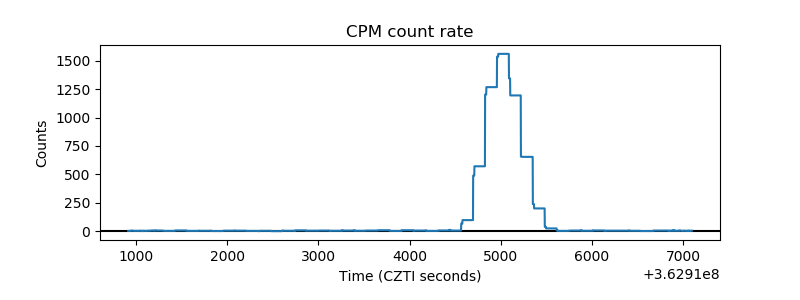 |
| CZT Counter | 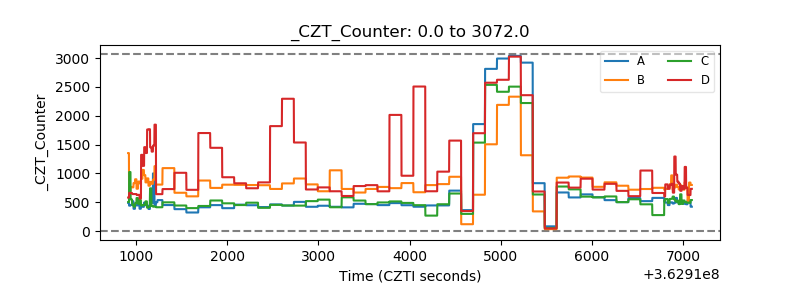 |
| +2.5 Volts monitor |  |
| +5 Volts monitor |  |
| _ROLL_ROT | 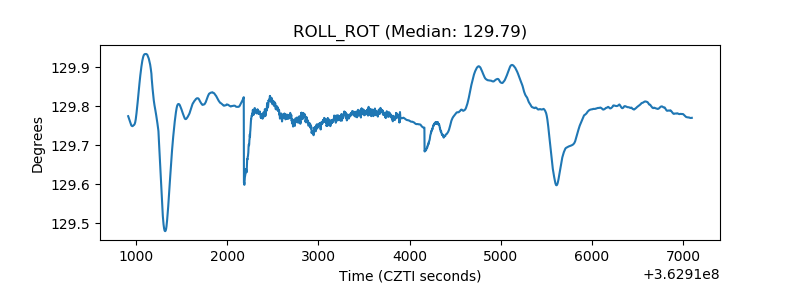 |
| _Roll_DEC | 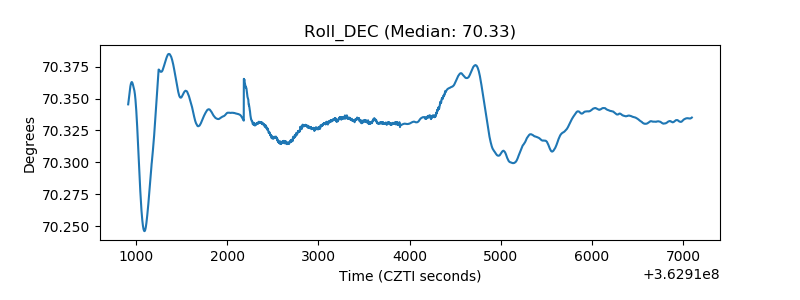 |
| _Roll_RA | 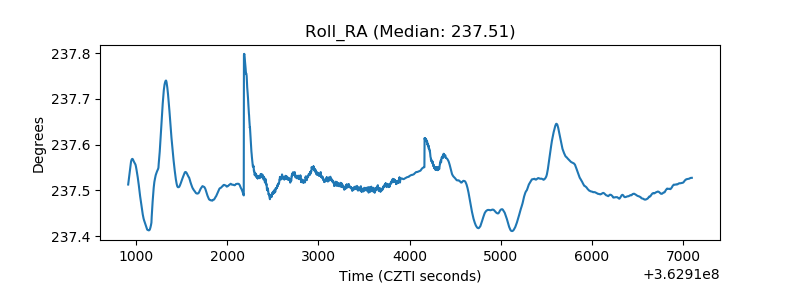 |
| Veto Counter | 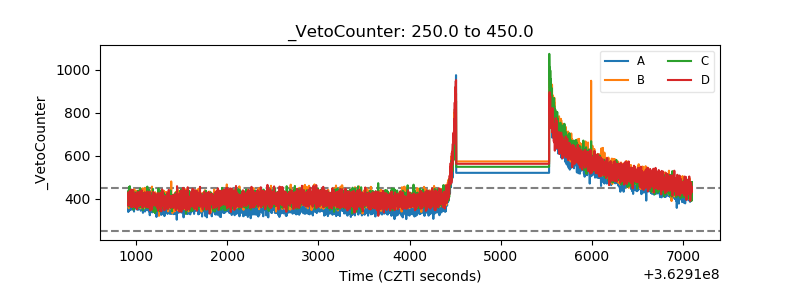 |