| Param | Original file | Final file |
|---|---|---|
| Filename | modeM0/AS1C06_002T01_9000004500_31149cztM0_level2.evt | modeM0/AS1C06_002T01_9000004500_31149cztM0_level2_quad_clean.evt |
| Size (bytes) | 640,549,440 | 136,048,320 |
| Size | 610.9 MB | 129.7 MB |
| Events in quadrant A | 3,300,846 | 961,236 |
| Events in quadrant B | 5,384,330 | 934,626 |
| Events in quadrant C | 3,526,766 | 913,743 |
| Events in quadrant D | 6,763,650 | 873,168 |
| Mode M0 | |||
|---|---|---|---|
| Quadrant | BADHDUFLAG | Total packets | Discarded packets |
| A | 0 | 13886 | 1 |
| B | 0 | 20184 | 1 |
| C | 0 | 14510 | 1 |
| D | 0 | 24565 | 1 |
| Mode SS | |||
|---|---|---|---|
| Quadrant | BADHDUFLAG | Total packets | Discarded packets |
| A | 0 | 126 | 0 |
| B | 0 | 126 | 0 |
| C | 0 | 126 | 0 |
| D | 0 | 126 | 0 |
| Mode M9 | |||
|---|---|---|---|
| Quadrant | BADHDUFLAG | Total packets | Discarded packets |
| A | 0 | 13 | 0 |
| B | 0 | 13 | 0 |
| C | 0 | 13 | 0 |
| D | 0 | 13 | 0 |
| Quadrant | Total seconds | Saturated seconds | Saturation percentage |
|---|---|---|---|
| A | 6279 | 88 | 1.401497% |
| B | 6280 | 232 | 3.694268% |
| C | 6280 | 158 | 2.515924% |
| D | 6280 | 503 | 8.009554% |
Noise dominated data is calculated using 1-second bins in cleaned event files. If a bin has >2000 counts, and if more than 50% of those come from <1% of pixels, then it is considered to be noise-dominated and hence unusable.
| Quadrant | # 1 sec bins | Bins with >0 counts | Bins with >2000 counts | High rate bins dominated by noise | Noise dominated (total time) | Noise dominated (detector-on time) | Marked lightcurve |
|---|---|---|---|---|---|---|---|
| A | 7524 | 6280 | 0 | 0 | 0.00% | 0.00% | 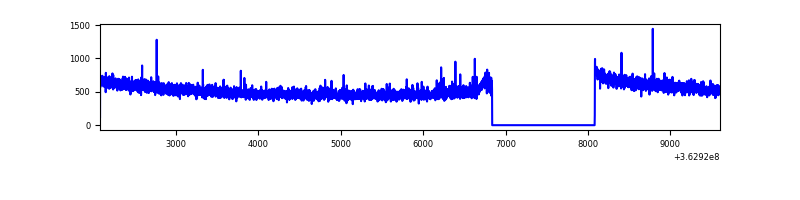 |
| B | 7525 | 6281 | 36 | 36 | 0.48% | 0.57% | 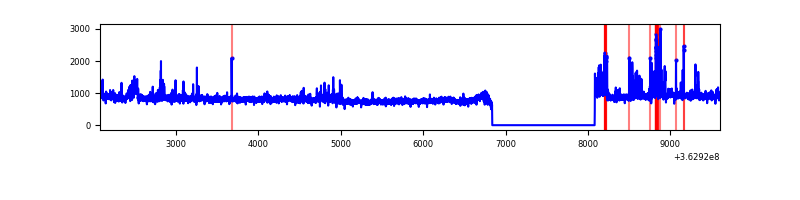 |
| C | 7525 | 6281 | 2 | 2 | 0.03% | 0.03% |  |
| D | 7525 | 6281 | 344 | 344 | 4.57% | 5.48% | 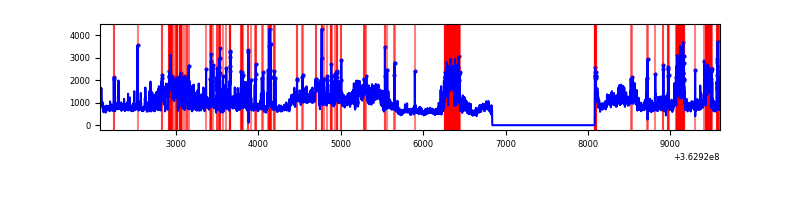 |
Top three noisy pixels from each quadrant. If the there are fewer than three noisy pixels in the level2.evt file, extra rows are filled as -1
| Pixel properties | Quadrant properties | ||||||
|---|---|---|---|---|---|---|---|
| Quadrant | DetID | PixID | Counts | Sigma | Mean | Median | Sigma |
| A | 12 | 96 | 17294 | 97.48 | 850 | 836 | 168.8 |
| A | 13 | 254 | 13141 | 72.88 | 850 | 836 | 168.8 |
| A | 3 | 137 | 7437 | 39.1 | 850 | 836 | 168.8 |
| B | 6 | 159 | 1781125 | 11691.92 | 822 | 804 | 152.3 |
| B | 0 | 190 | 123604 | 806.47 | 822 | 804 | 152.3 |
| B | 4 | 80 | 85763 | 557.95 | 822 | 804 | 152.3 |
| C | 14 | 238 | 137446 | 740.12 | 806 | 812 | 184.6 |
| C | 1 | 16 | 117474 | 631.94 | 806 | 812 | 184.6 |
| C | 0 | 10 | 64443 | 344.68 | 806 | 812 | 184.6 |
| D | 8 | 195 | 2039966 | 9716.95 | 802 | 789 | 209.9 |
| D | 13 | 174 | 910209 | 4333.51 | 802 | 789 | 209.9 |
| D | 2 | 250 | 372180 | 1769.73 | 802 | 789 | 209.9 |
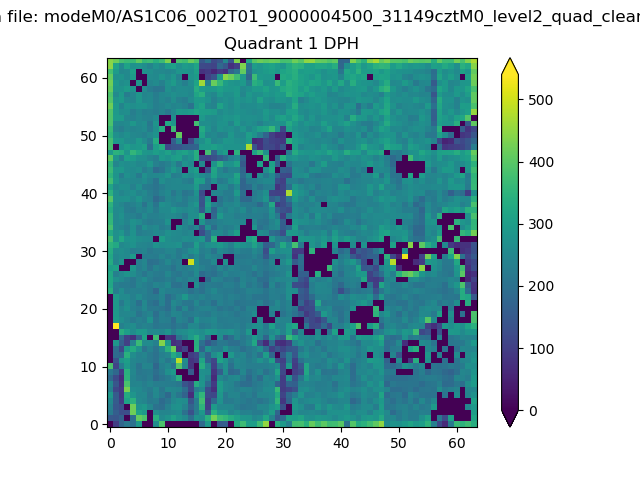
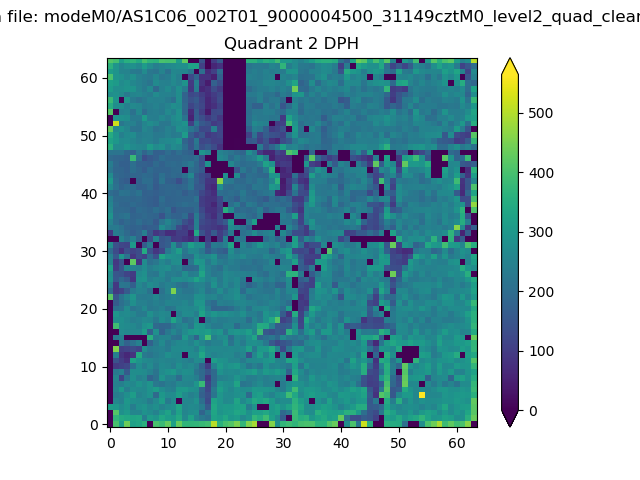
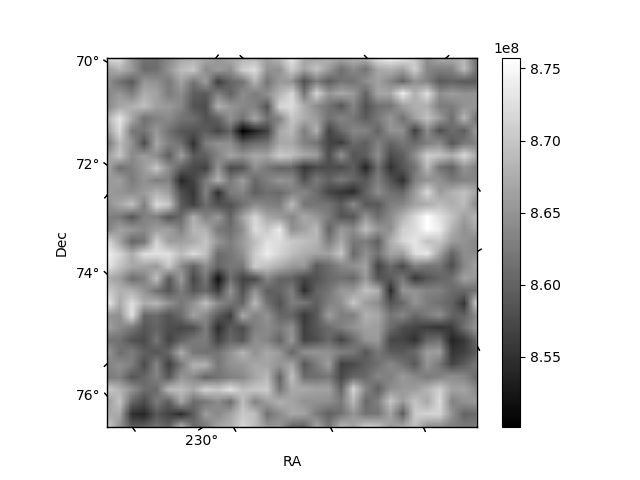
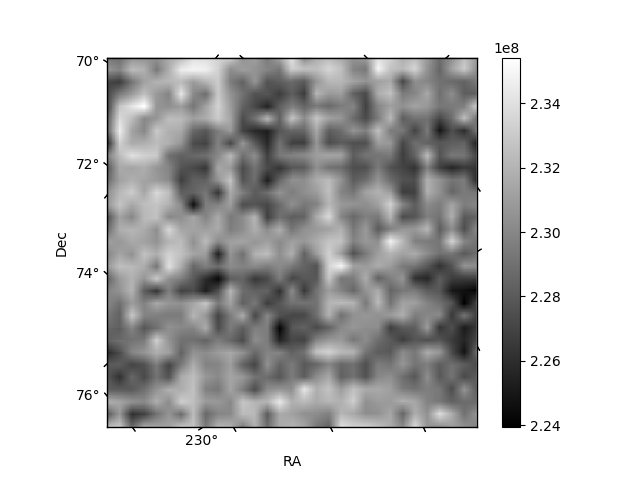
Histogram calculated using DETX and DETY for each event in the final _common_clean file
| Quadrant A | 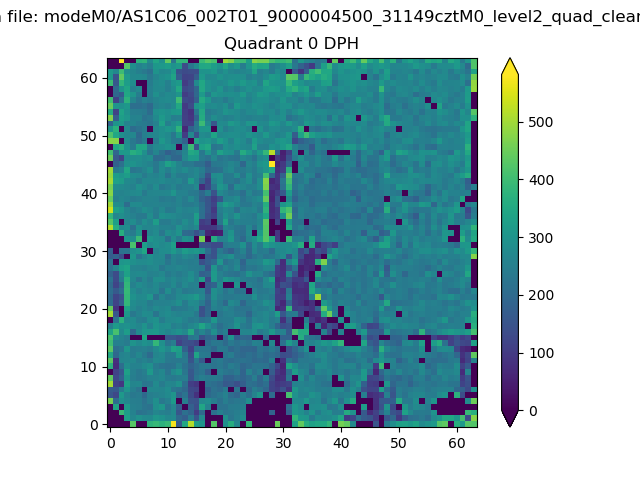 |
 |
Quadrant B |
|---|---|---|---|
| Quadrant D | 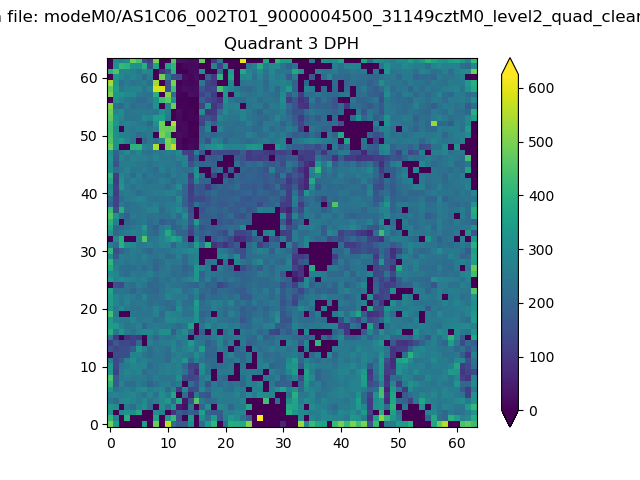 |
 |
Quadrant C |
| Plot type | Count rate plots | Images |
|---|---|---|
| Comparison with Poisson distribution Blue bars denote a histogram of data divided into 1 sec bins. Red curve is a Poisson curve with rate = median count rate of data. |
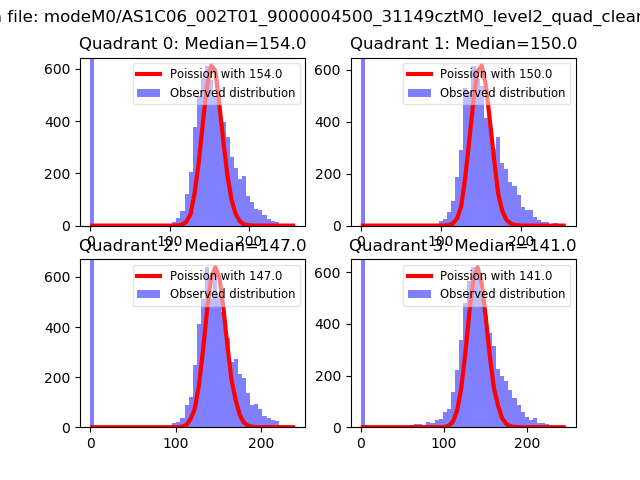 |
 |
| Quadrant-wise count rates Data is divided into 100 sec bins |
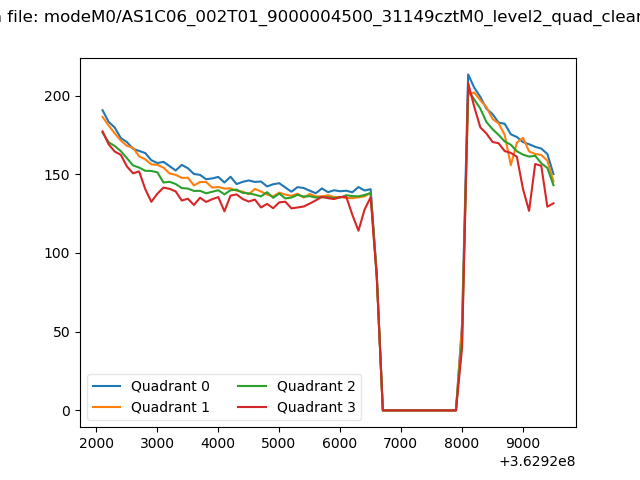 |
|
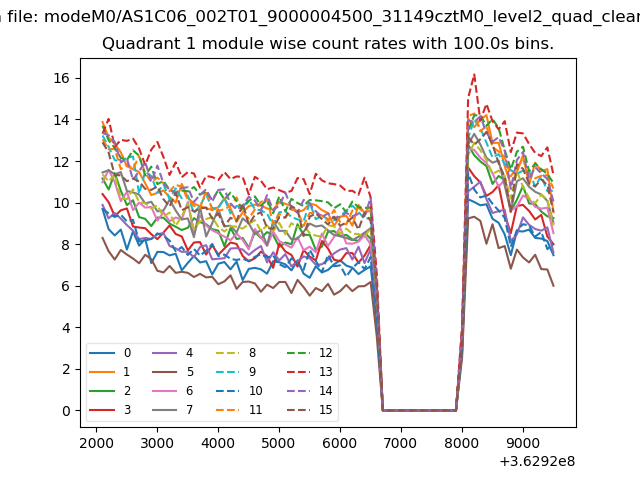
| Module-wise count rates for Quadrant A Data is divided into 100 sec bins |
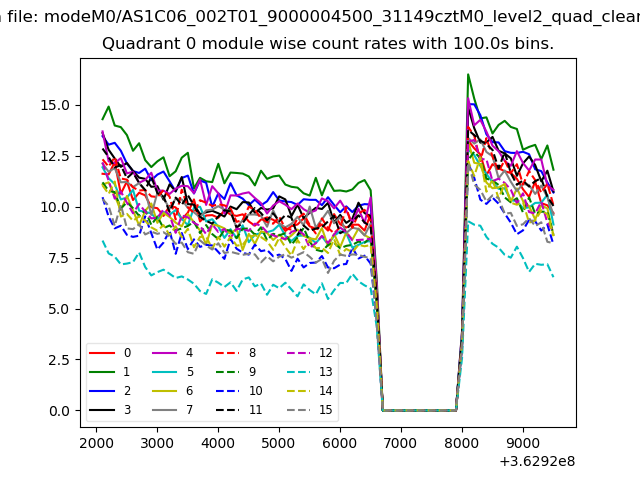 |
 |
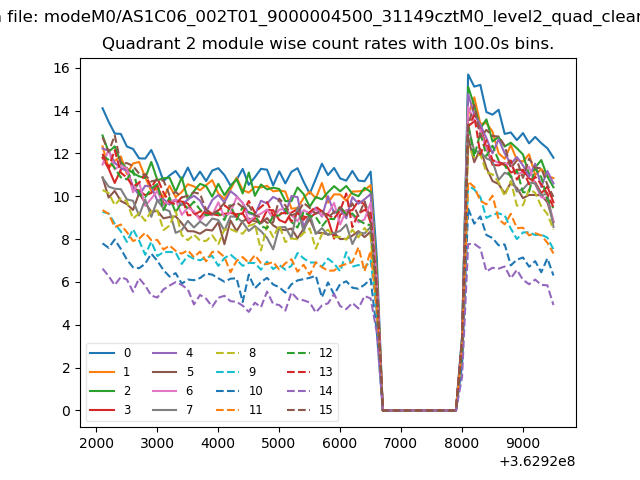
| Module-wise count rates for Quadrant B Data is divided into 100 sec bins |
 |
 |
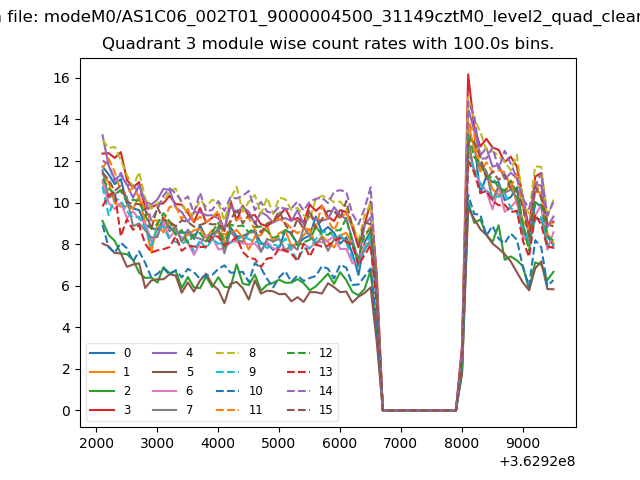
| Module-wise count rates for Quadrant C Data is divided into 100 sec bins |
 |
 |
| Module-wise count rates for Quadrant D Data is divided into 100 sec bins |
 |
 |
| Parameter | Plot |
|---|---|
| CZT HV Monitor | 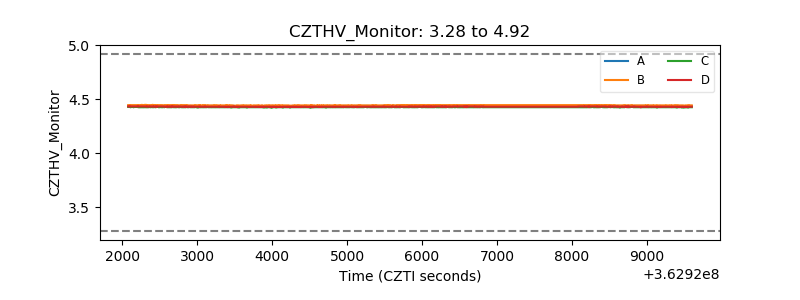 |
| D_VDD | 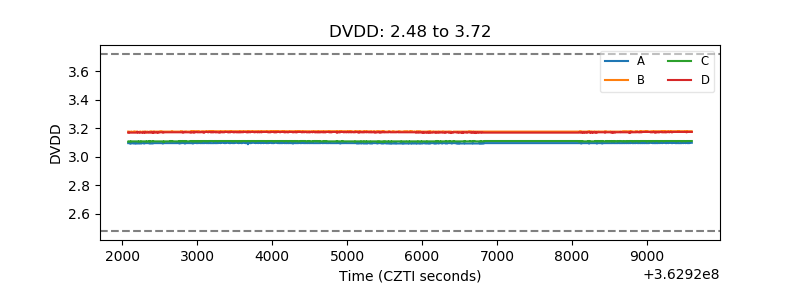 |
| Temperature 1 | 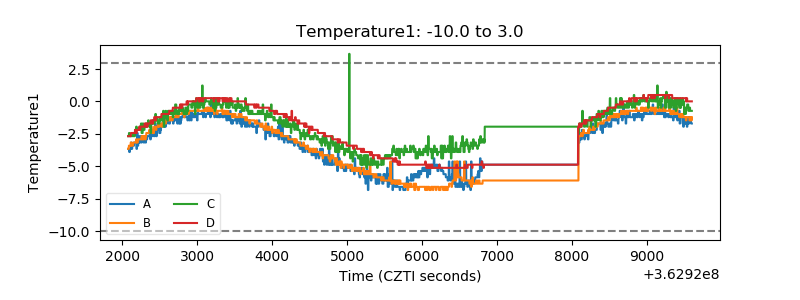 |
| Veto HV Monitor | 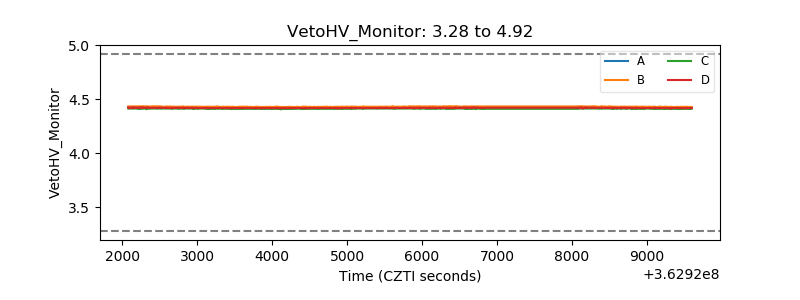 |
| Veto LLD | 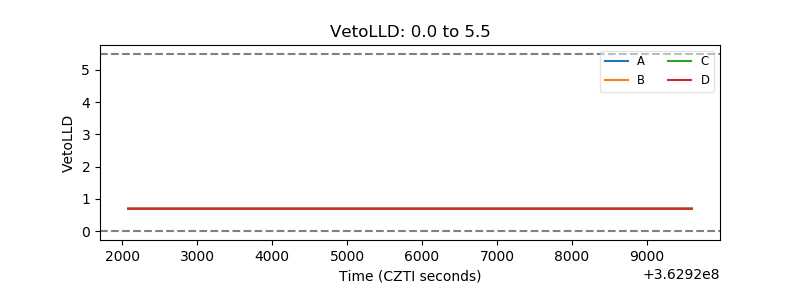 |
| Alpha Counter | 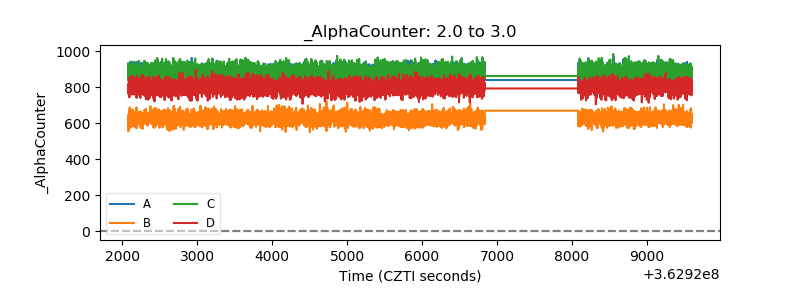 |
| _CPM_Rate | 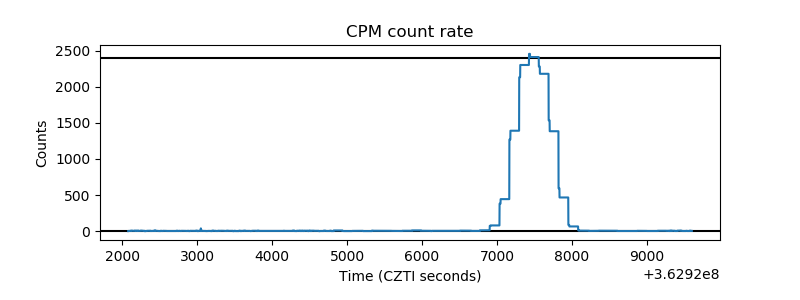 |
| CZT Counter | 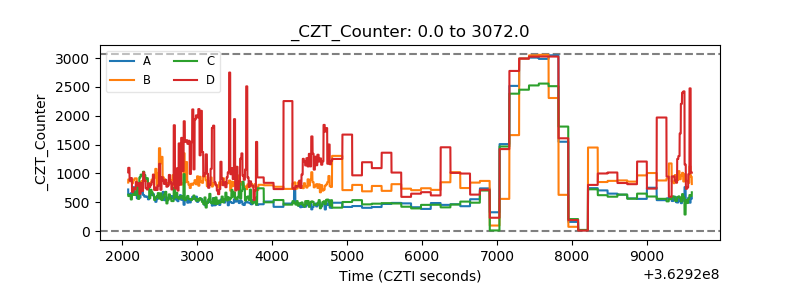 |
| +2.5 Volts monitor |  |
| +5 Volts monitor |  |
| _ROLL_ROT | 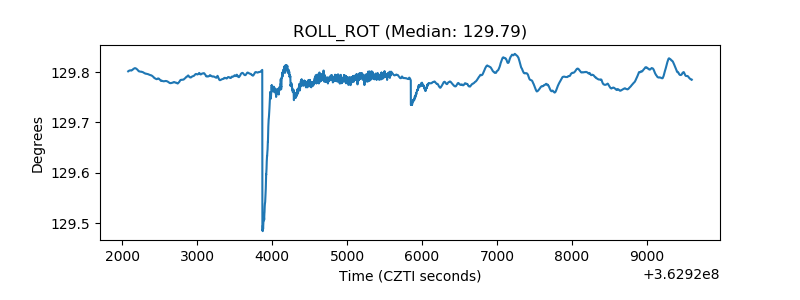 |
| _Roll_DEC | 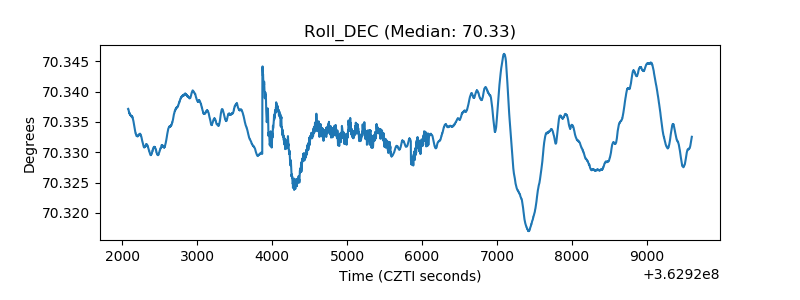 |
| _Roll_RA | 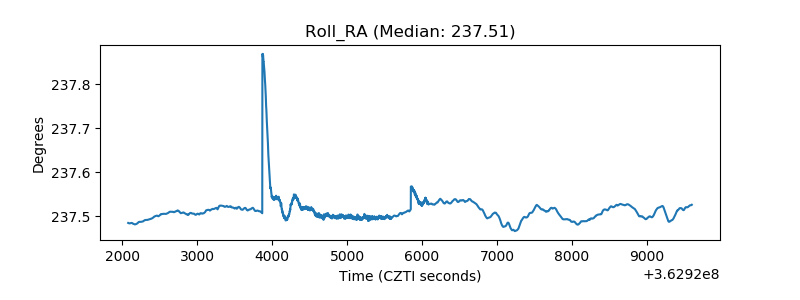 |
| Veto Counter | 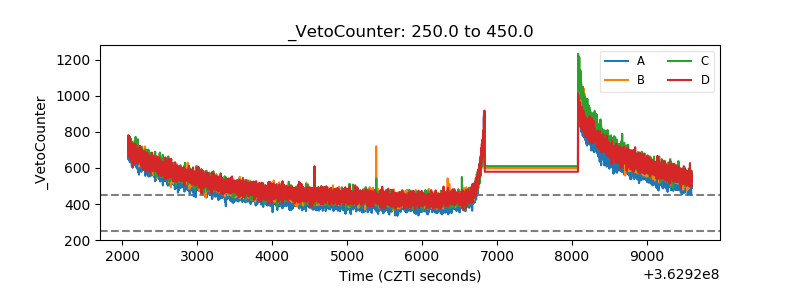 |