| Param | Original file | Final file |
|---|---|---|
| Filename | modeM0/AS1C06_002T01_9000004500_31150cztM0_level2.evt | modeM0/AS1C06_002T01_9000004500_31150cztM0_level2_quad_clean.evt |
| Size (bytes) | 633,594,240 | 129,574,080 |
| Size | 604.2 MB | 123.6 MB |
| Events in quadrant A | 3,252,860 | 913,041 |
| Events in quadrant B | 5,441,202 | 886,619 |
| Events in quadrant C | 3,529,217 | 875,423 |
| Events in quadrant D | 6,550,835 | 820,816 |
| Mode M0 | |||
|---|---|---|---|
| Quadrant | BADHDUFLAG | Total packets | Discarded packets |
| A | 0 | 13631 | 1 |
| B | 0 | 20283 | 1 |
| C | 0 | 14638 | 1 |
| D | 0 | 23892 | 3 |
| Mode SS | |||
|---|---|---|---|
| Quadrant | BADHDUFLAG | Total packets | Discarded packets |
| A | 0 | 124 | 0 |
| B | 0 | 124 | 0 |
| C | 0 | 124 | 0 |
| D | 0 | 124 | 0 |
| Mode M9 | |||
|---|---|---|---|
| Quadrant | BADHDUFLAG | Total packets | Discarded packets |
| A | 0 | 13 | 0 |
| B | 0 | 13 | 0 |
| C | 0 | 13 | 0 |
| D | 0 | 13 | 0 |
| Quadrant | Total seconds | Saturated seconds | Saturation percentage |
|---|---|---|---|
| A | 6140 | 99 | 1.612378% |
| B | 6141 | 246 | 4.005862% |
| C | 6141 | 212 | 3.452206% |
| D | 6140 | 572 | 9.315961% |
Noise dominated data is calculated using 1-second bins in cleaned event files. If a bin has >2000 counts, and if more than 50% of those come from <1% of pixels, then it is considered to be noise-dominated and hence unusable.
| Quadrant | # 1 sec bins | Bins with >0 counts | Bins with >2000 counts | High rate bins dominated by noise | Noise dominated (total time) | Noise dominated (detector-on time) | Marked lightcurve |
|---|---|---|---|---|---|---|---|
| A | 7425 | 6141 | 0 | 0 | 0.00% | 0.00% |  |
| B | 7426 | 6142 | 45 | 45 | 0.61% | 0.73% |  |
| C | 7426 | 6142 | 7 | 7 | 0.09% | 0.11% |  |
| D | 7425 | 6141 | 376 | 376 | 5.06% | 6.12% |  |
Top three noisy pixels from each quadrant. If the there are fewer than three noisy pixels in the level2.evt file, extra rows are filled as -1
| Pixel properties | Quadrant properties | ||||||
|---|---|---|---|---|---|---|---|
| Quadrant | DetID | PixID | Counts | Sigma | Mean | Median | Sigma |
| A | 13 | 254 | 12624 | 71.38 | 838 | 822 | 165.3 |
| A | 12 | 96 | 9911 | 54.97 | 838 | 822 | 165.3 |
| A | 0 | 226 | 7334 | 39.39 | 838 | 822 | 165.3 |
| B | 6 | 159 | 1849829 | 12495.45 | 813 | 795 | 148.0 |
| B | 0 | 190 | 120354 | 807.96 | 813 | 795 | 148.0 |
| B | 12 | 18 | 104858 | 703.24 | 813 | 795 | 148.0 |
| C | 14 | 238 | 150950 | 812.64 | 803 | 812 | 184.8 |
| C | 3 | 233 | 83833 | 449.36 | 803 | 812 | 184.8 |
| C | 0 | 10 | 58147 | 310.33 | 803 | 812 | 184.8 |
| D | 8 | 195 | 2014937 | 10738.13 | 799 | 780 | 187.6 |
| D | 13 | 174 | 522597 | 2781.98 | 799 | 780 | 187.6 |
| D | 2 | 250 | 391702 | 2084.13 | 799 | 780 | 187.6 |
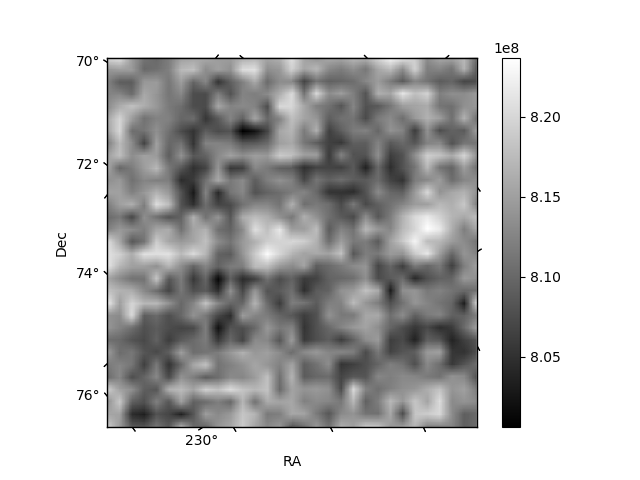
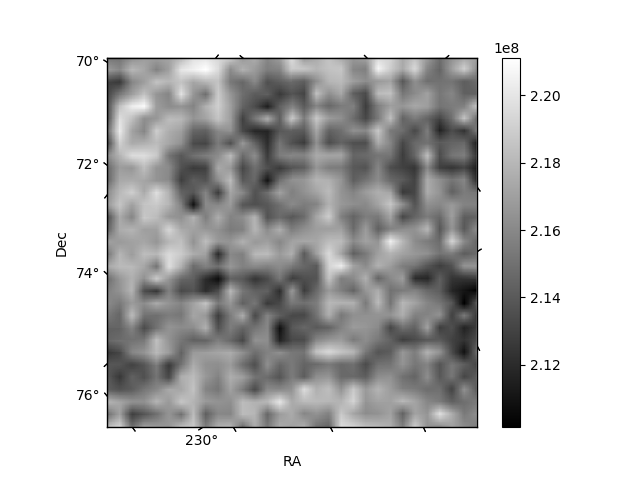
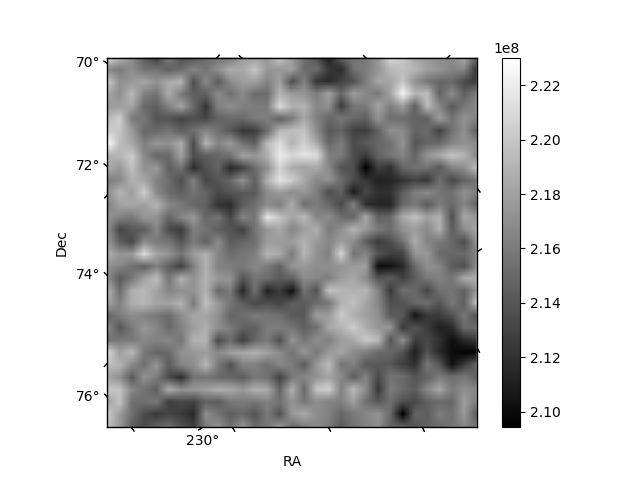
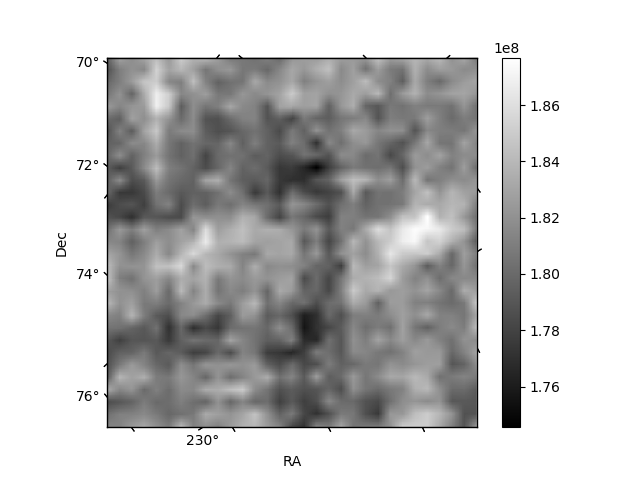
Histogram calculated using DETX and DETY for each event in the final _common_clean file
| Quadrant A | 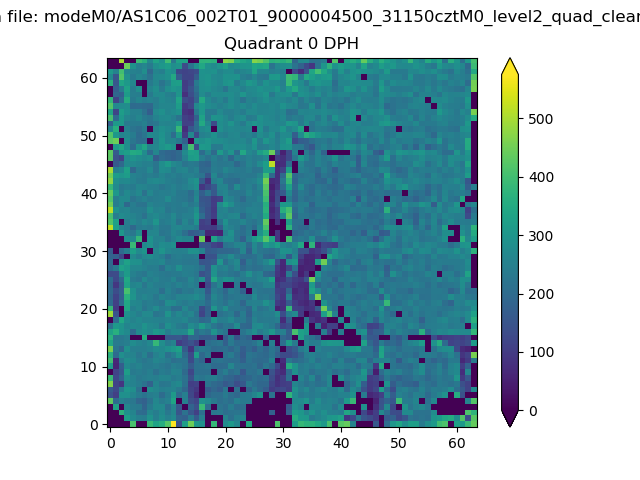 |
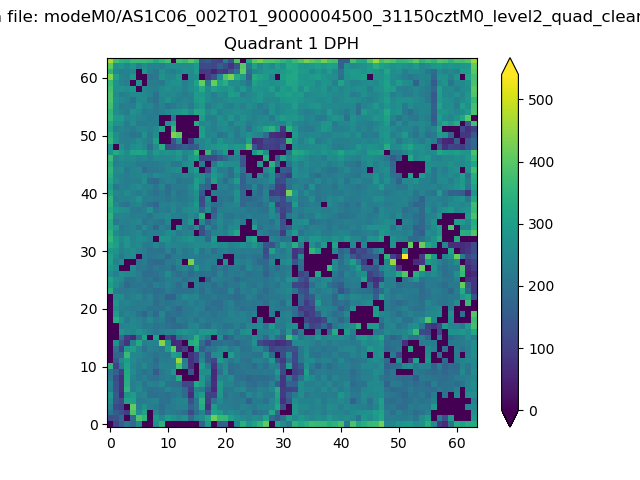 |
Quadrant B |
|---|---|---|---|
| Quadrant D | 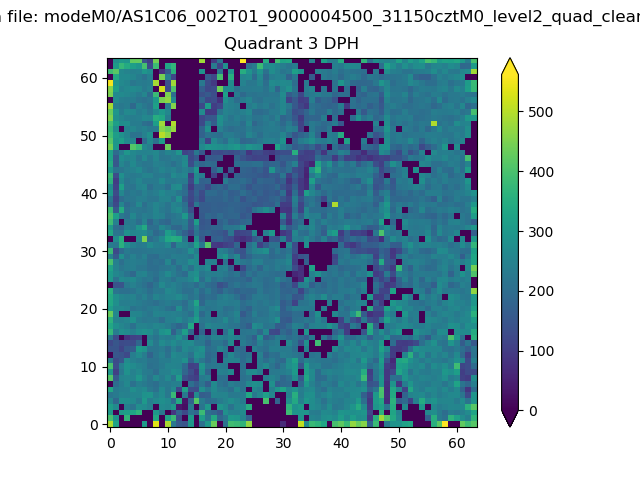 |
 |
Quadrant C |
| Plot type | Count rate plots | Images |
|---|---|---|
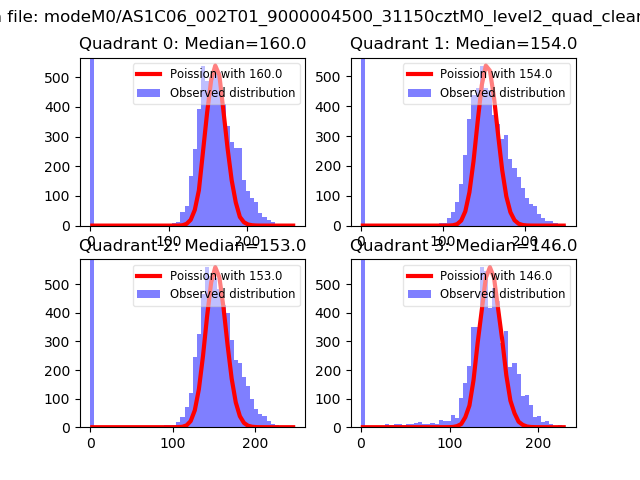
| Comparison with Poisson distribution Blue bars denote a histogram of data divided into 1 sec bins. Red curve is a Poisson curve with rate = median count rate of data. |
 |
 |
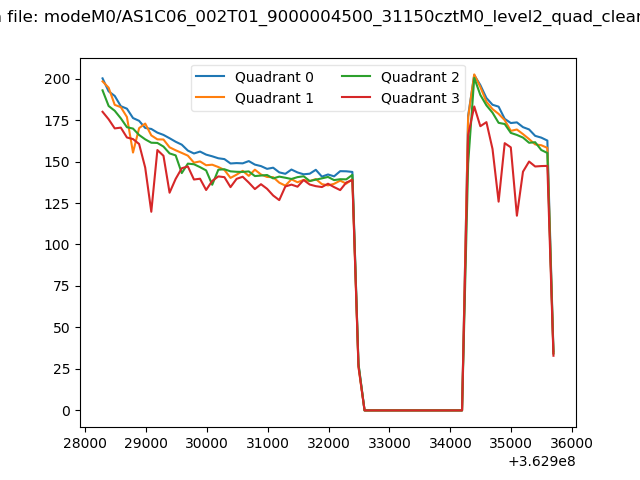
| Quadrant-wise count rates Data is divided into 100 sec bins |
 |
|
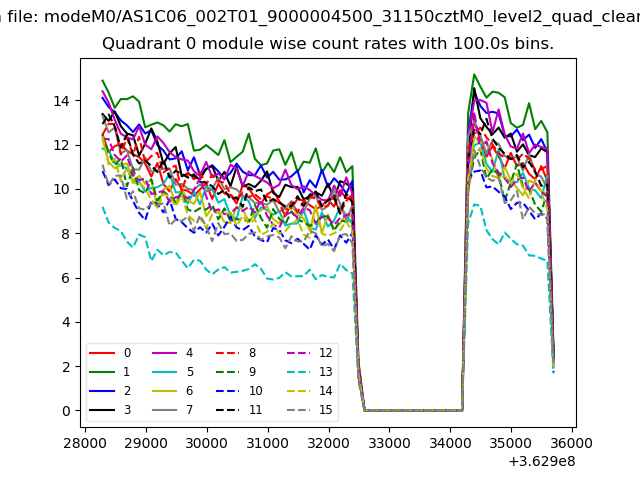
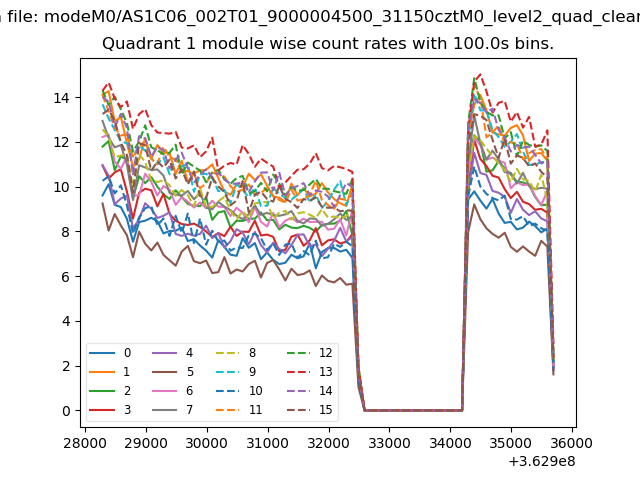
| Module-wise count rates for Quadrant A Data is divided into 100 sec bins |
 |
 |
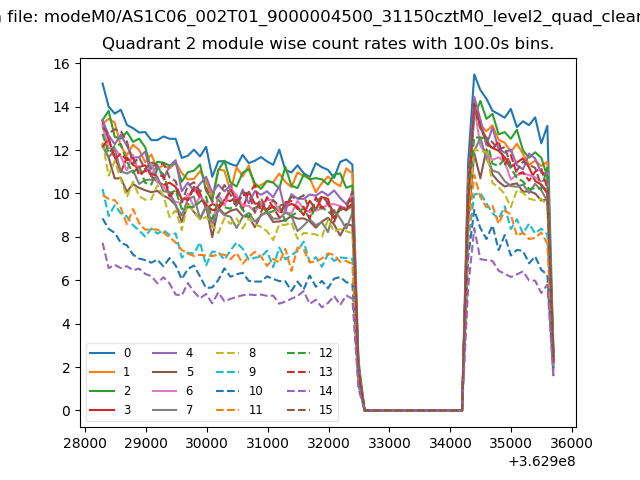
| Module-wise count rates for Quadrant B Data is divided into 100 sec bins |
 |
 |
| Module-wise count rates for Quadrant C Data is divided into 100 sec bins |
 |
 |
| Module-wise count rates for Quadrant D Data is divided into 100 sec bins |
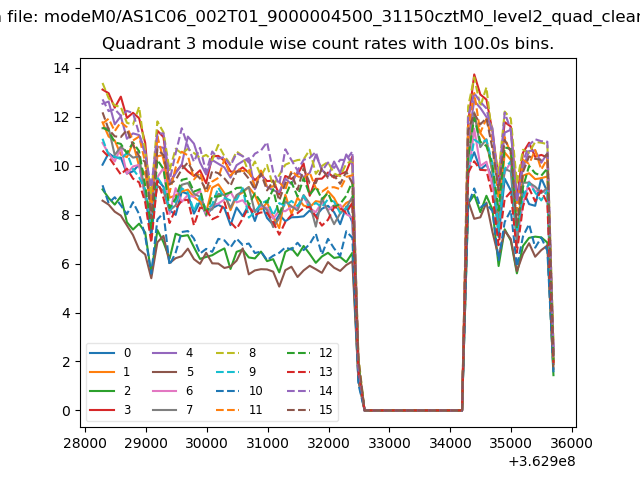 |
 |
| Parameter | Plot |
|---|---|
| CZT HV Monitor | 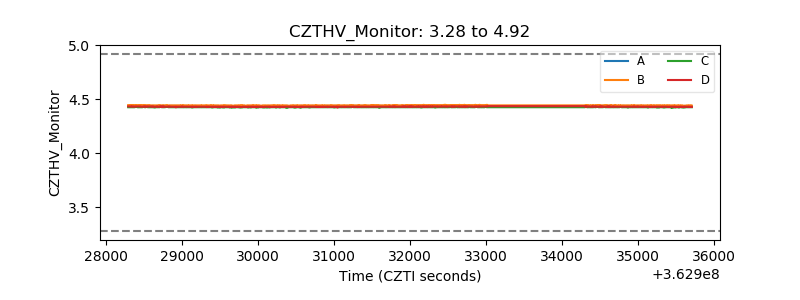 |
| D_VDD | 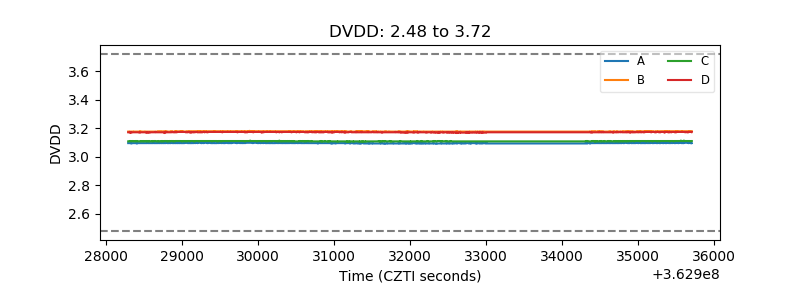 |
| Temperature 1 | 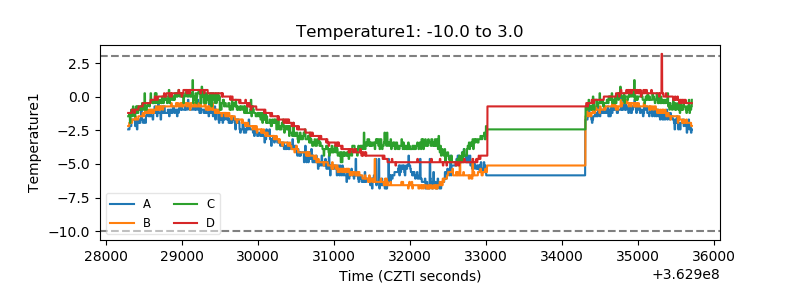 |
| Veto HV Monitor | 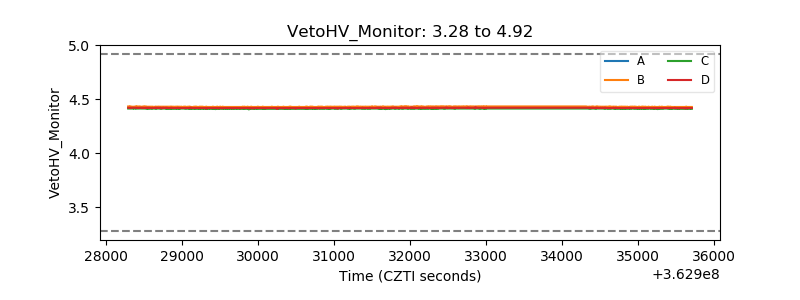 |
| Veto LLD | 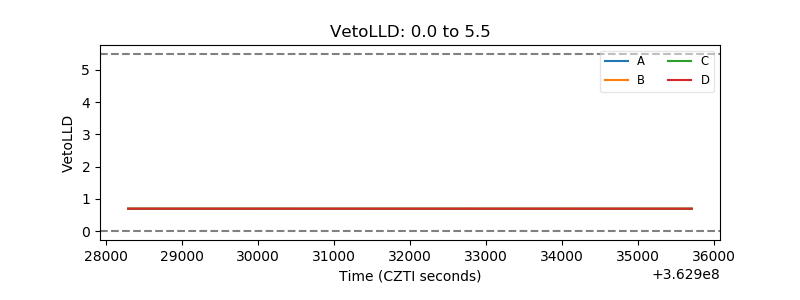 |
| Alpha Counter |  |
| _CPM_Rate | 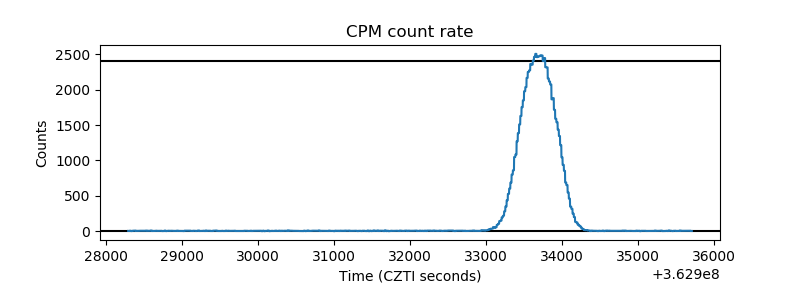 |
| CZT Counter | 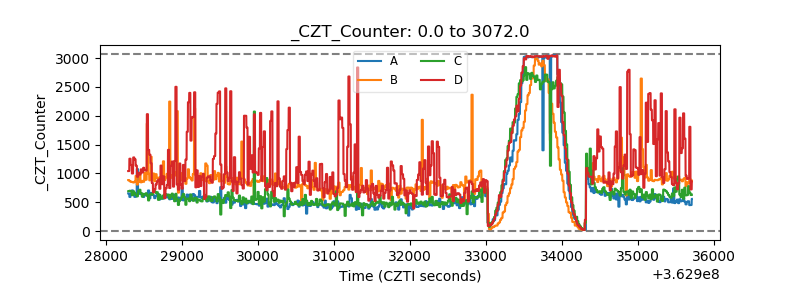 |
| +2.5 Volts monitor |  |
| +5 Volts monitor |  |
| _ROLL_ROT | 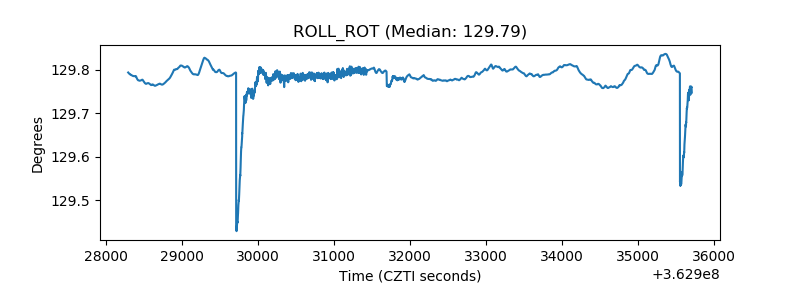 |
| _Roll_DEC | 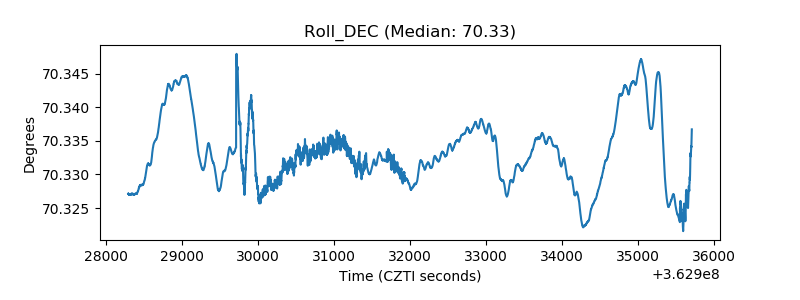 |
| _Roll_RA | 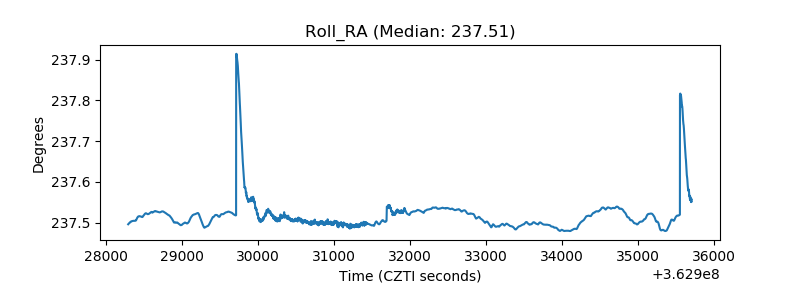 |
| Veto Counter | 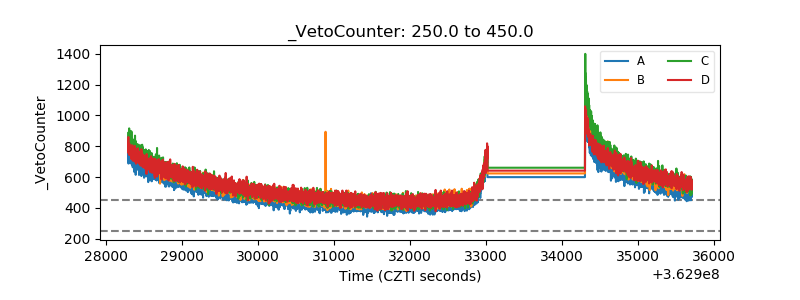 |