| Param | Original file | Final file |
|---|---|---|
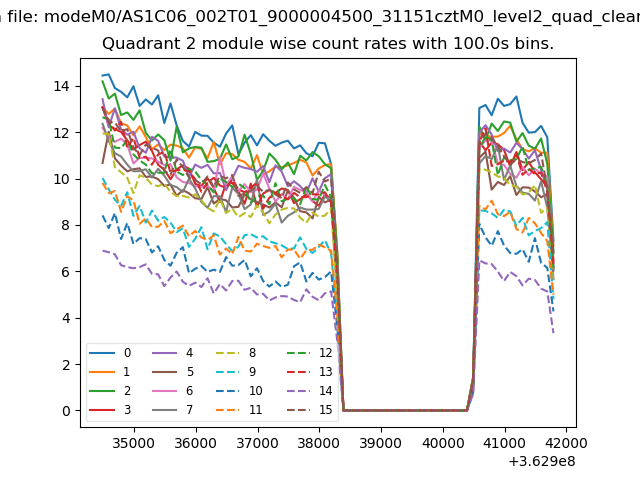
| Filename | modeM0/AS1C06_002T01_9000004500_31151cztM0_level2.evt | modeM0/AS1C06_002T01_9000004500_31151cztM0_level2_quad_clean.evt |
| Size (bytes) | 680,463,360 | 113,762,880 |
| Size | 648.9 MB | 108.5 MB |
| Events in quadrant A | 3,098,652 | 811,693 |
| Events in quadrant B | 5,198,137 | 789,410 |
| Events in quadrant C | 3,576,603 | 788,677 |
| Events in quadrant D | 8,324,876 | 631,508 |
| Mode M0 | |||
|---|---|---|---|
| Quadrant | BADHDUFLAG | Total packets | Discarded packets |
| A | 0 | 13033 | 1 |
| B | 0 | 19609 | 1 |
| C | 0 | 14784 | 1 |
| D | 0 | 29033 | 1 |
| Mode SS | |||
|---|---|---|---|
| Quadrant | BADHDUFLAG | Total packets | Discarded packets |
| A | 0 | 124 | 0 |
| B | 0 | 124 | 0 |
| C | 0 | 124 | 0 |
| D | 0 | 124 | 0 |
| Mode M9 | |||
|---|---|---|---|
| Quadrant | BADHDUFLAG | Total packets | Discarded packets |
| A | 0 | 13 | 0 |
| B | 0 | 13 | 0 |
| C | 0 | 13 | 0 |
| D | 0 | 13 | 0 |
| Quadrant | Total seconds | Saturated seconds | Saturation percentage |
|---|---|---|---|
| A | 6062 | 58 | 0.956780% |
| B | 6062 | 159 | 2.622897% |
| C | 6062 | 198 | 3.266249% |
| D | 6062 | 1974 | 32.563510% |
Noise dominated data is calculated using 1-second bins in cleaned event files. If a bin has >2000 counts, and if more than 50% of those come from <1% of pixels, then it is considered to be noise-dominated and hence unusable.
| Quadrant | # 1 sec bins | Bins with >0 counts | Bins with >2000 counts | High rate bins dominated by noise | Noise dominated (total time) | Noise dominated (detector-on time) | Marked lightcurve |
|---|---|---|---|---|---|---|---|
| A | 7367 | 6063 | 0 | 0 | 0.00% | 0.00% | 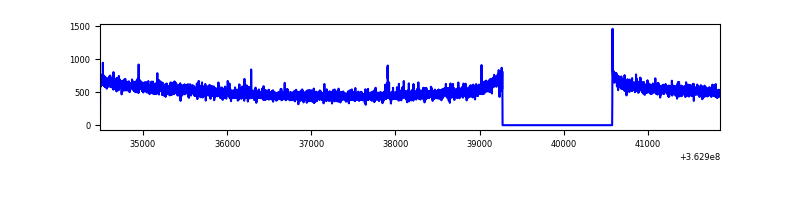 |
| B | 7367 | 6063 | 7 | 7 | 0.10% | 0.12% | 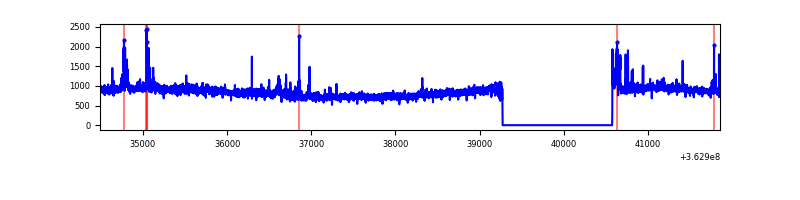 |
| C | 7367 | 6063 | 24 | 24 | 0.33% | 0.40% |  |
| D | 7367 | 6063 | 1284 | 1284 | 17.43% | 21.18% |  |
Top three noisy pixels from each quadrant. If the there are fewer than three noisy pixels in the level2.evt file, extra rows are filled as -1
| Pixel properties | Quadrant properties | ||||||
|---|---|---|---|---|---|---|---|
| Quadrant | DetID | PixID | Counts | Sigma | Mean | Median | Sigma |
| A | 13 | 254 | 12651 | 75.82 | 799 | 784 | 156.5 |
| A | 0 | 226 | 6912 | 39.15 | 799 | 784 | 156.5 |
| A | 3 | 137 | 6887 | 38.99 | 799 | 784 | 156.5 |
| B | 6 | 159 | 1911042 | 13285.82 | 787 | 769 | 143.8 |
| B | 0 | 190 | 95757 | 660.64 | 787 | 769 | 143.8 |
| B | 0 | 230 | 43216 | 295.22 | 787 | 769 | 143.8 |
| C | 3 | 233 | 231965 | 1286.68 | 779 | 787 | 179.7 |
| C | 14 | 238 | 131501 | 727.52 | 779 | 787 | 179.7 |
| C | 0 | 10 | 92369 | 509.72 | 779 | 787 | 179.7 |
| D | 13 | 174 | 3108336 | 18370.52 | 678 | 663 | 169.2 |
| D | 8 | 195 | 1947919 | 11510.9 | 678 | 663 | 169.2 |
| D | 2 | 250 | 288487 | 1701.43 | 678 | 663 | 169.2 |
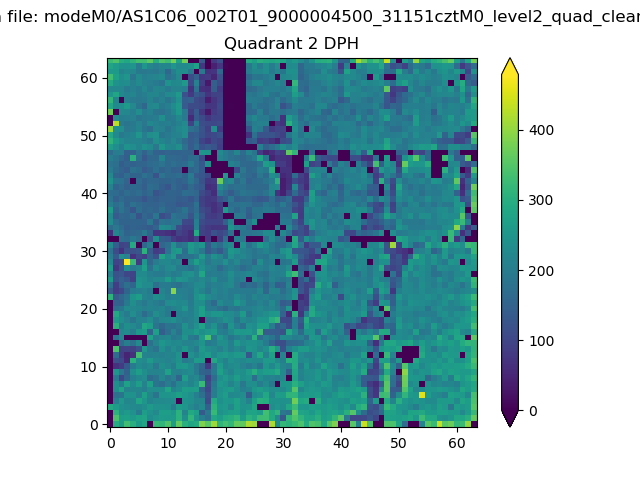
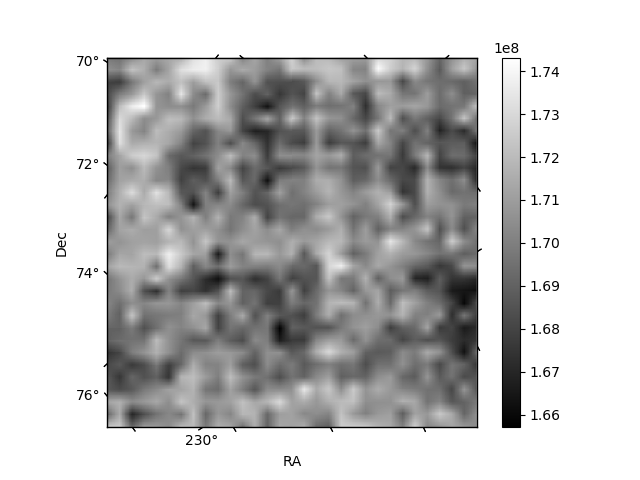
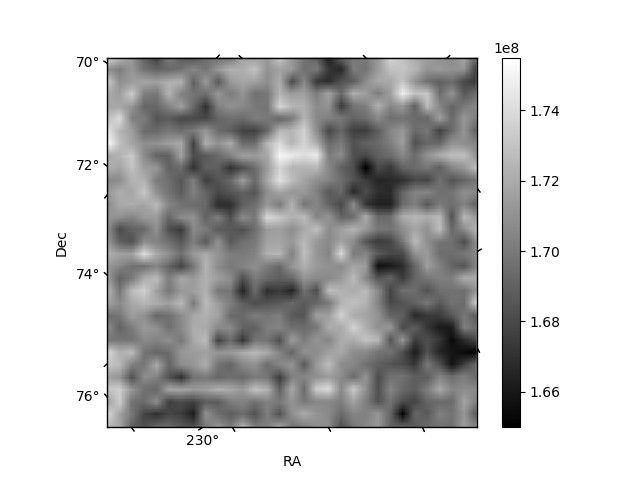
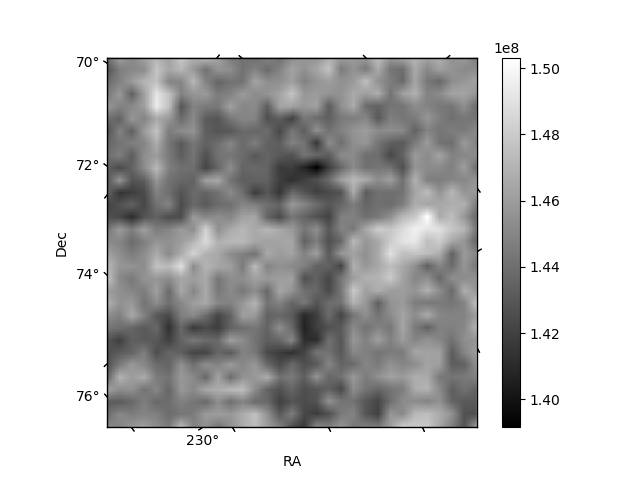
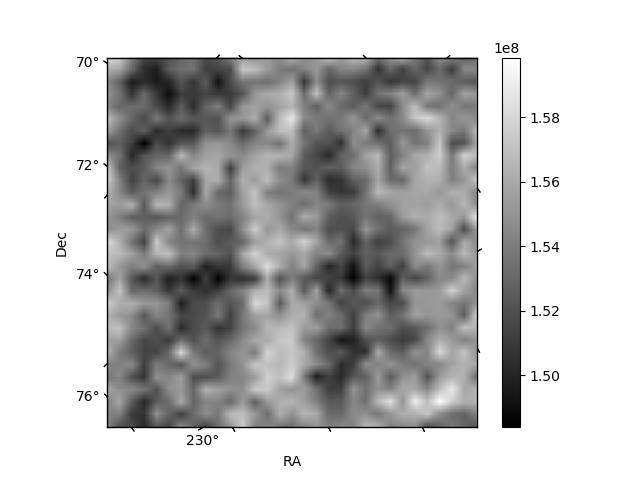
Histogram calculated using DETX and DETY for each event in the final _common_clean file
| Quadrant A | 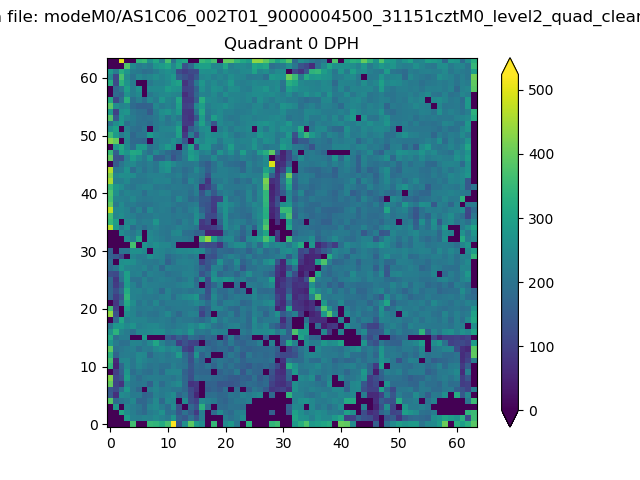 |
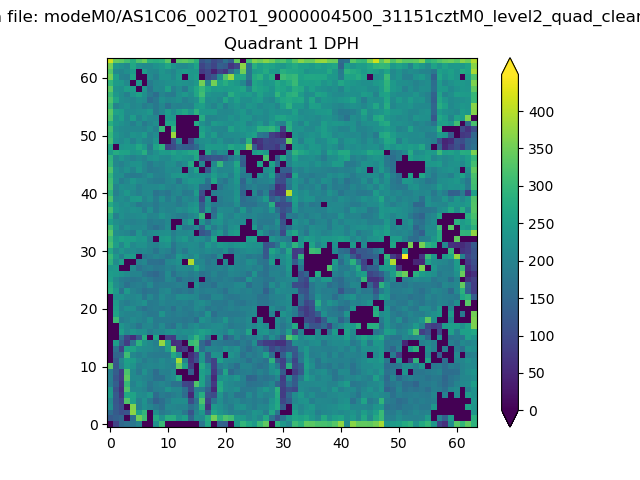 |
Quadrant B |
|---|---|---|---|
| Quadrant D | 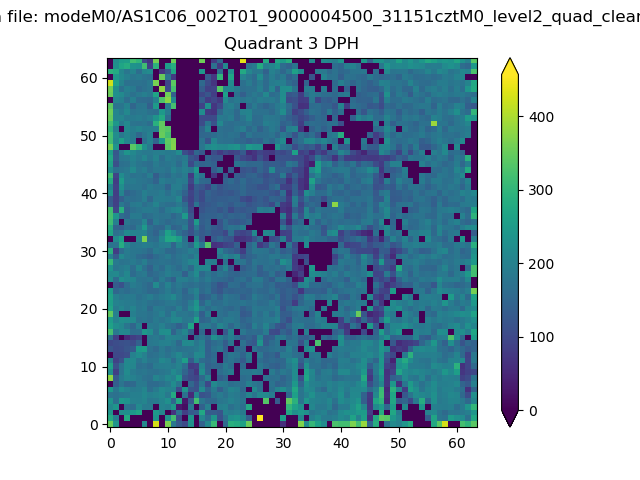 |
 |
Quadrant C |
| Plot type | Count rate plots | Images |
|---|---|---|
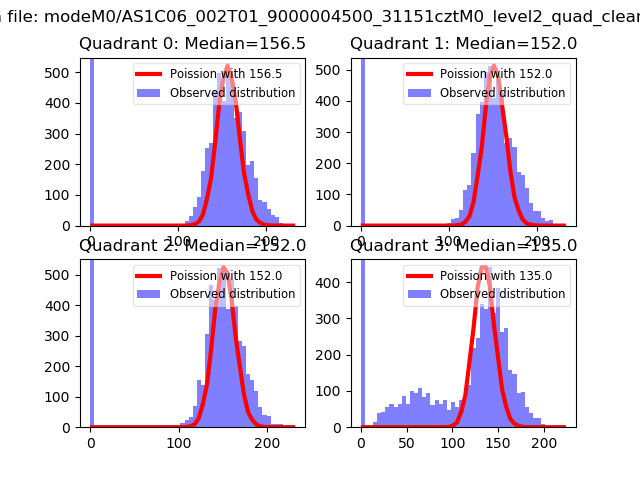
| Comparison with Poisson distribution Blue bars denote a histogram of data divided into 1 sec bins. Red curve is a Poisson curve with rate = median count rate of data. |
 |
 |
| Quadrant-wise count rates Data is divided into 100 sec bins |
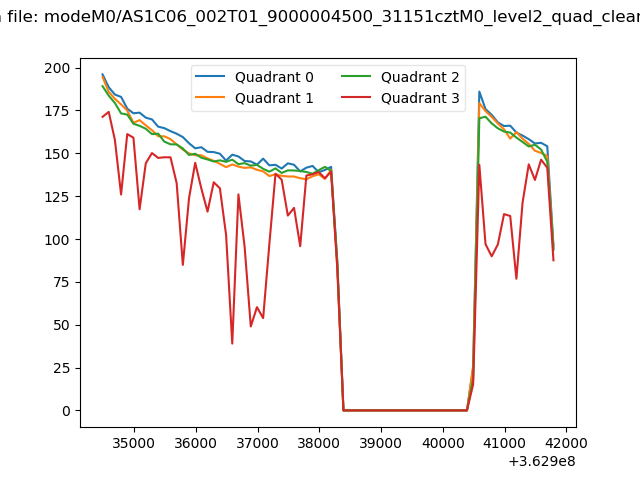 |
|
| Module-wise count rates for Quadrant A Data is divided into 100 sec bins |
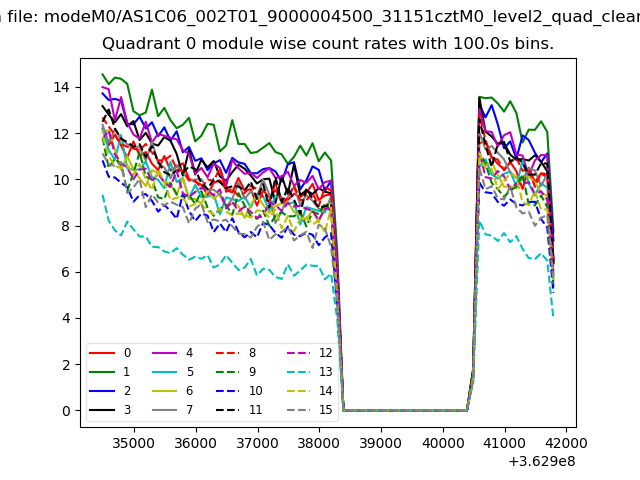 |
 |
| Module-wise count rates for Quadrant B Data is divided into 100 sec bins |
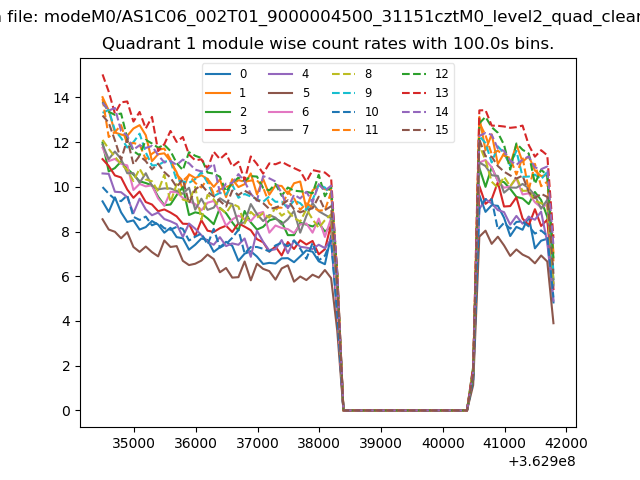 |
 |
| Module-wise count rates for Quadrant C Data is divided into 100 sec bins |
 |
 |
| Module-wise count rates for Quadrant D Data is divided into 100 sec bins |
 |
 |
| Parameter | Plot |
|---|---|
| CZT HV Monitor | 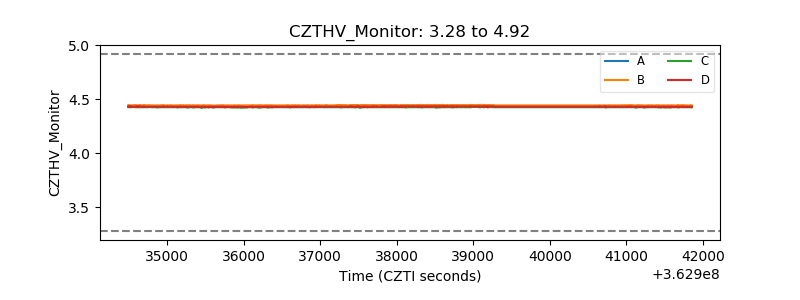 |
| D_VDD |  |
| Temperature 1 | 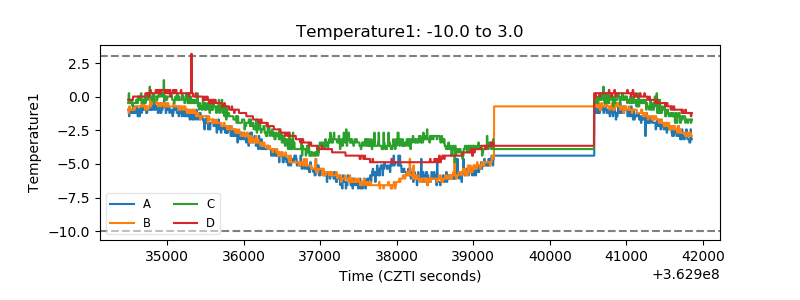 |
| Veto HV Monitor | 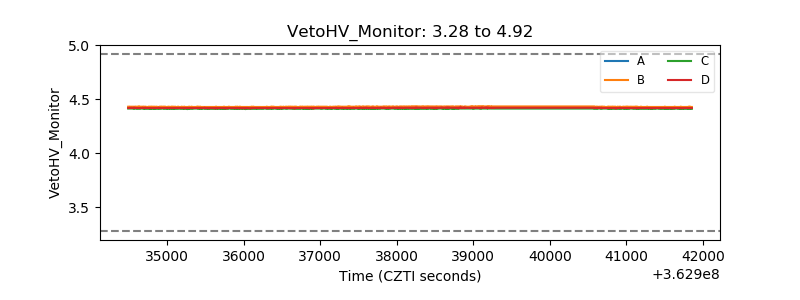 |
| Veto LLD | 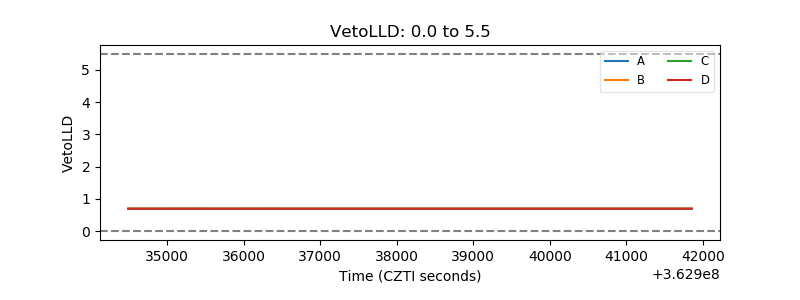 |
| Alpha Counter | 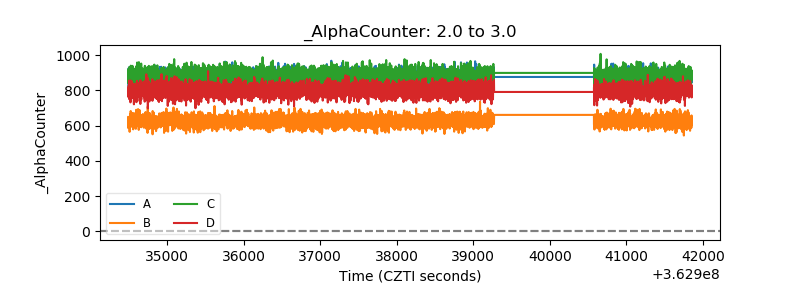 |
| _CPM_Rate | 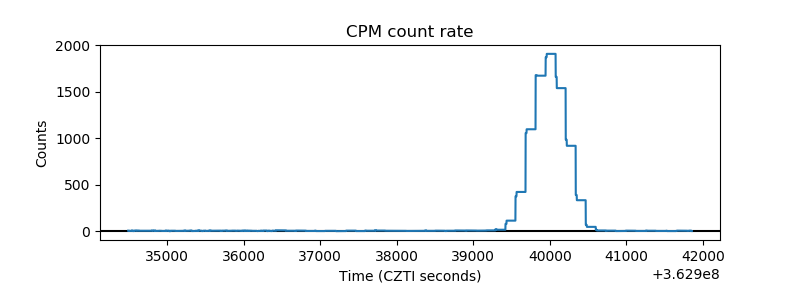 |
| CZT Counter | 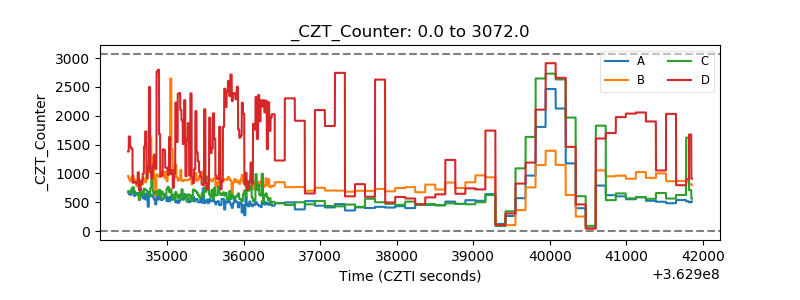 |
| +2.5 Volts monitor |  |
| +5 Volts monitor |  |
| _ROLL_ROT | 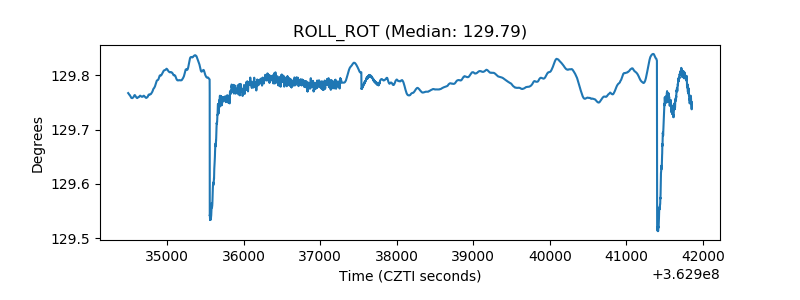 |
| _Roll_DEC | 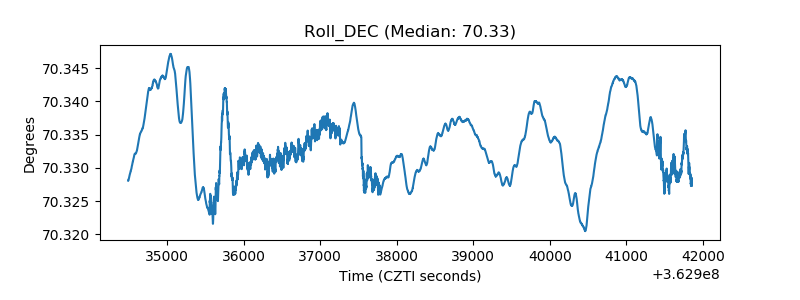 |
| _Roll_RA | 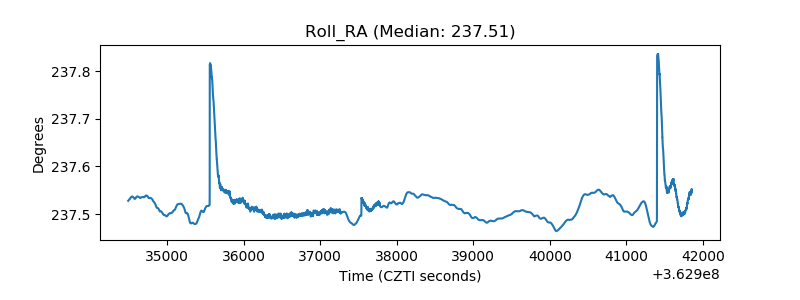 |
| Veto Counter | 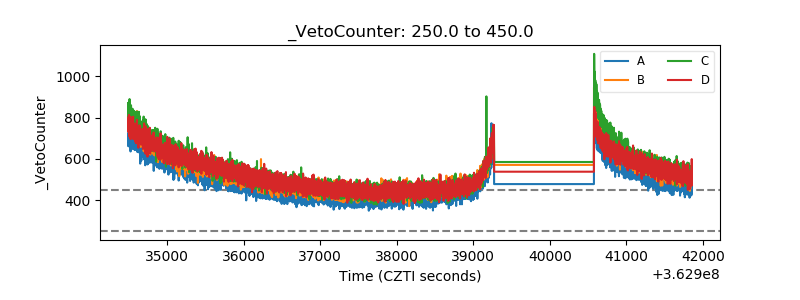 |