| Param | Original file | Final file |
|---|---|---|
| Filename | modeM0/AS1C06_002T01_9000004500_31152cztM0_level2.evt | modeM0/AS1C06_002T01_9000004500_31152cztM0_level2_quad_clean.evt |
| Size (bytes) | 668,407,680 | 106,695,360 |
| Size | 637.4 MB | 101.8 MB |
| Events in quadrant A | 3,068,568 | 740,586 |
| Events in quadrant B | 5,358,579 | 723,918 |
| Events in quadrant C | 3,487,994 | 719,120 |
| Events in quadrant D | 7,904,359 | 609,617 |
| Mode M0 | |||
|---|---|---|---|
| Quadrant | BADHDUFLAG | Total packets | Discarded packets |
| A | 0 | 13123 | 2 |
| B | 0 | 20365 | 2 |
| C | 0 | 14336 | 2 |
| D | 0 | 27849 | 2 |
| Mode SS | |||
|---|---|---|---|
| Quadrant | BADHDUFLAG | Total packets | Discarded packets |
| A | 0 | 126 | 0 |
| B | 0 | 126 | 0 |
| C | 0 | 126 | 0 |
| D | 0 | 126 | 0 |
| Mode M9 | |||
|---|---|---|---|
| Quadrant | BADHDUFLAG | Total packets | Discarded packets |
| A | 0 | 12 | 0 |
| B | 0 | 12 | 0 |
| C | 0 | 12 | 0 |
| D | 0 | 12 | 0 |
| Quadrant | Total seconds | Saturated seconds | Saturation percentage |
|---|---|---|---|
| A | 6273 | 28 | 0.446357% |
| B | 6274 | 157 | 2.502391% |
| C | 6274 | 250 | 3.984699% |
| D | 6274 | 1327 | 21.150781% |
Noise dominated data is calculated using 1-second bins in cleaned event files. If a bin has >2000 counts, and if more than 50% of those come from <1% of pixels, then it is considered to be noise-dominated and hence unusable.
| Quadrant | # 1 sec bins | Bins with >0 counts | Bins with >2000 counts | High rate bins dominated by noise | Noise dominated (total time) | Noise dominated (detector-on time) | Marked lightcurve |
|---|---|---|---|---|---|---|---|
| A | 7433 | 6274 | 0 | 0 | 0.00% | 0.00% | 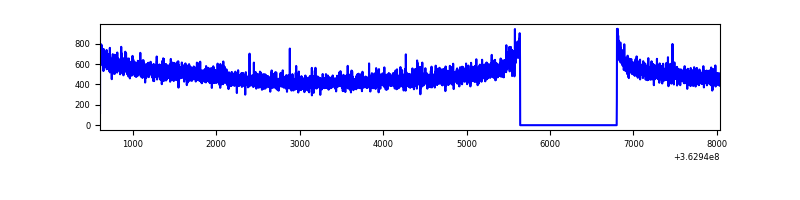 |
| B | 7434 | 6275 | 6 | 6 | 0.08% | 0.10% | 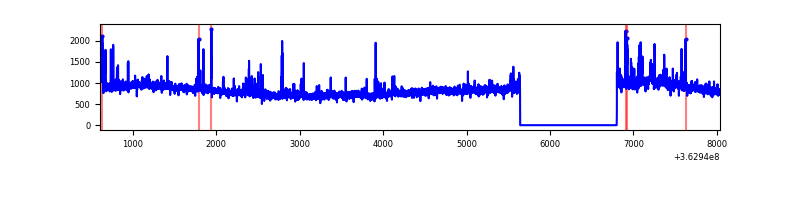 |
| C | 7434 | 6275 | 25 | 25 | 0.34% | 0.40% | 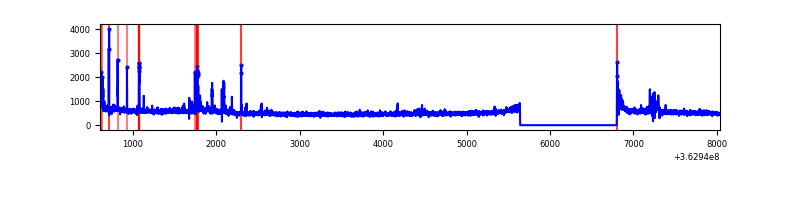 |
| D | 7434 | 6275 | 865 | 865 | 11.64% | 13.78% | 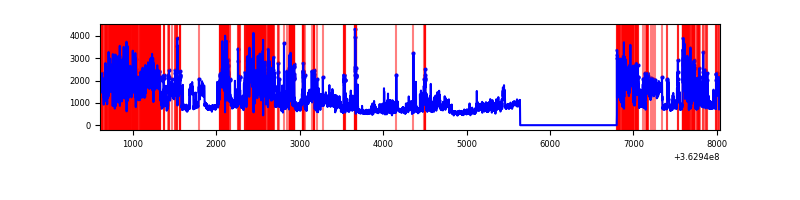 |
Top three noisy pixels from each quadrant. If the there are fewer than three noisy pixels in the level2.evt file, extra rows are filled as -1
| Pixel properties | Quadrant properties | ||||||
|---|---|---|---|---|---|---|---|
| Quadrant | DetID | PixID | Counts | Sigma | Mean | Median | Sigma |
| A | 13 | 254 | 12733 | 75.91 | 794 | 779 | 157.5 |
| A | 3 | 137 | 7229 | 40.96 | 794 | 779 | 157.5 |
| A | 0 | 226 | 6856 | 38.59 | 794 | 779 | 157.5 |
| B | 6 | 159 | 1993922 | 13585.38 | 786 | 766 | 146.7 |
| B | 0 | 190 | 117124 | 793.1 | 786 | 766 | 146.7 |
| B | 0 | 230 | 40967 | 274.01 | 786 | 766 | 146.7 |
| C | 14 | 238 | 149066 | 831.66 | 771 | 776 | 178.3 |
| C | 0 | 10 | 128074 | 713.93 | 771 | 776 | 178.3 |
| C | 3 | 233 | 97285 | 541.26 | 771 | 776 | 178.3 |
| D | 8 | 195 | 2339668 | 13017.98 | 707 | 692 | 179.7 |
| D | 13 | 174 | 2158188 | 12007.93 | 707 | 692 | 179.7 |
| D | 2 | 250 | 413876 | 2299.65 | 707 | 692 | 179.7 |
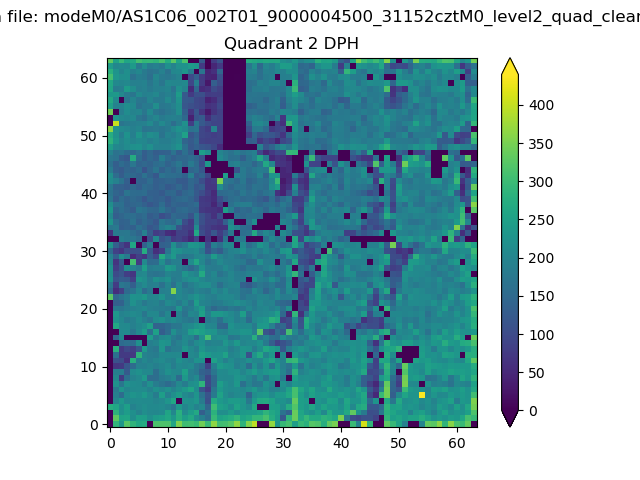
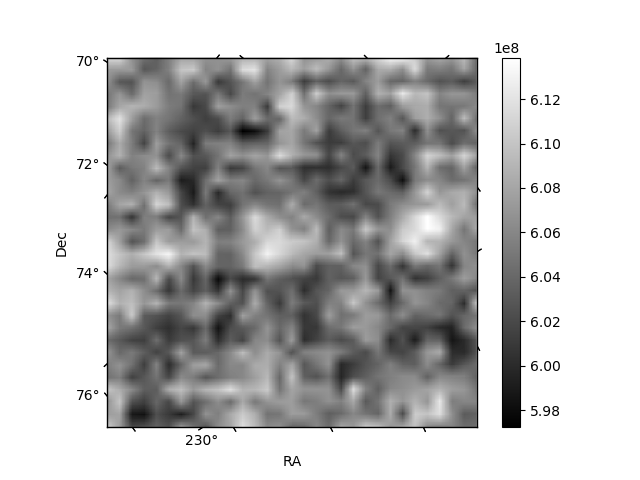
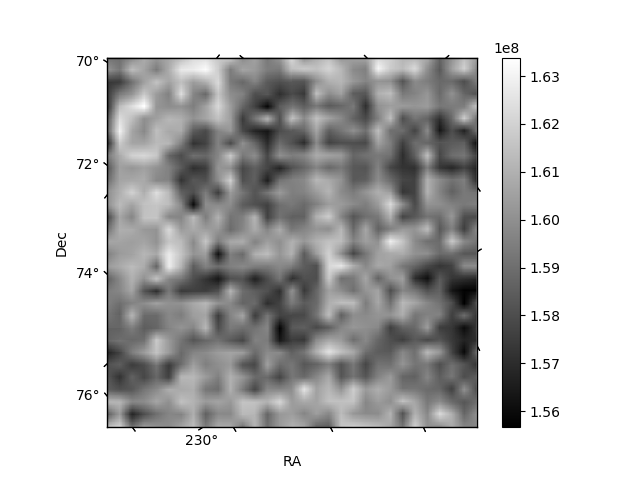
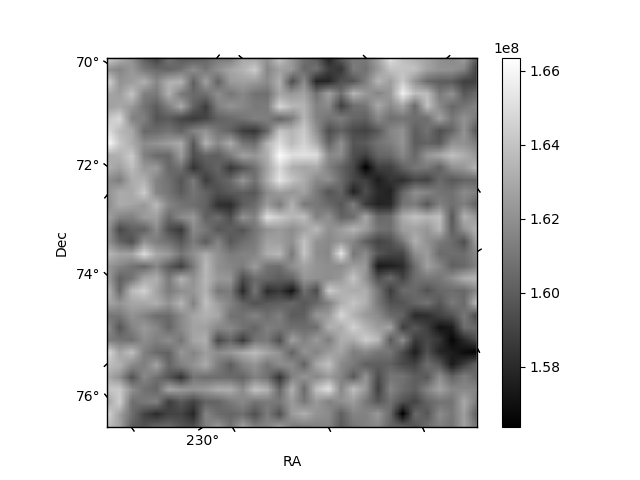
Histogram calculated using DETX and DETY for each event in the final _common_clean file
| Quadrant A | 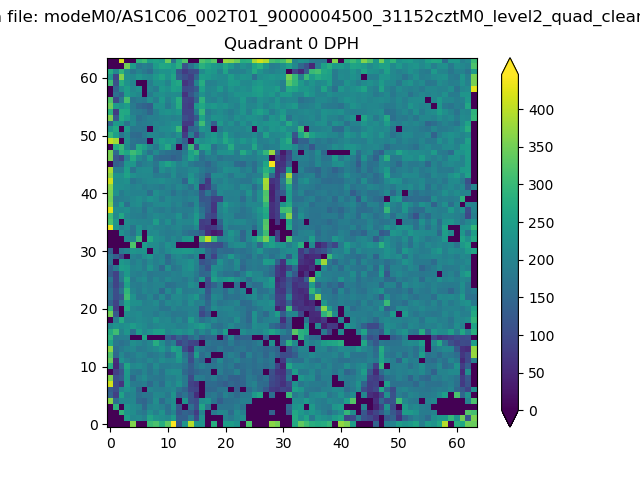 |
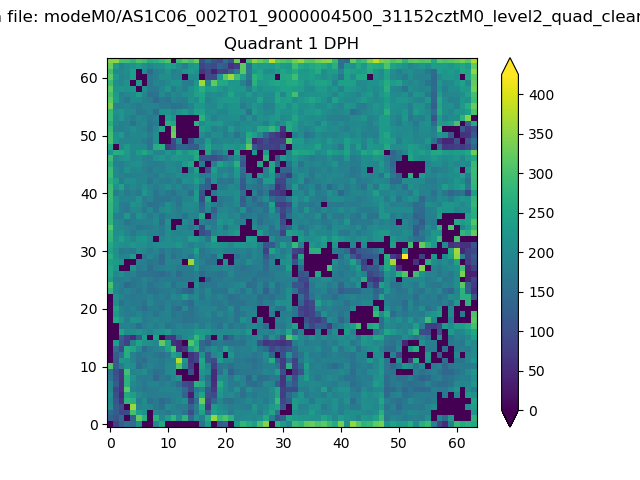 |
Quadrant B |
|---|---|---|---|
| Quadrant D | 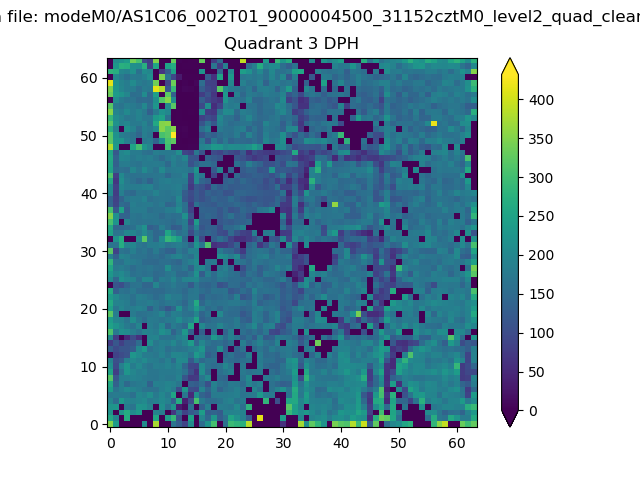 |
 |
Quadrant C |
| Plot type | Count rate plots | Images |
|---|---|---|
| Comparison with Poisson distribution Blue bars denote a histogram of data divided into 1 sec bins. Red curve is a Poisson curve with rate = median count rate of data. |
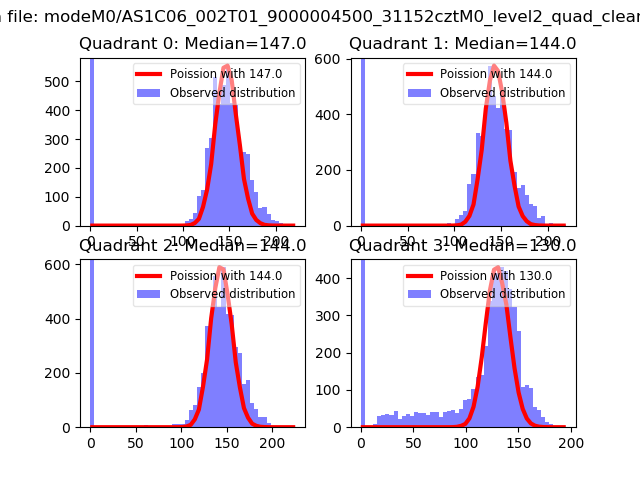 |
 |
| Quadrant-wise count rates Data is divided into 100 sec bins |
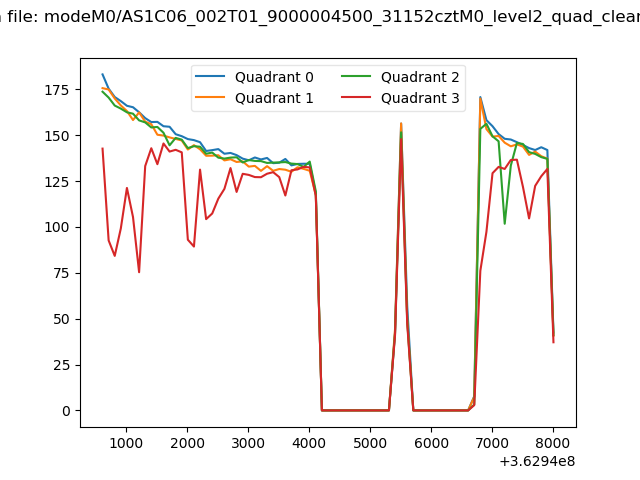 |
|
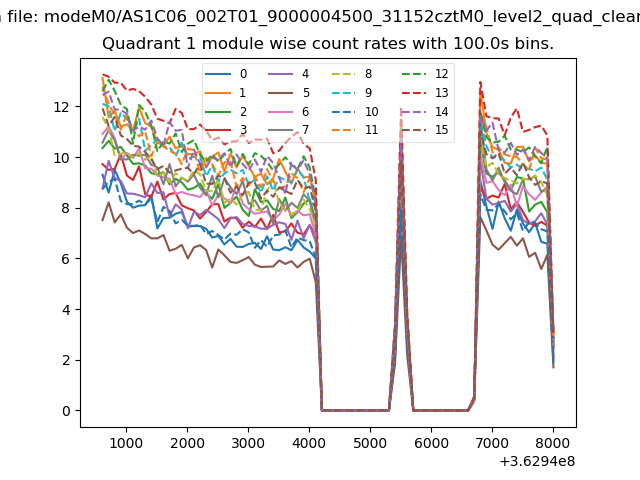
| Module-wise count rates for Quadrant A Data is divided into 100 sec bins |
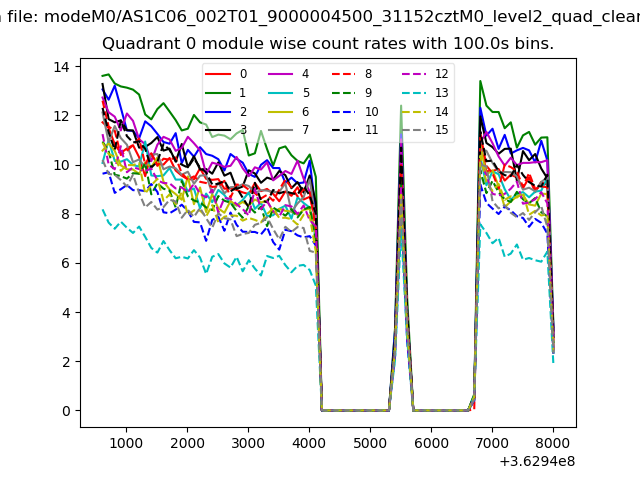 |
 |
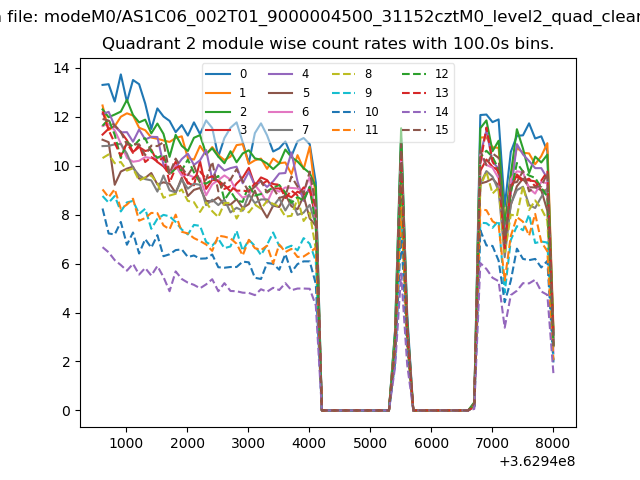
| Module-wise count rates for Quadrant B Data is divided into 100 sec bins |
 |
 |
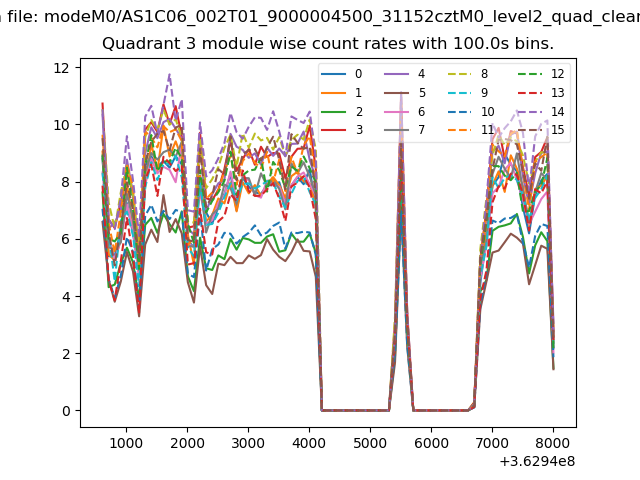
| Module-wise count rates for Quadrant C Data is divided into 100 sec bins |
 |
 |
| Module-wise count rates for Quadrant D Data is divided into 100 sec bins |
 |
 |
| Parameter | Plot |
|---|---|
| CZT HV Monitor | 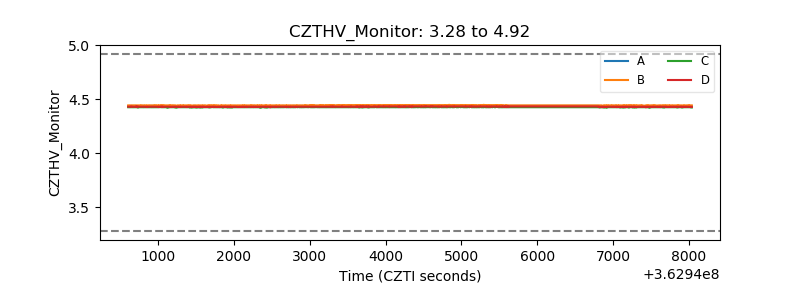 |
| D_VDD | 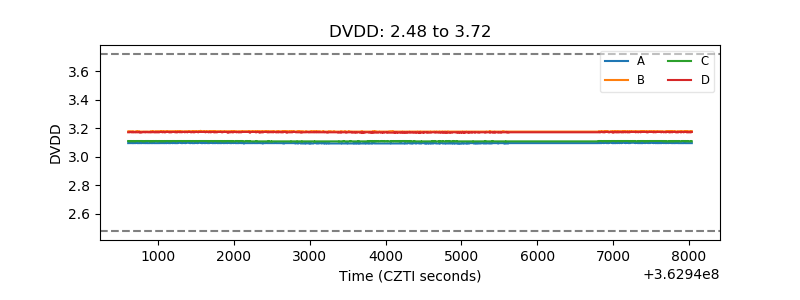 |
| Temperature 1 | 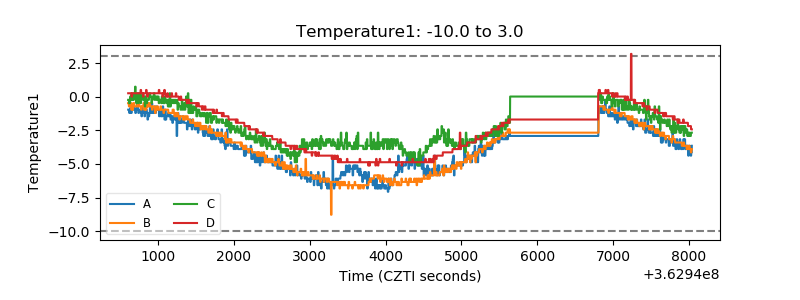 |
| Veto HV Monitor |  |
| Veto LLD | 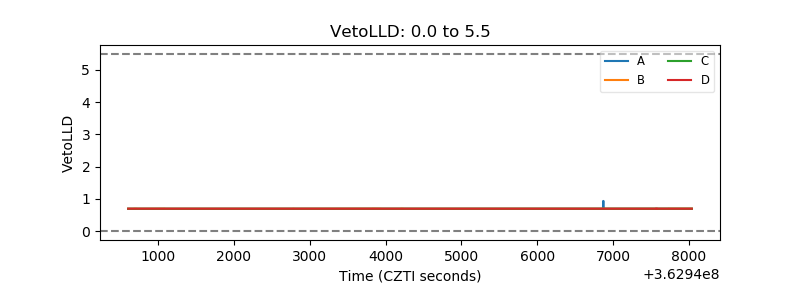 |
| Alpha Counter | 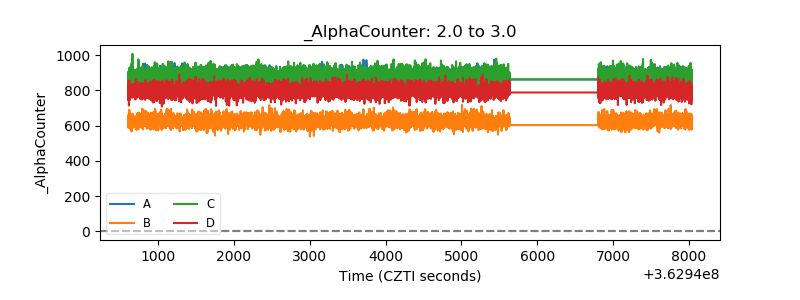 |
| _CPM_Rate | 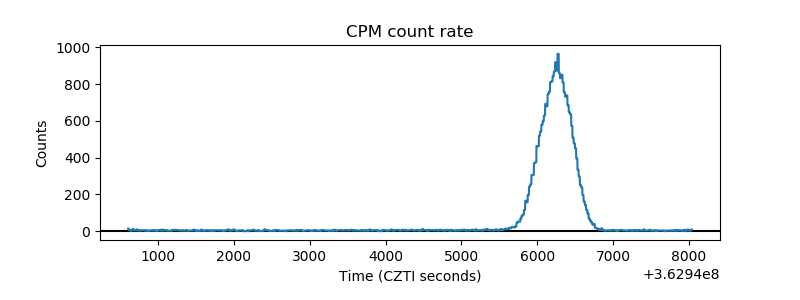 |
| CZT Counter | 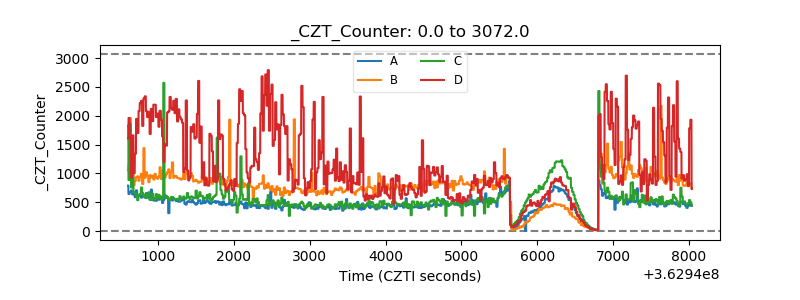 |
| +2.5 Volts monitor |  |
| +5 Volts monitor |  |
| _ROLL_ROT | 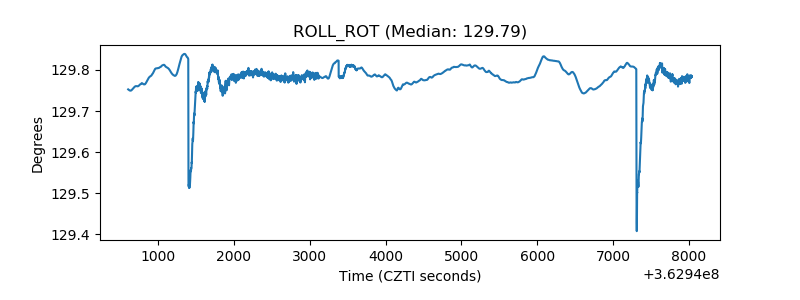 |
| _Roll_DEC | 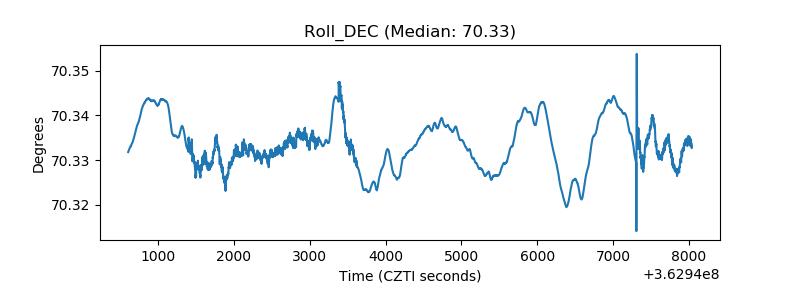 |
| _Roll_RA | 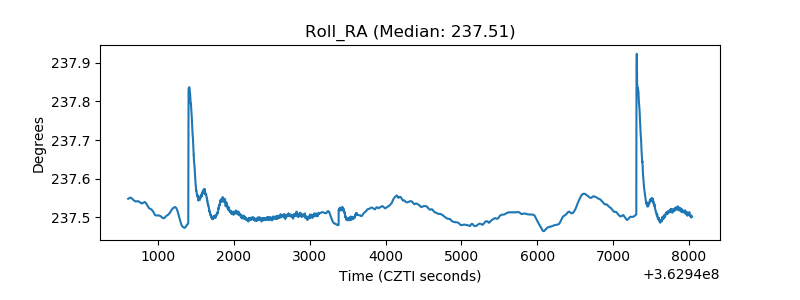 |
| Veto Counter | 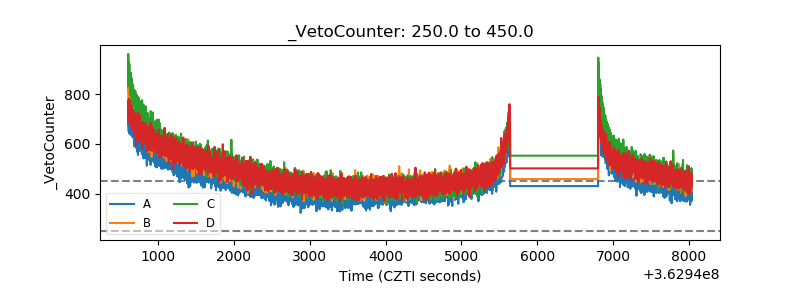 |