| Param | Original file | Final file |
|---|---|---|
| Filename | modeM0/AS1C06_002T01_9000004500_31156cztM0_level2.evt | modeM0/AS1C06_002T01_9000004500_31156cztM0_level2_quad_clean.evt |
| Size (bytes) | 345,542,400 | 53,176,320 |
| Size | 329.5 MB | 50.7 MB |
| Events in quadrant A | 1,753,503 | 342,006 |
| Events in quadrant B | 3,031,611 | 336,205 |
| Events in quadrant C | 1,951,654 | 332,648 |
| Events in quadrant D | 3,458,962 | 319,966 |
| Mode M0 | |||
|---|---|---|---|
| Quadrant | BADHDUFLAG | Total packets | Discarded packets |
| A | 0 | 8131 | 1 |
| B | 0 | 12160 | 1 |
| C | 0 | 8474 | 1 |
| D | 0 | 13080 | 1 |
| Mode SS | |||
|---|---|---|---|
| Quadrant | BADHDUFLAG | Total packets | Discarded packets |
| A | 0 | 80 | 0 |
| B | 0 | 80 | 0 |
| C | 0 | 80 | 0 |
| D | 0 | 80 | 0 |
| Mode M9 | |||
|---|---|---|---|
| Quadrant | BADHDUFLAG | Total packets | Discarded packets |
| A | 0 | 3 | 0 |
| B | 0 | 3 | 0 |
| C | 0 | 3 | 0 |
| D | 0 | 3 | 0 |
| Quadrant | Total seconds | Saturated seconds | Saturation percentage |
|---|---|---|---|
| A | 3957 | 17 | 0.429618% |
| B | 3958 | 75 | 1.894896% |
| C | 3958 | 78 | 1.970692% |
| D | 3958 | 179 | 4.522486% |
Noise dominated data is calculated using 1-second bins in cleaned event files. If a bin has >2000 counts, and if more than 50% of those come from <1% of pixels, then it is considered to be noise-dominated and hence unusable.
| Quadrant | # 1 sec bins | Bins with >0 counts | Bins with >2000 counts | High rate bins dominated by noise | Noise dominated (total time) | Noise dominated (detector-on time) | Marked lightcurve |
|---|---|---|---|---|---|---|---|
| A | 4247 | 3958 | 0 | 0 | 0.00% | 0.00% | 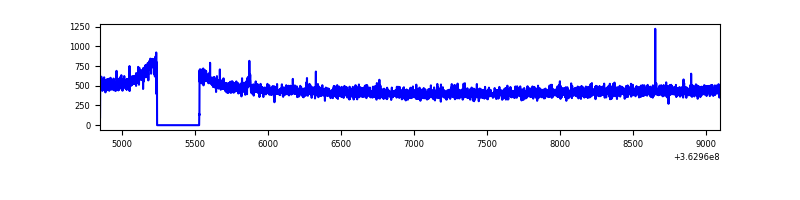 |
| B | 4248 | 3959 | 0 | 0 | 0.00% | 0.00% |  |
| C | 4248 | 3959 | 0 | 0 | 0.00% | 0.00% | 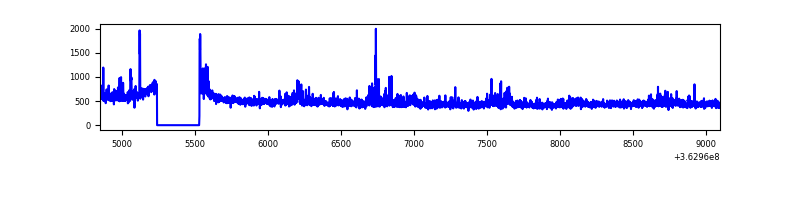 |
| D | 4248 | 3959 | 133 | 133 | 3.13% | 3.36% | 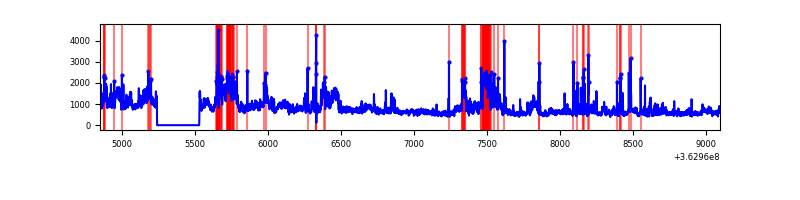 |
Top three noisy pixels from each quadrant. If the there are fewer than three noisy pixels in the level2.evt file, extra rows are filled as -1
| Pixel properties | Quadrant properties | ||||||
|---|---|---|---|---|---|---|---|
| Quadrant | DetID | PixID | Counts | Sigma | Mean | Median | Sigma |
| A | 13 | 254 | 7886 | 79.79 | 453 | 444 | 93.3 |
| A | 3 | 137 | 4641 | 45.0 | 453 | 444 | 93.3 |
| A | 0 | 226 | 3755 | 35.5 | 453 | 444 | 93.3 |
| B | 6 | 159 | 1176621 | 13502.64 | 451 | 439 | 87.1 |
| B | 0 | 190 | 40504 | 459.94 | 451 | 439 | 87.1 |
| B | 0 | 183 | 15999 | 178.62 | 451 | 439 | 87.1 |
| C | 14 | 238 | 76664 | 719.68 | 440 | 441 | 105.9 |
| C | 8 | 208 | 58182 | 545.18 | 440 | 441 | 105.9 |
| C | 3 | 233 | 40903 | 382.03 | 440 | 441 | 105.9 |
| D | 8 | 195 | 1208509 | 10547.45 | 431 | 423 | 114.5 |
| D | 13 | 174 | 218360 | 1902.74 | 431 | 423 | 114.5 |
| D | 2 | 250 | 176681 | 1538.86 | 431 | 423 | 114.5 |
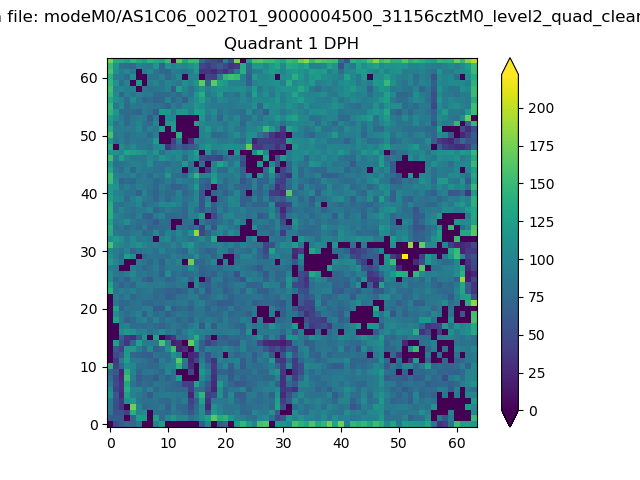
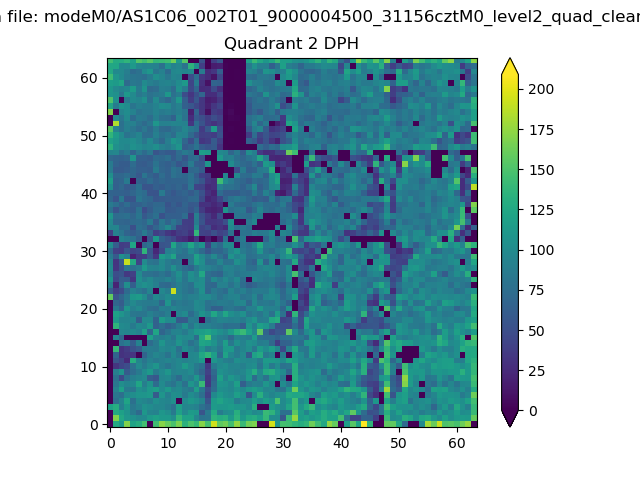
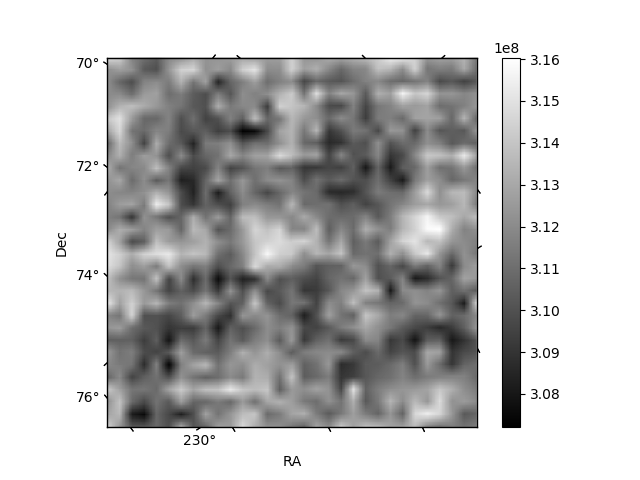
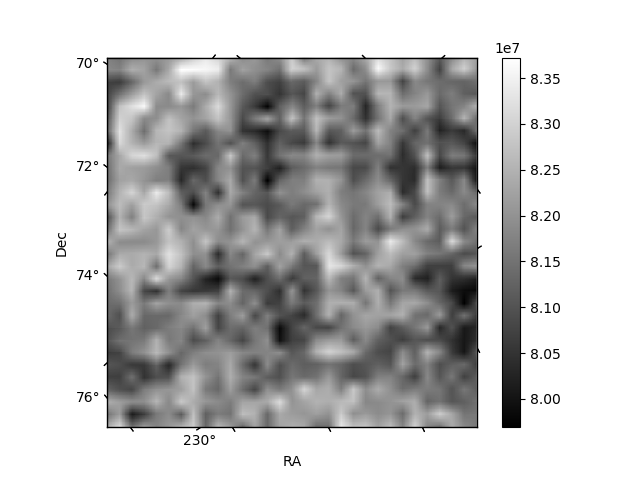
Histogram calculated using DETX and DETY for each event in the final _common_clean file
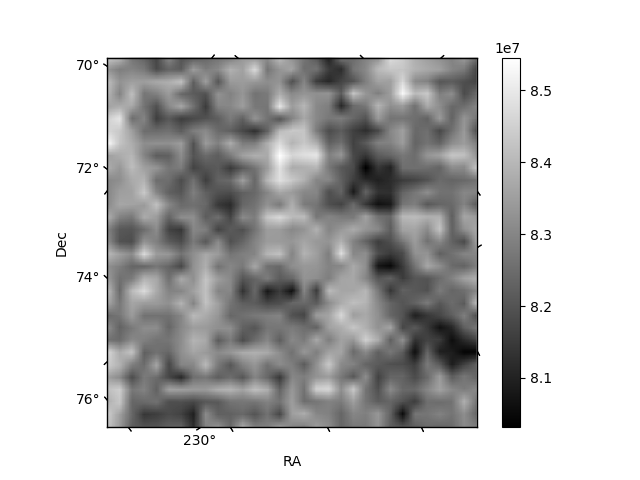
| Quadrant A | 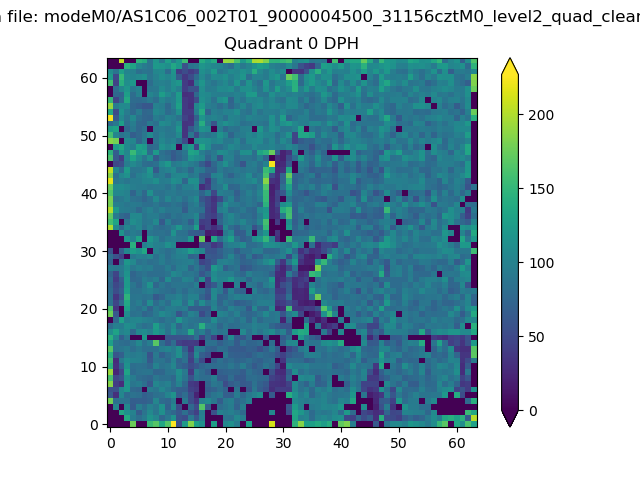 |
 |
Quadrant B |
|---|---|---|---|
| Quadrant D | 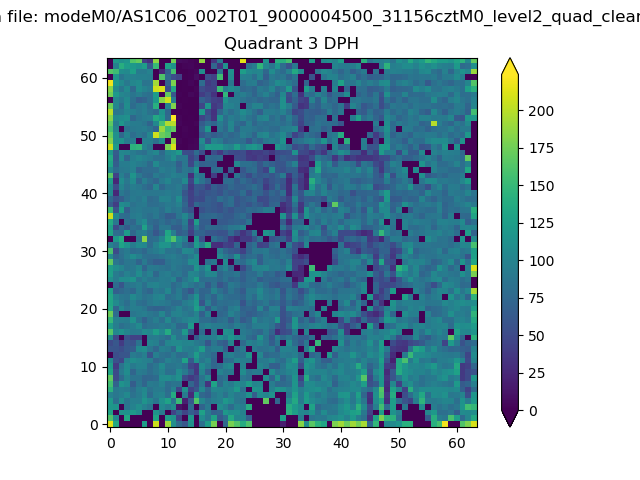 |
 |
Quadrant C |
| Plot type | Count rate plots | Images |
|---|---|---|
| Comparison with Poisson distribution Blue bars denote a histogram of data divided into 1 sec bins. Red curve is a Poisson curve with rate = median count rate of data. |
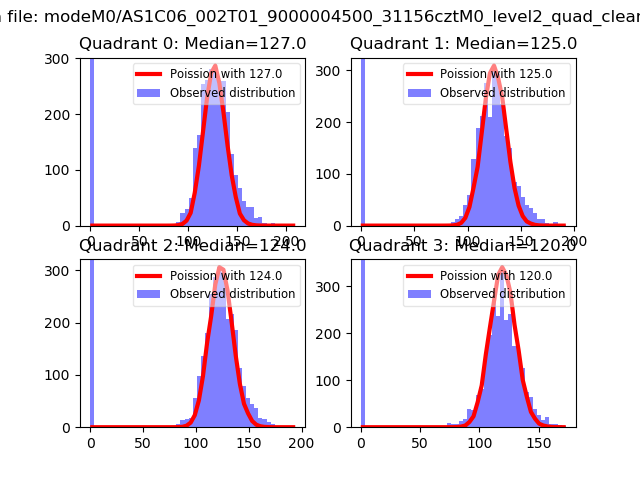 |
 |
| Quadrant-wise count rates Data is divided into 100 sec bins |
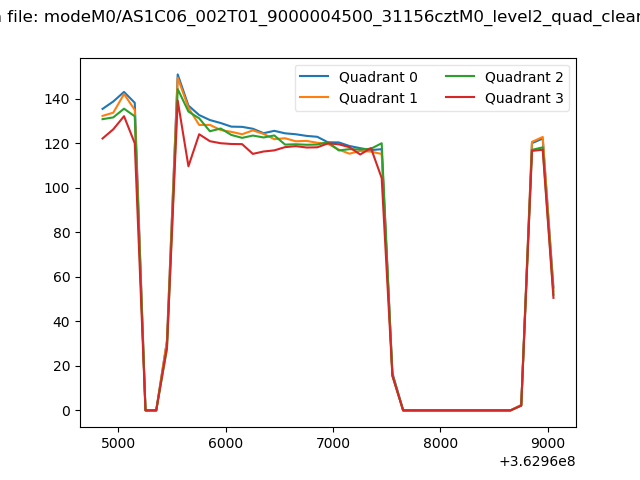 |
|
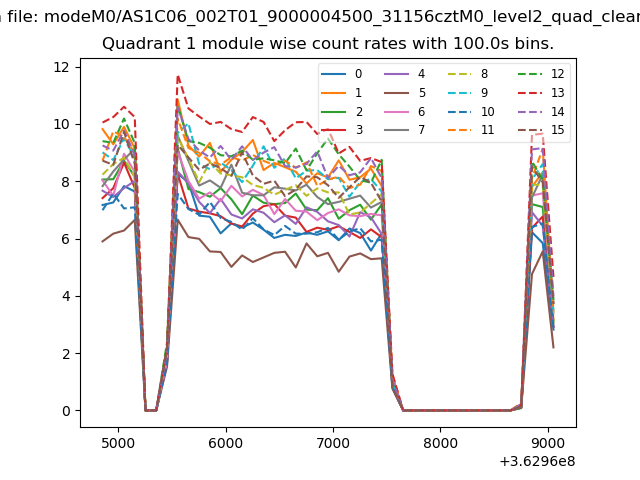
| Module-wise count rates for Quadrant A Data is divided into 100 sec bins |
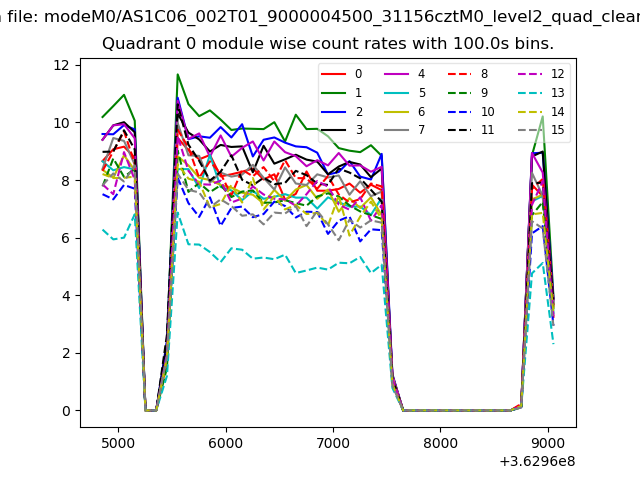 |
 |
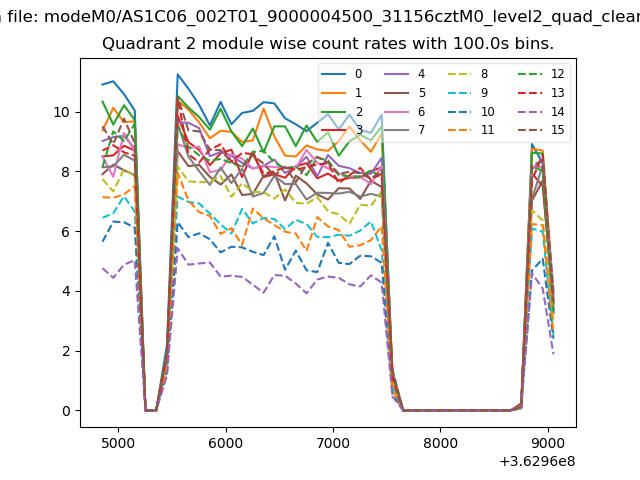
| Module-wise count rates for Quadrant B Data is divided into 100 sec bins |
 |
 |
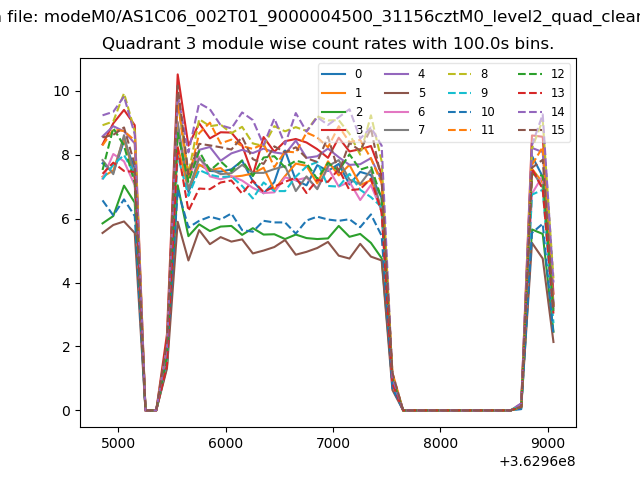
| Module-wise count rates for Quadrant C Data is divided into 100 sec bins |
 |
 |
| Module-wise count rates for Quadrant D Data is divided into 100 sec bins |
 |
 |
| Parameter | Plot |
|---|---|
| CZT HV Monitor | 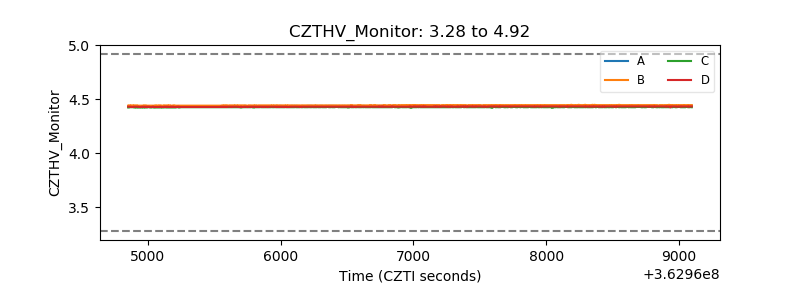 |
| D_VDD |  |
| Temperature 1 | 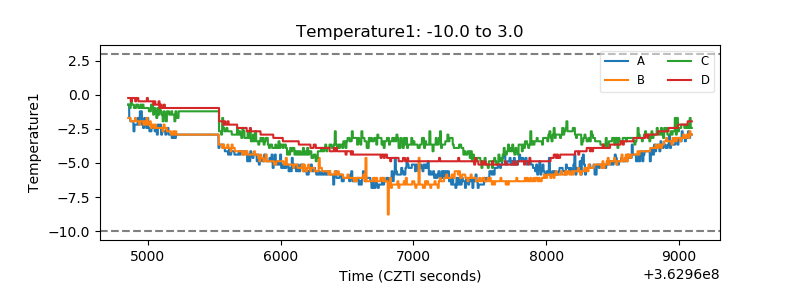 |
| Veto HV Monitor | 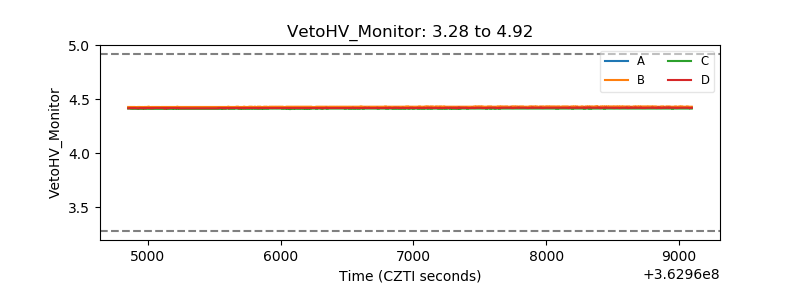 |
| Veto LLD | 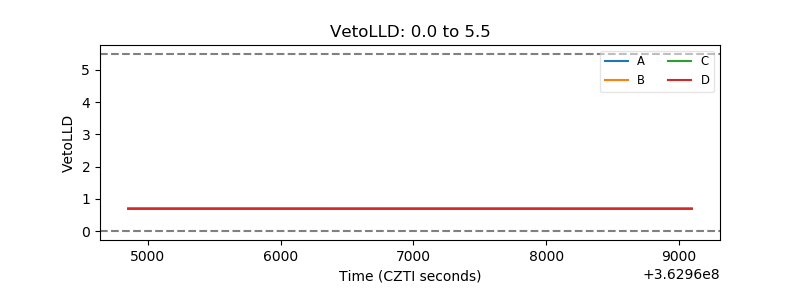 |
| Alpha Counter | 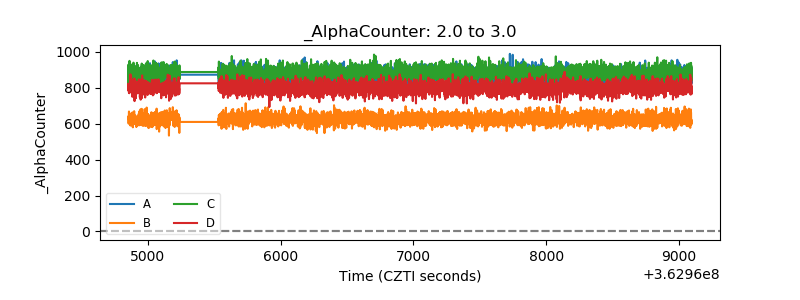 |
| _CPM_Rate | 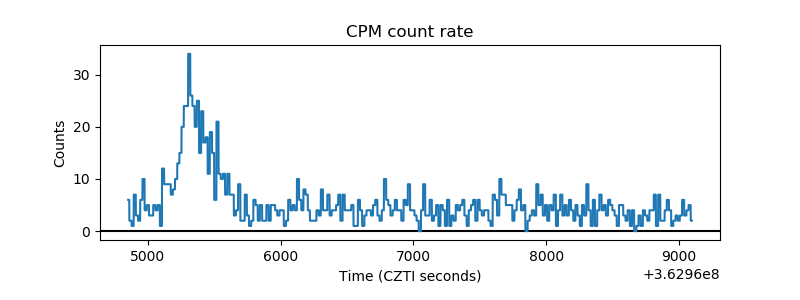 |
| CZT Counter | 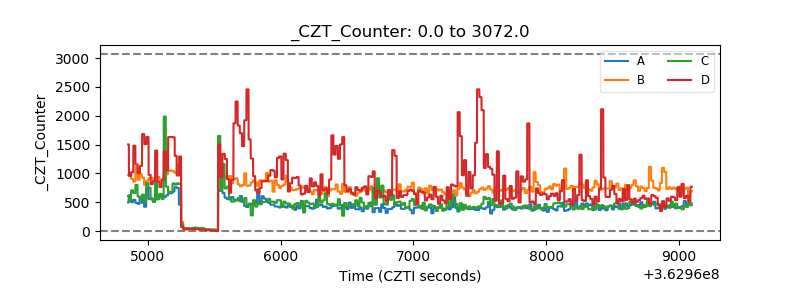 |
| +2.5 Volts monitor |  |
| +5 Volts monitor |  |
| _ROLL_ROT | 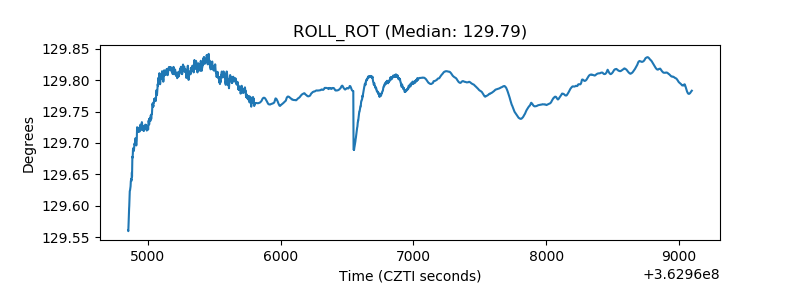 |
| _Roll_DEC | 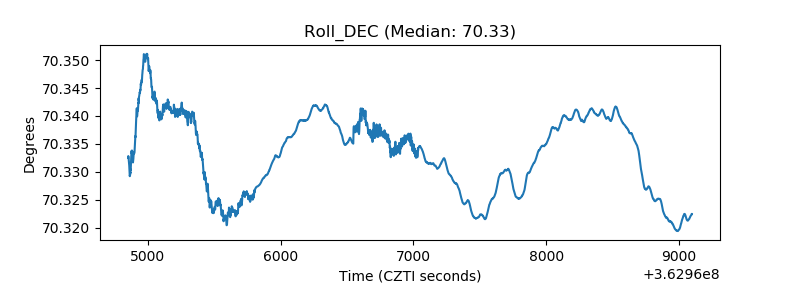 |
| _Roll_RA | 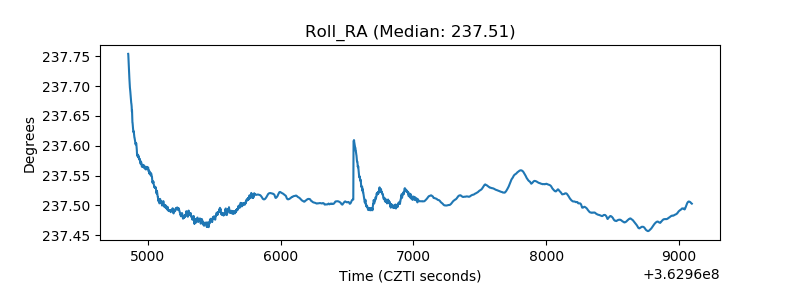 |
| Veto Counter | 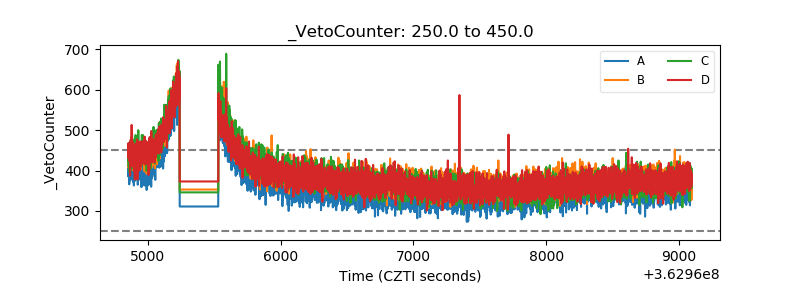 |