| Param | Original file | Final file |
|---|---|---|
| Filename | modeM0/AS1A10_058T02_9000004510cztM0_level2.fits | modeM0/AS1A10_058T02_9000004510cztM0_level2_quad_clean.evt |
| Size (bytes) | 1,124,343,360 | 926,228,160 |
| Size | 1.0 GB | 883.3 MB |
| Events in quadrant A | 7,091,718 | 5,405,188 |
| Events in quadrant B | 6,521,322 | 5,227,271 |
| Events in quadrant C | 6,775,184 | 5,054,626 |
| Events in quadrant D | 5,955,806 | 4,656,841 |
| Mode M0 | |||
|---|---|---|---|
| Quadrant | BADHDUFLAG | Total packets | Discarded packets |
| A | 0 | 235998 | 0 |
| B | 0 | 356083 | 0 |
| C | 0 | 243891 | 0 |
| D | 0 | 363611 | 0 |
| Mode SS | |||
|---|---|---|---|
| Quadrant | BADHDUFLAG | Total packets | Discarded packets |
| A | 0 | 2292 | 0 |
| B | 0 | 2292 | 0 |
| C | 0 | 2292 | 0 |
| D | 0 | 2292 | 0 |
| Mode M9 | |||
|---|---|---|---|
| Quadrant | BADHDUFLAG | Total packets | Discarded packets |
| A | 0 | 158 | 0 |
| B | 0 | 158 | 0 |
| C | 0 | 158 | 0 |
| D | 0 | 158 | 0 |
| Quadrant | Total seconds | Saturated seconds | Saturation percentage |
|---|---|---|---|
| A | 112433 | 1058 | 0.941005% |
| B | 112433 | 4475 | 3.980148% |
| C | 112433 | 3011 | 2.678039% |
| D | 112433 | 3072 | 2.732294% |
Noise dominated data is calculated using 1-second bins in cleaned event files. If a bin has >2000 counts, and if more than 50% of those come from <1% of pixels, then it is considered to be noise-dominated and hence unusable.
| Quadrant | # 1 sec bins | Bins with >0 counts | Bins with >2000 counts | High rate bins dominated by noise | Noise dominated (total time) | Noise dominated (detector-on time) | Marked lightcurve |
|---|---|---|---|---|---|---|---|
| A | 128233 | 112433 | 0 | 0 | 0.00% | 0.00% | 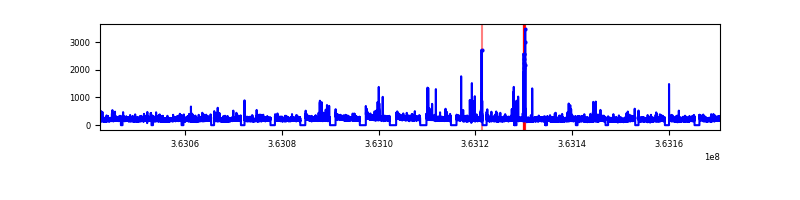 |
| B | 128233 | 112404 | 0 | 0 | 0.00% | 0.00% |  |
| C | 128233 | 112426 | 0 | 0 | 0.00% | 0.00% |  |
| D | 128233 | 112430 | 0 | 0 | 0.00% | 0.00% |  |
Top three noisy pixels from each quadrant. If the there are fewer than three noisy pixels in the level2.evt file, extra rows are filled as -1
| Pixel properties | Quadrant properties | ||||||
|---|---|---|---|---|---|---|---|
| Quadrant | DetID | PixID | Counts | Sigma | Mean | Median | Sigma |
| A | 0 | 29 | 6818 | 11.44 | 1845 | 1733 | 444.5 |
| A | 7 | 110 | 5407 | 8.26 | 1845 | 1733 | 444.5 |
| A | 9 | 19 | 5394 | 8.24 | 1845 | 1733 | 444.5 |
| B | 2 | 9 | 5243 | 10.56 | 1725 | 1647 | 340.6 |
| B | 5 | 128 | 4382 | 8.03 | 1725 | 1647 | 340.6 |
| B | 3 | 80 | 4353 | 7.95 | 1725 | 1647 | 340.6 |
| C | 12 | 241 | 4717 | 6.73 | 1792 | 1677 | 451.4 |
| C | 3 | 126 | 4553 | 6.37 | 1792 | 1677 | 451.4 |
| C | 9 | 209 | 4548 | 6.36 | 1792 | 1677 | 451.4 |
| D | 15 | 46 | 4453 | 6.45 | 1702 | 1552 | 449.4 |
| D | 7 | 3 | 4196 | 5.88 | 1702 | 1552 | 449.4 |
| D | 10 | 189 | 4192 | 5.87 | 1702 | 1552 | 449.4 |
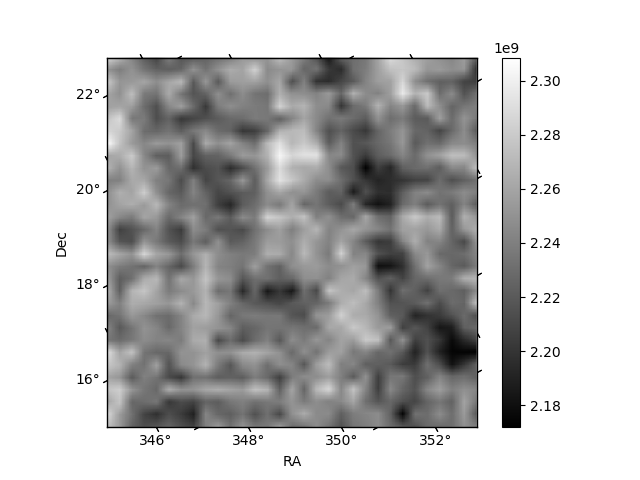
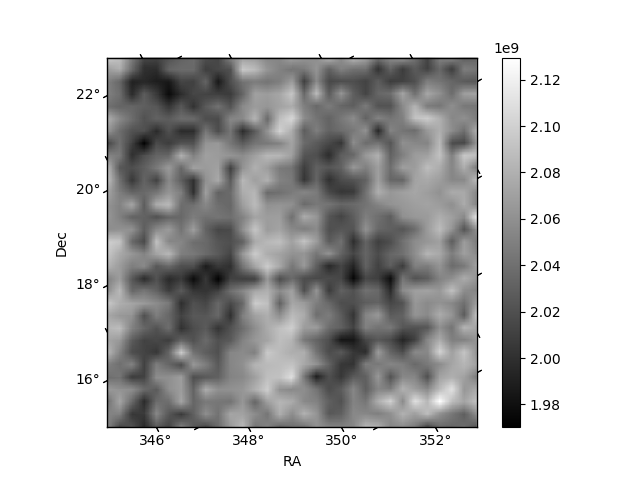
Histogram calculated using DETX and DETY for each event in the final _common_clean file
| Quadrant A |  |
 |
Quadrant B |
|---|---|---|---|
| Quadrant D | 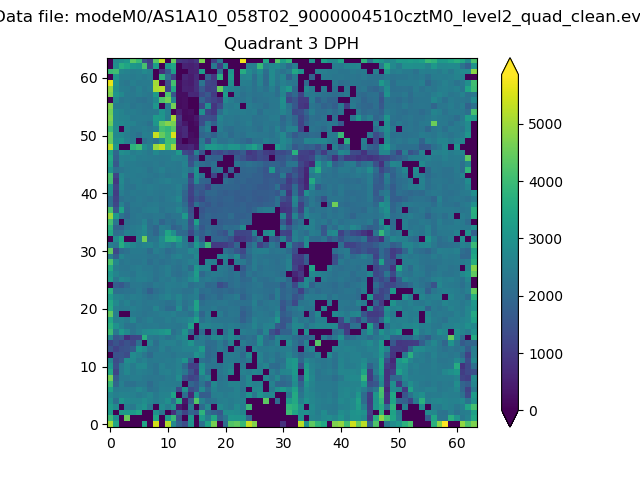 |
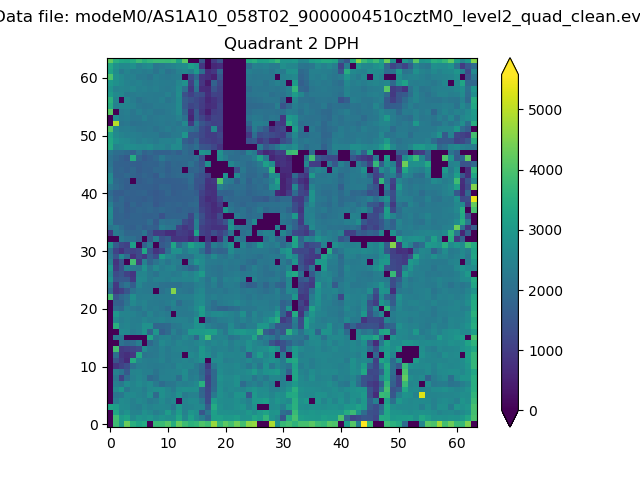 |
Quadrant C |
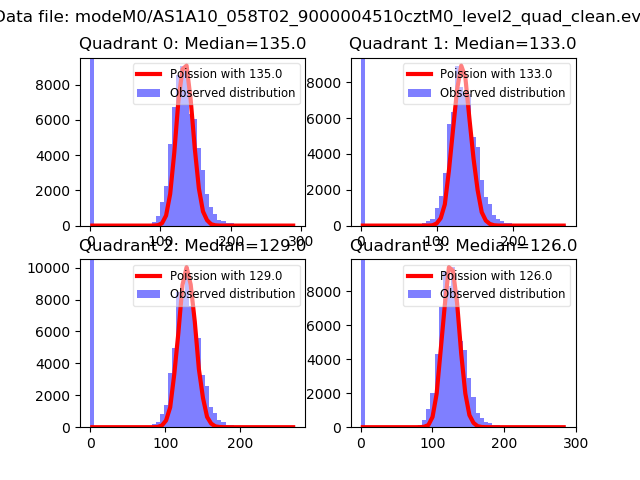
| Plot type | Count rate plots | Images |
|---|---|---|
| Comparison with Poisson distribution Blue bars denote a histogram of data divided into 1 sec bins. Red curve is a Poisson curve with rate = median count rate of data. |
 |
 |
| Quadrant-wise count rates Data is divided into 100 sec bins |
 |
|
| Module-wise count rates for Quadrant A Data is divided into 100 sec bins |
 |
 |
| Module-wise count rates for Quadrant B Data is divided into 100 sec bins |
 |
 |
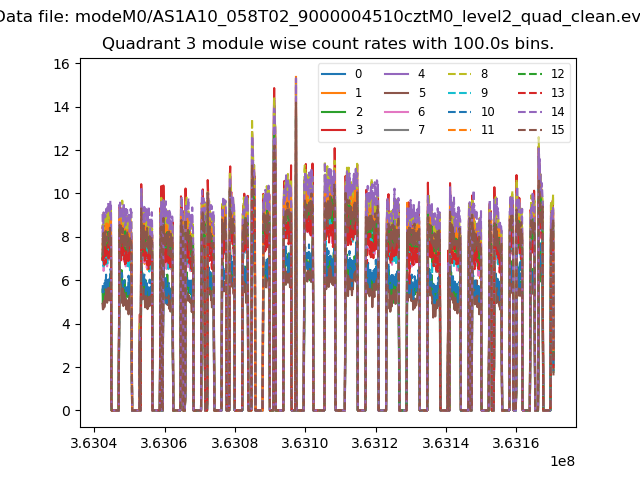
| Module-wise count rates for Quadrant C Data is divided into 100 sec bins |
 |
 |
| Module-wise count rates for Quadrant D Data is divided into 100 sec bins |
 |
 |
| Parameter | Plot |
|---|---|
| CZT HV Monitor |  |
| D_VDD |  |
| Temperature 1 |  |
| Veto HV Monitor | 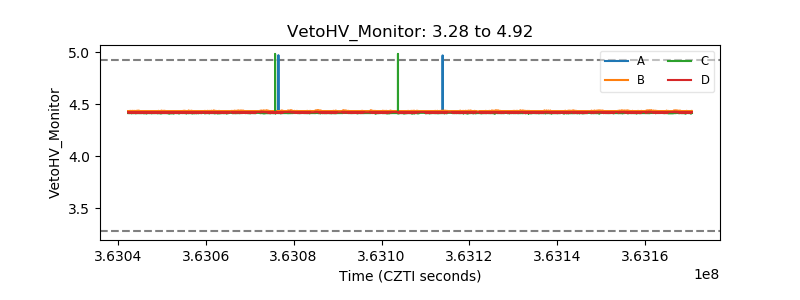 |
| Veto LLD |  |
| Alpha Counter |  |
| _CPM_Rate |  |
| CZT Counter |  |
| +2.5 Volts monitor |  |
| +5 Volts monitor | 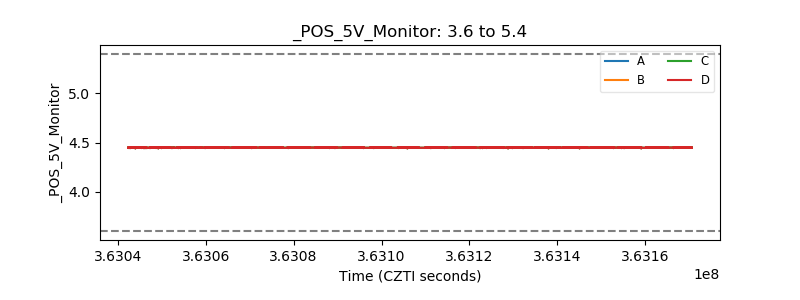 |
| _ROLL_ROT |  |
| _Roll_DEC |  |
| _Roll_RA |  |
| Veto Counter |  |