| Param | Original file | Final file |
|---|---|---|
| Filename | modeM0/AS1A10_058T02_9000004510_31170cztM0_level2.evt | modeM0/AS1A10_058T02_9000004510_31170cztM0_level2_quad_clean.evt |
| Size (bytes) | 675,371,520 | 104,598,720 |
| Size | 644.1 MB | 99.8 MB |
| Events in quadrant A | 3,752,379 | 674,904 |
| Events in quadrant B | 6,017,484 | 674,046 |
| Events in quadrant C | 3,868,040 | 648,484 |
| Events in quadrant D | 6,292,394 | 631,789 |
| Mode M0 | |||
|---|---|---|---|
| Quadrant | BADHDUFLAG | Total packets | Discarded packets |
| A | 0 | 16239 | 2 |
| B | 0 | 23690 | 2 |
| C | 0 | 16449 | 2 |
| D | 0 | 24222 | 2 |
| Mode SS | |||
|---|---|---|---|
| Quadrant | BADHDUFLAG | Total packets | Discarded packets |
| A | 0 | 160 | 0 |
| B | 0 | 160 | 0 |
| C | 0 | 160 | 0 |
| D | 0 | 160 | 0 |
| Mode M9 | |||
|---|---|---|---|
| Quadrant | BADHDUFLAG | Total packets | Discarded packets |
| A | 0 | 6 | 0 |
| B | 0 | 6 | 0 |
| C | 0 | 6 | 0 |
| D | 0 | 6 | 0 |
| Quadrant | Total seconds | Saturated seconds | Saturation percentage |
|---|---|---|---|
| A | 7740 | 67 | 0.865633% |
| B | 7741 | 237 | 3.061620% |
| C | 7740 | 193 | 2.493540% |
| D | 7740 | 162 | 2.093023% |
Noise dominated data is calculated using 1-second bins in cleaned event files. If a bin has >2000 counts, and if more than 50% of those come from <1% of pixels, then it is considered to be noise-dominated and hence unusable.
| Quadrant | # 1 sec bins | Bins with >0 counts | Bins with >2000 counts | High rate bins dominated by noise | Noise dominated (total time) | Noise dominated (detector-on time) | Marked lightcurve |
|---|---|---|---|---|---|---|---|
| A | 8420 | 7742 | 0 | 0 | 0.00% | 0.00% | 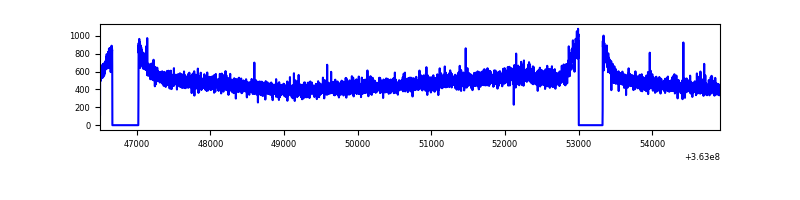 |
| B | 8421 | 7743 | 2 | 2 | 0.02% | 0.03% | 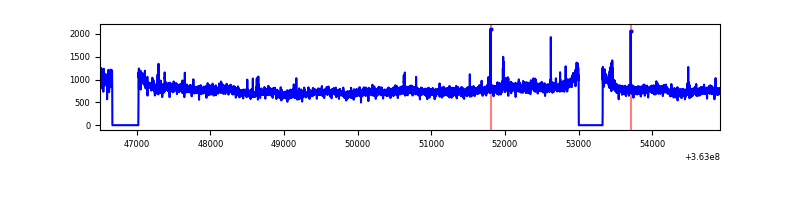 |
| C | 8420 | 7742 | 1 | 1 | 0.01% | 0.01% | 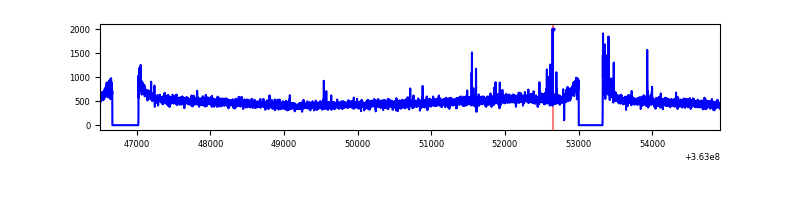 |
| D | 8420 | 7742 | 22 | 22 | 0.26% | 0.28% | 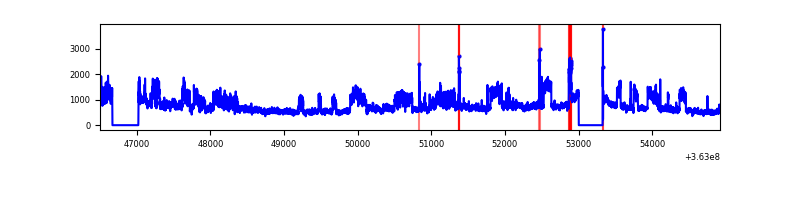 |
Top three noisy pixels from each quadrant. If the there are fewer than three noisy pixels in the level2.evt file, extra rows are filled as -1
| Pixel properties | Quadrant properties | ||||||
|---|---|---|---|---|---|---|---|
| Quadrant | DetID | PixID | Counts | Sigma | Mean | Median | Sigma |
| A | 13 | 254 | 12953 | 61.06 | 970 | 950 | 196.6 |
| A | 3 | 137 | 10182 | 46.96 | 970 | 950 | 196.6 |
| A | 0 | 226 | 7996 | 35.84 | 970 | 950 | 196.6 |
| B | 6 | 159 | 2153908 | 11570.46 | 961 | 936 | 186.1 |
| B | 0 | 190 | 55033 | 290.73 | 961 | 936 | 186.1 |
| B | 12 | 111 | 23638 | 122.0 | 961 | 936 | 186.1 |
| C | 14 | 238 | 150713 | 674.45 | 930 | 937 | 222.1 |
| C | 0 | 10 | 48347 | 213.49 | 930 | 937 | 222.1 |
| C | 2 | 114 | 17810 | 75.98 | 930 | 937 | 222.1 |
| D | 8 | 195 | 2402175 | 9940.7 | 925 | 906 | 241.6 |
| D | 12 | 79 | 232202 | 957.51 | 925 | 906 | 241.6 |
| D | 2 | 250 | 36166 | 145.97 | 925 | 906 | 241.6 |
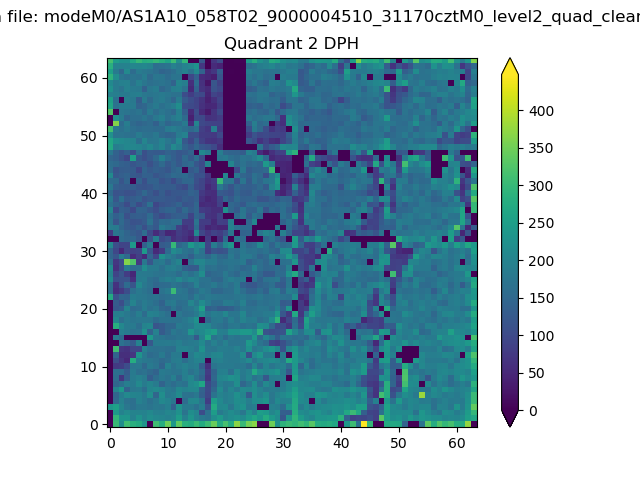
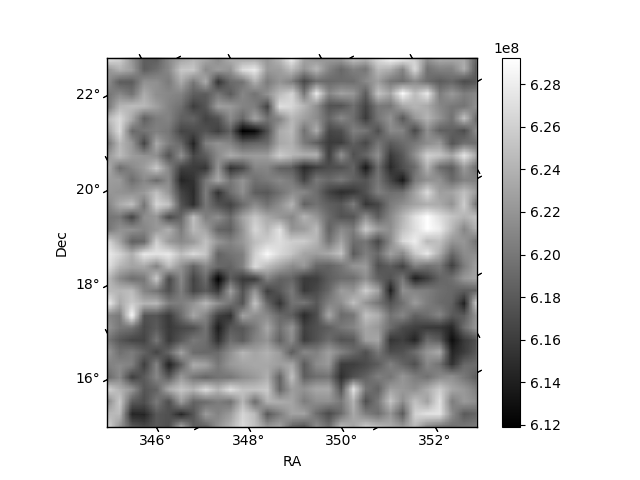
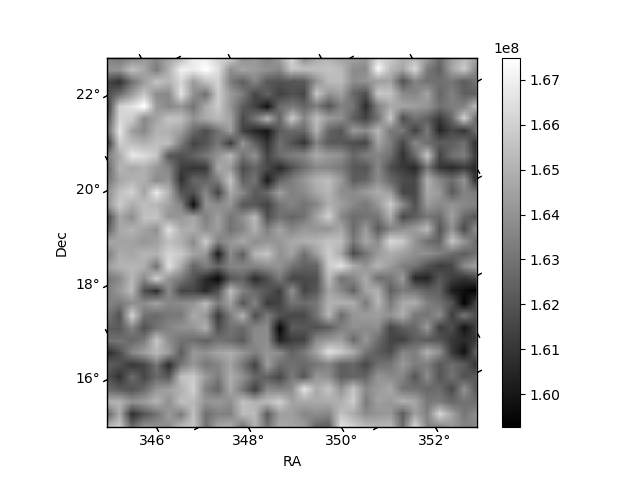
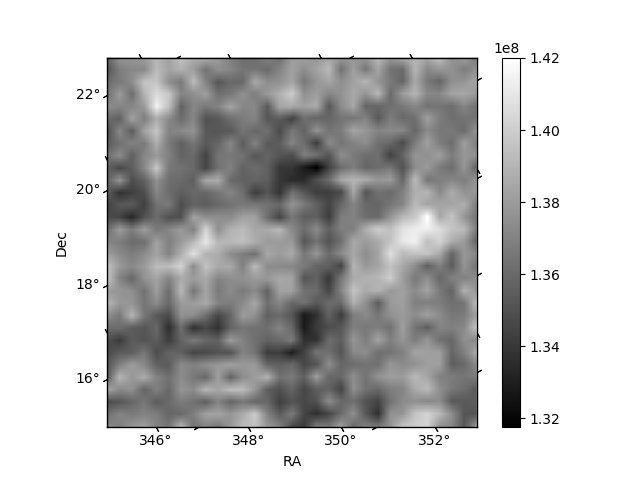
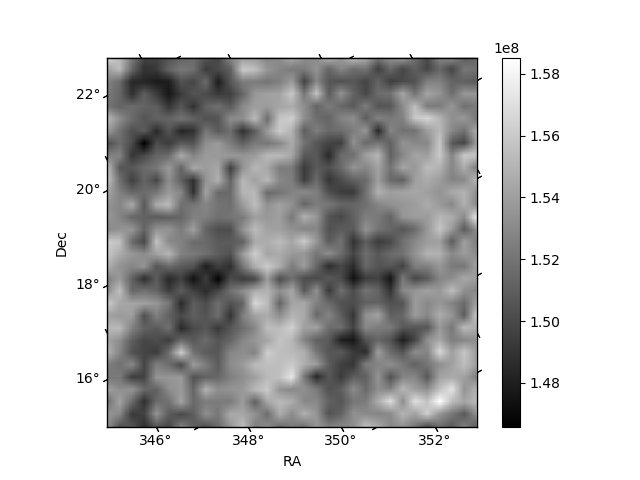
Histogram calculated using DETX and DETY for each event in the final _common_clean file
| Quadrant A | 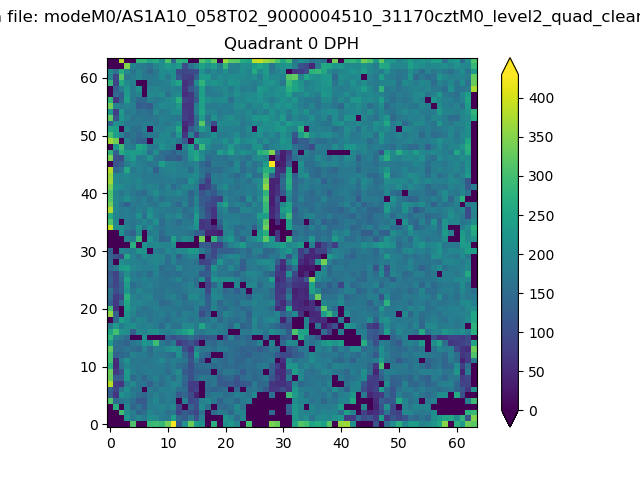 |
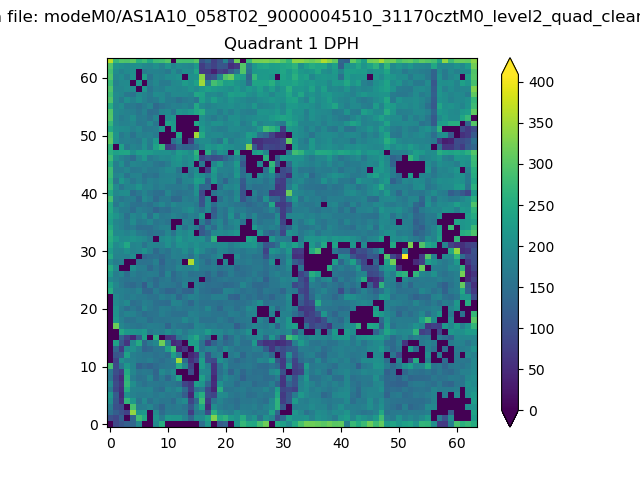 |
Quadrant B |
|---|---|---|---|
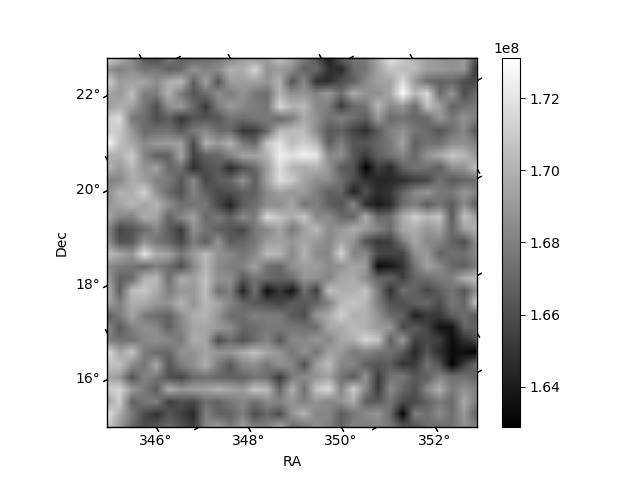
| Quadrant D | 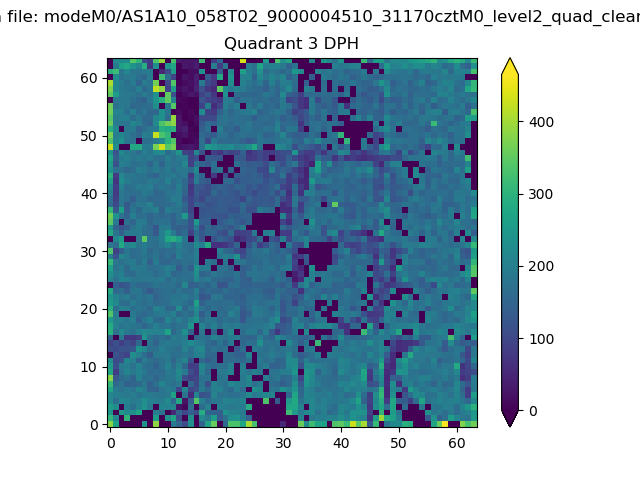 |
 |
Quadrant C |
| Plot type | Count rate plots | Images |
|---|---|---|
| Comparison with Poisson distribution Blue bars denote a histogram of data divided into 1 sec bins. Red curve is a Poisson curve with rate = median count rate of data. |
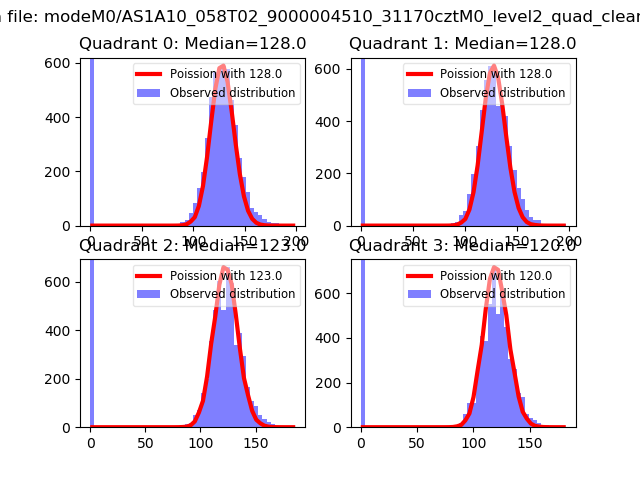 |
 |
| Quadrant-wise count rates Data is divided into 100 sec bins |
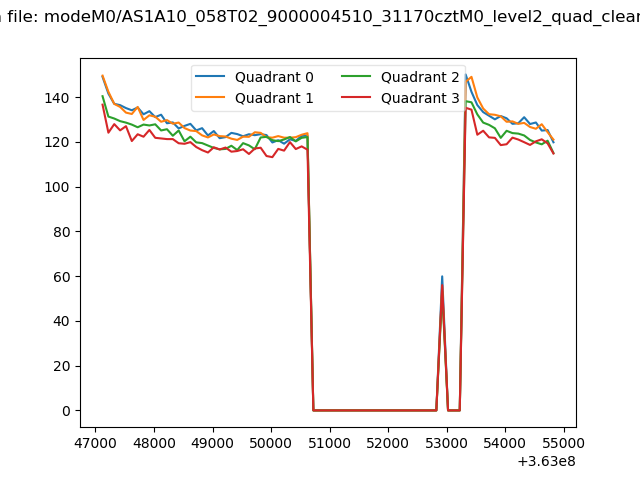 |
|
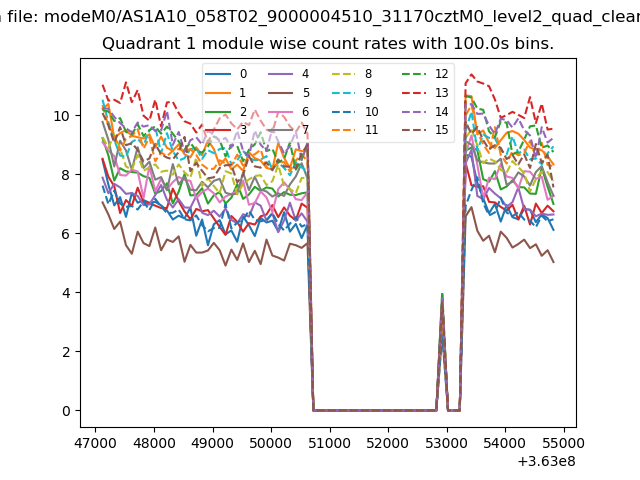
| Module-wise count rates for Quadrant A Data is divided into 100 sec bins |
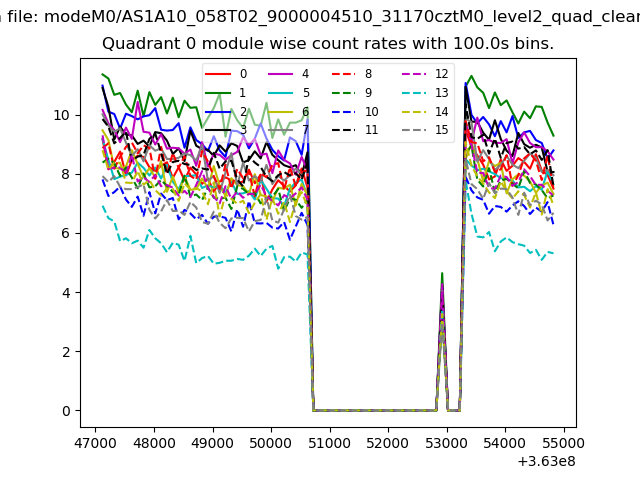 |
 |
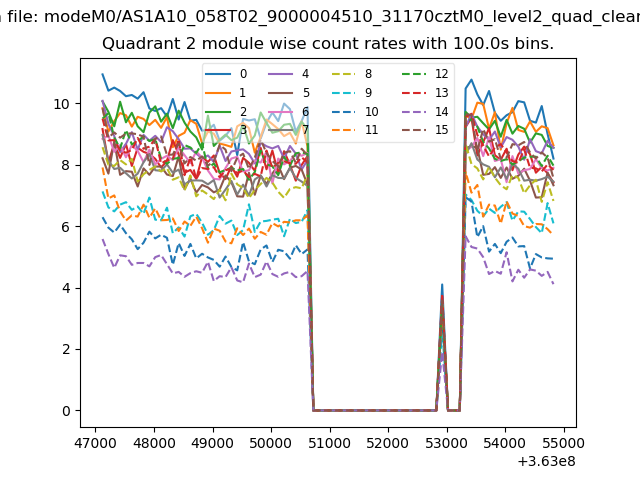
| Module-wise count rates for Quadrant B Data is divided into 100 sec bins |
 |
 |
| Module-wise count rates for Quadrant C Data is divided into 100 sec bins |
 |
 |
| Module-wise count rates for Quadrant D Data is divided into 100 sec bins |
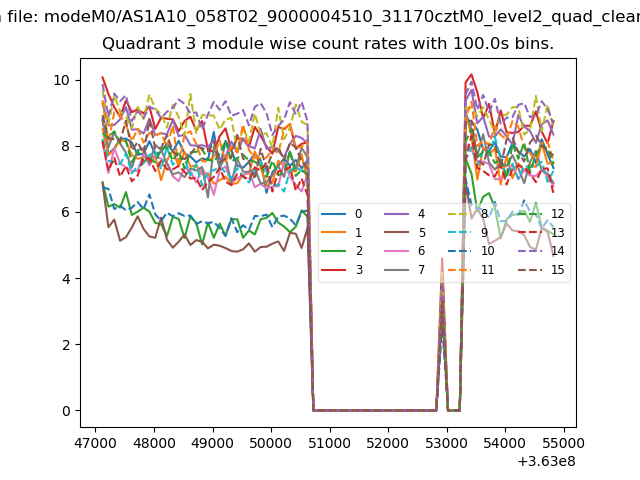 |
 |
| Parameter | Plot |
|---|---|
| CZT HV Monitor | 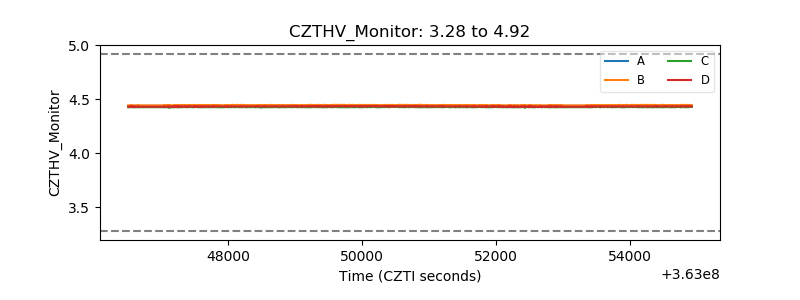 |
| D_VDD | 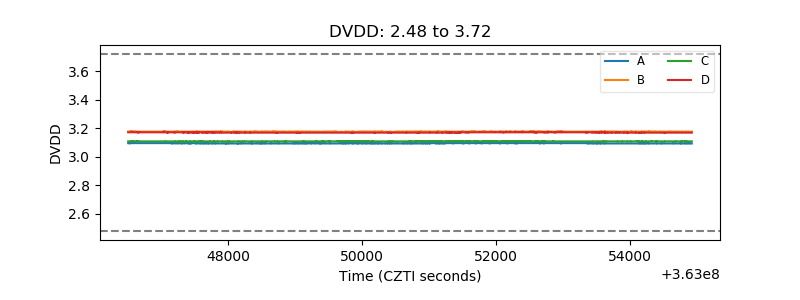 |
| Temperature 1 | 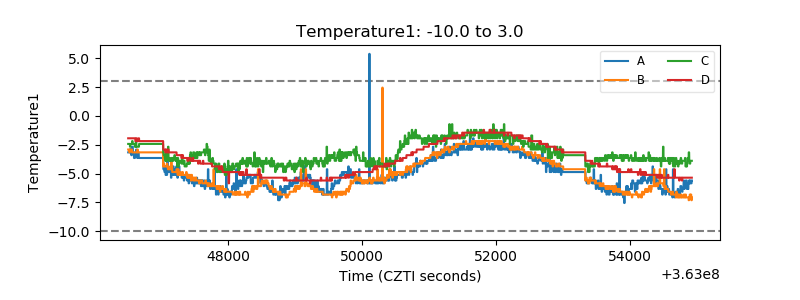 |
| Veto HV Monitor | 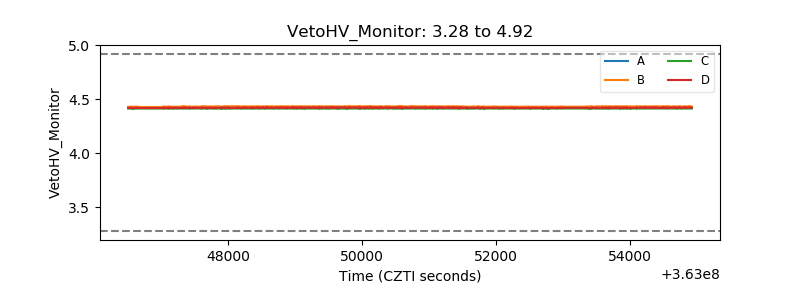 |
| Veto LLD | 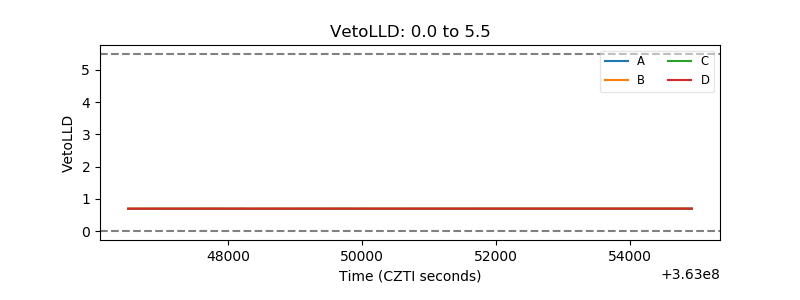 |
| Alpha Counter | 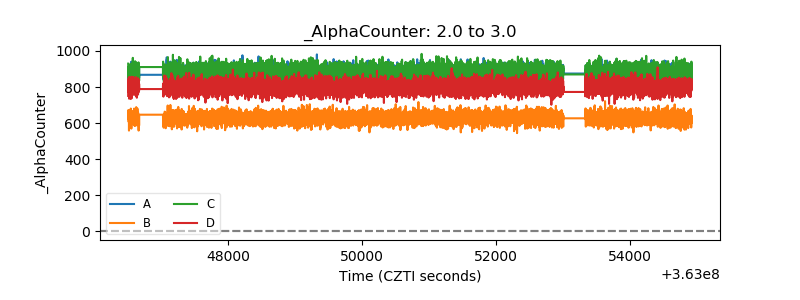 |
| _CPM_Rate | 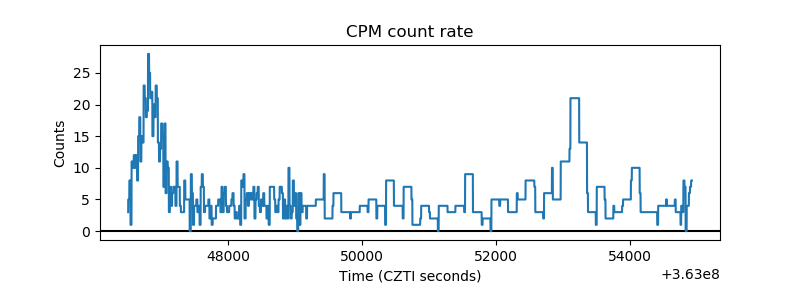 |
| CZT Counter | 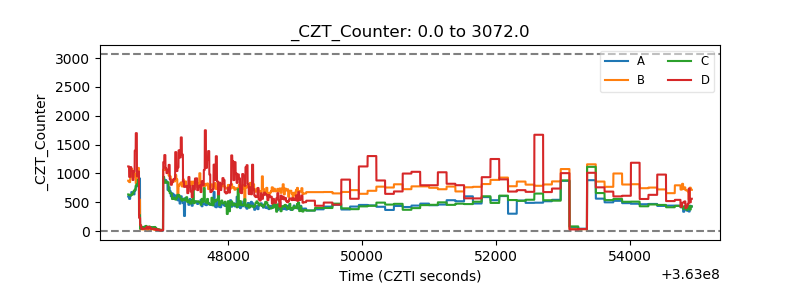 |
| +2.5 Volts monitor |  |
| +5 Volts monitor |  |
| _ROLL_ROT | 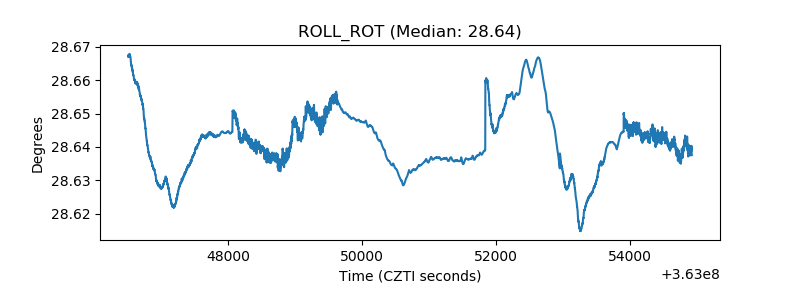 |
| _Roll_DEC | 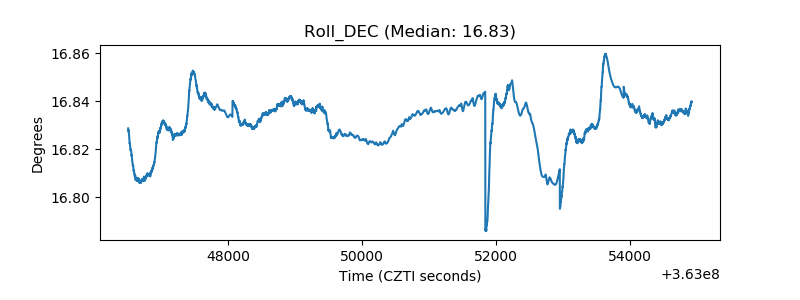 |
| _Roll_RA | 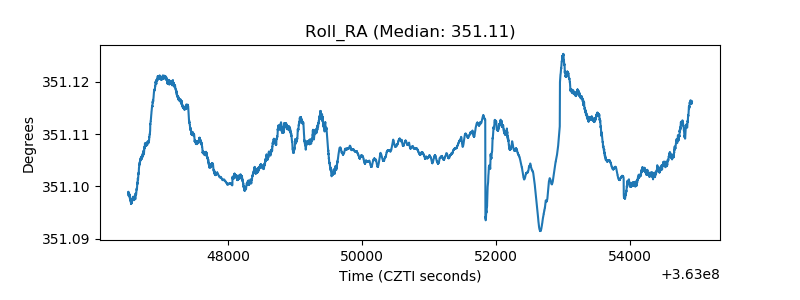 |
| Veto Counter | 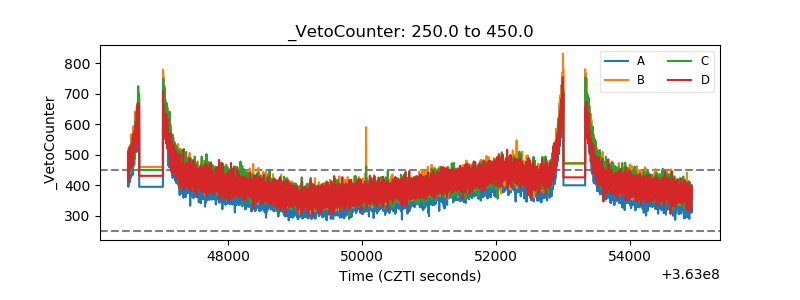 |