| Param | Original file | Final file |
|---|---|---|
| Filename | modeM0/AS1A10_058T02_9000004510_31173cztM0_level2.evt | modeM0/AS1A10_058T02_9000004510_31173cztM0_level2_quad_clean.evt |
| Size (bytes) | 1,648,091,520 | 242,648,640 |
| Size | 1.5 GB | 231.4 MB |
| Events in quadrant A | 9,225,496 | 1,542,261 |
| Events in quadrant B | 14,892,677 | 1,536,852 |
| Events in quadrant C | 9,789,394 | 1,477,512 |
| Events in quadrant D | 14,699,627 | 1,456,961 |
| Mode M0 | |||
|---|---|---|---|
| Quadrant | BADHDUFLAG | Total packets | Discarded packets |
| A | 0 | 40104 | 4 |
| B | 0 | 59324 | 4 |
| C | 0 | 41484 | 4 |
| D | 0 | 57488 | 4 |
| Mode SS | |||
|---|---|---|---|
| Quadrant | BADHDUFLAG | Total packets | Discarded packets |
| A | 0 | 394 | 0 |
| B | 0 | 394 | 0 |
| C | 0 | 394 | 0 |
| D | 0 | 394 | 0 |
| Mode M9 | |||
|---|---|---|---|
| Quadrant | BADHDUFLAG | Total packets | Discarded packets |
| A | 0 | 22 | 0 |
| B | 0 | 22 | 0 |
| C | 0 | 22 | 0 |
| D | 0 | 22 | 0 |
| Quadrant | Total seconds | Saturated seconds | Saturation percentage |
|---|---|---|---|
| A | 19393 | 175 | 0.902387% |
| B | 19393 | 485 | 2.500902% |
| C | 19393 | 475 | 2.449337% |
| D | 19394 | 331 | 1.706713% |
Noise dominated data is calculated using 1-second bins in cleaned event files. If a bin has >2000 counts, and if more than 50% of those come from <1% of pixels, then it is considered to be noise-dominated and hence unusable.
| Quadrant | # 1 sec bins | Bins with >0 counts | Bins with >2000 counts | High rate bins dominated by noise | Noise dominated (total time) | Noise dominated (detector-on time) | Marked lightcurve |
|---|---|---|---|---|---|---|---|
| A | 21483 | 19397 | 0 | 0 | 0.00% | 0.00% | 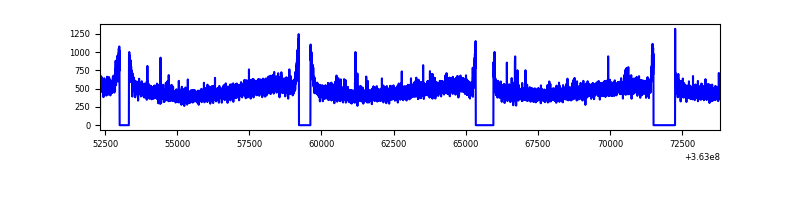 |
| B | 21483 | 19397 | 35 | 35 | 0.16% | 0.18% | 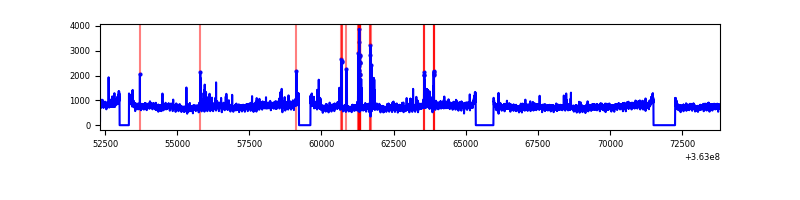 |
| C | 21483 | 19397 | 22 | 22 | 0.10% | 0.11% | 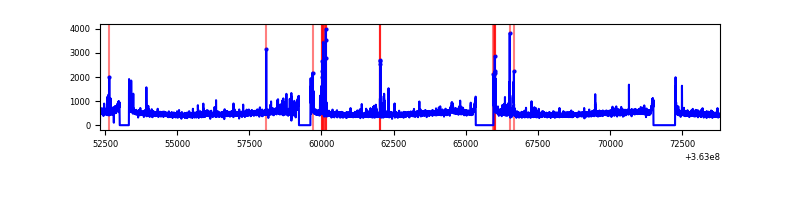 |
| D | 21484 | 19398 | 60 | 60 | 0.28% | 0.31% | 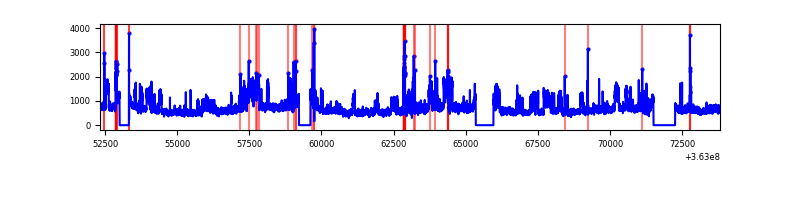 |
Top three noisy pixels from each quadrant. If the there are fewer than three noisy pixels in the level2.evt file, extra rows are filled as -1
| Pixel properties | Quadrant properties | ||||||
|---|---|---|---|---|---|---|---|
| Quadrant | DetID | PixID | Counts | Sigma | Mean | Median | Sigma |
| A | 13 | 254 | 29575 | 56.75 | 2387 | 2338 | 479.9 |
| A | 3 | 137 | 25178 | 47.59 | 2387 | 2338 | 479.9 |
| A | 0 | 226 | 19802 | 36.39 | 2387 | 2338 | 479.9 |
| B | 6 | 159 | 5260744 | 11563.13 | 2355 | 2294 | 454.8 |
| B | 4 | 80 | 234162 | 509.87 | 2355 | 2294 | 454.8 |
| B | 12 | 111 | 57668 | 121.77 | 2355 | 2294 | 454.8 |
| C | 14 | 238 | 383452 | 709.77 | 2274 | 2290 | 537.0 |
| C | 0 | 10 | 181643 | 333.98 | 2274 | 2290 | 537.0 |
| C | 10 | 22 | 146230 | 268.03 | 2274 | 2290 | 537.0 |
| D | 8 | 195 | 5644971 | 9453.75 | 2277 | 2234 | 596.9 |
| D | 12 | 233 | 167668 | 277.17 | 2277 | 2234 | 596.9 |
| D | 2 | 250 | 103729 | 170.04 | 2277 | 2234 | 596.9 |
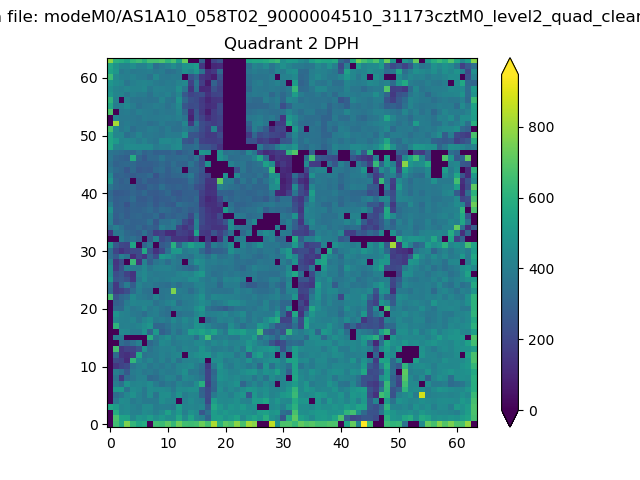
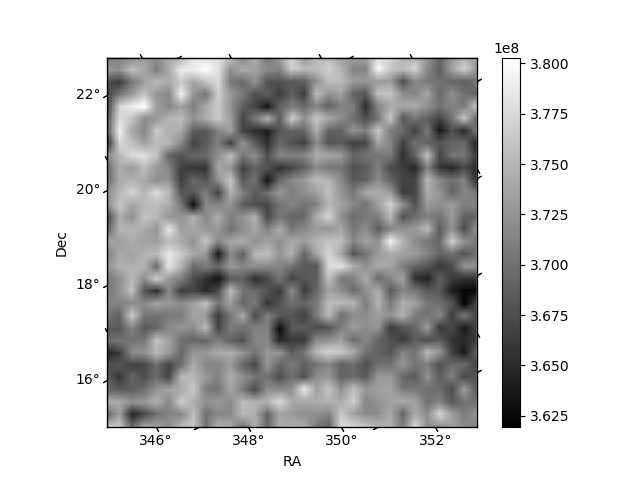
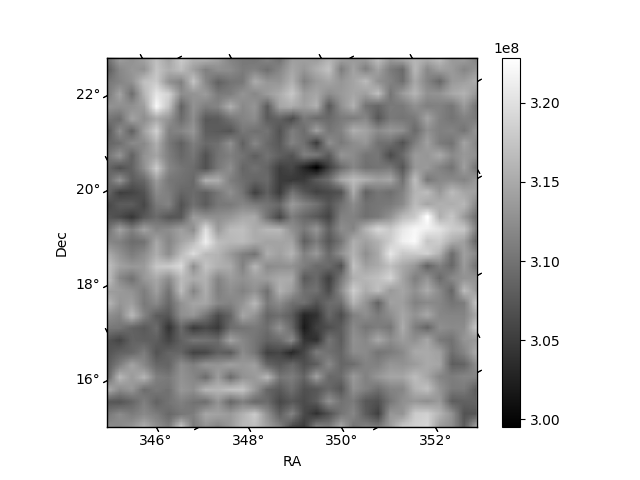
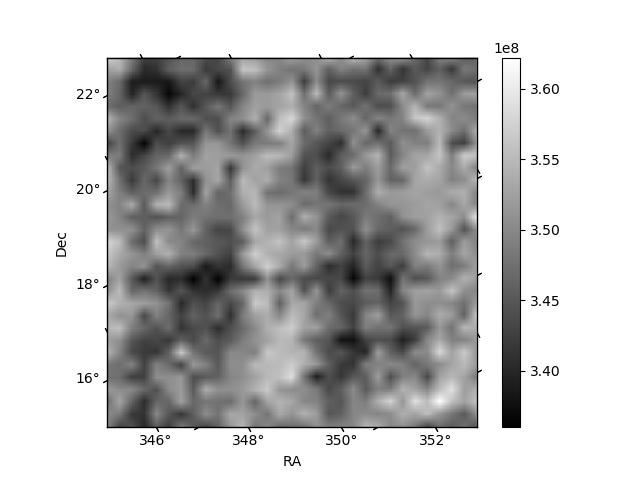
Histogram calculated using DETX and DETY for each event in the final _common_clean file
| Quadrant A | 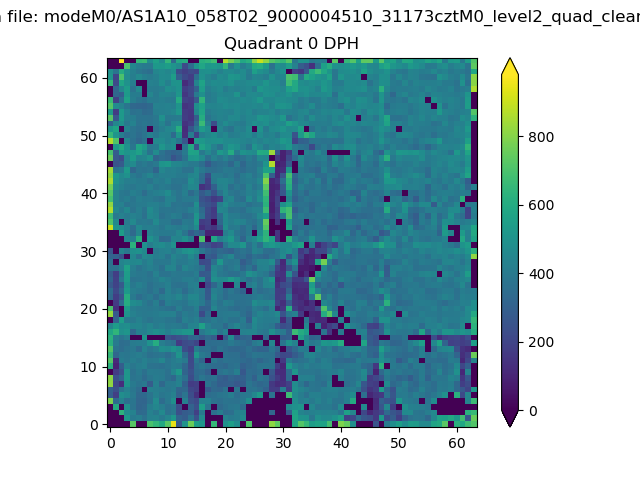 |
 |
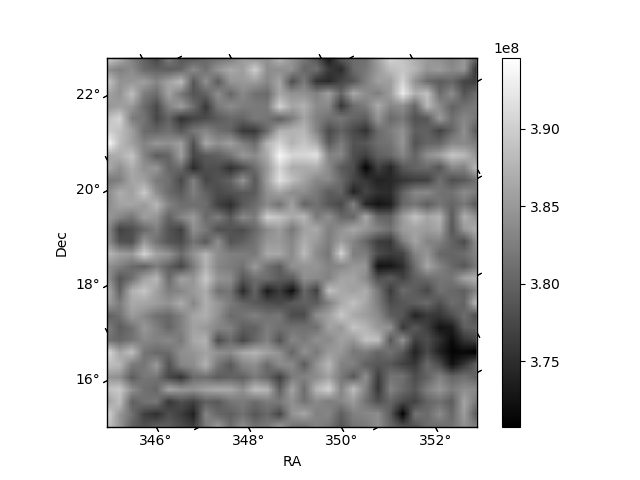
Quadrant B |
|---|---|---|---|
| Quadrant D |  |
 |
Quadrant C |
| Plot type | Count rate plots | Images |
|---|---|---|
| Comparison with Poisson distribution Blue bars denote a histogram of data divided into 1 sec bins. Red curve is a Poisson curve with rate = median count rate of data. |
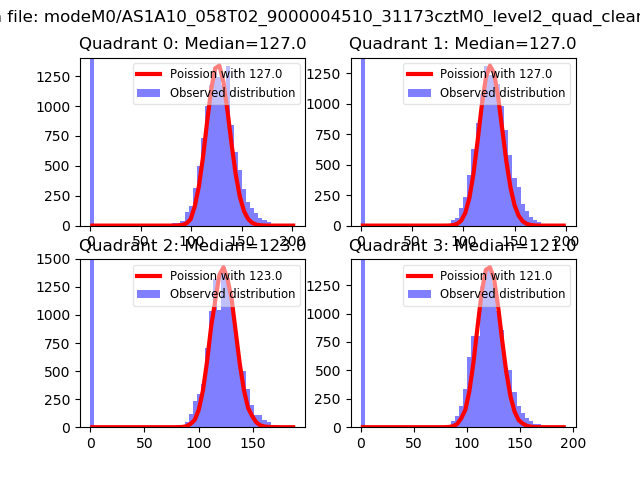 |
 |
| Quadrant-wise count rates Data is divided into 100 sec bins |
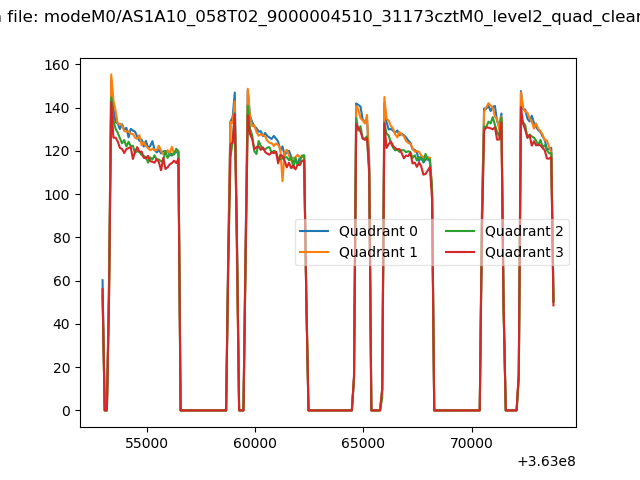 |
|
| Module-wise count rates for Quadrant A Data is divided into 100 sec bins |
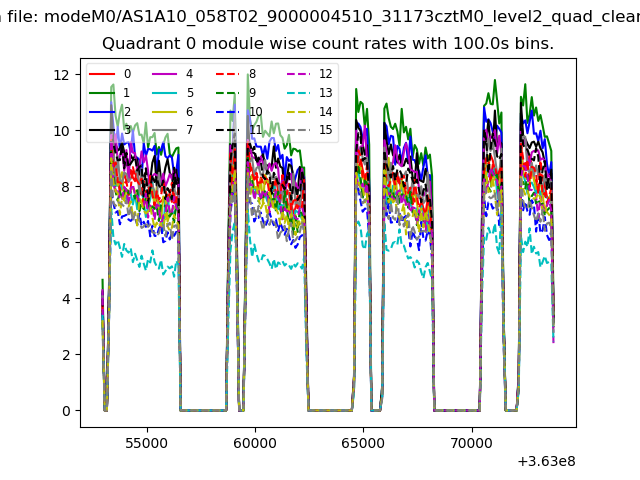 |
 |
| Module-wise count rates for Quadrant B Data is divided into 100 sec bins |
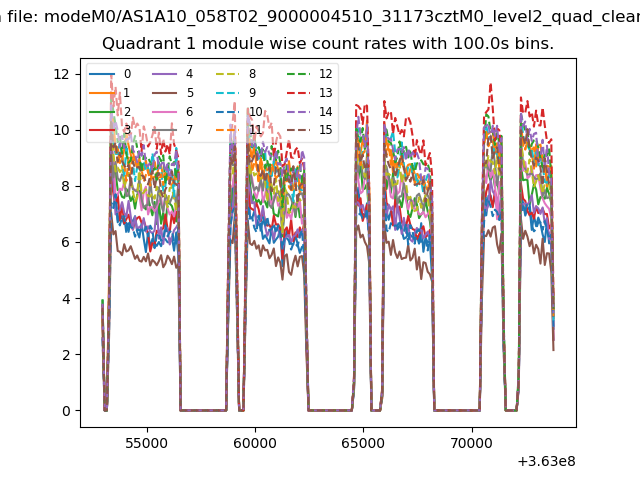 |
 |
| Module-wise count rates for Quadrant C Data is divided into 100 sec bins |
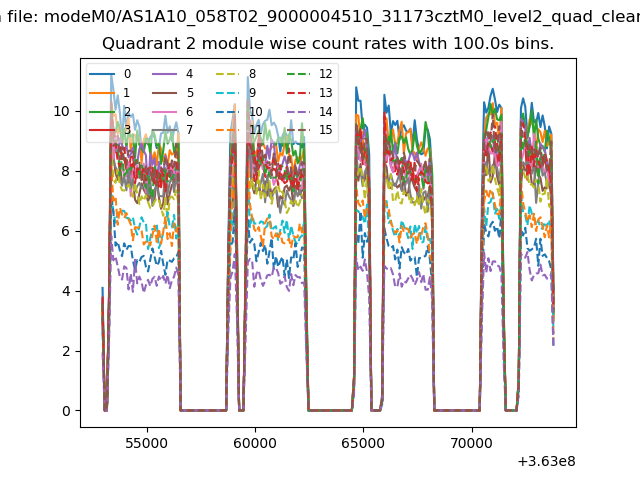 |
 |
| Module-wise count rates for Quadrant D Data is divided into 100 sec bins |
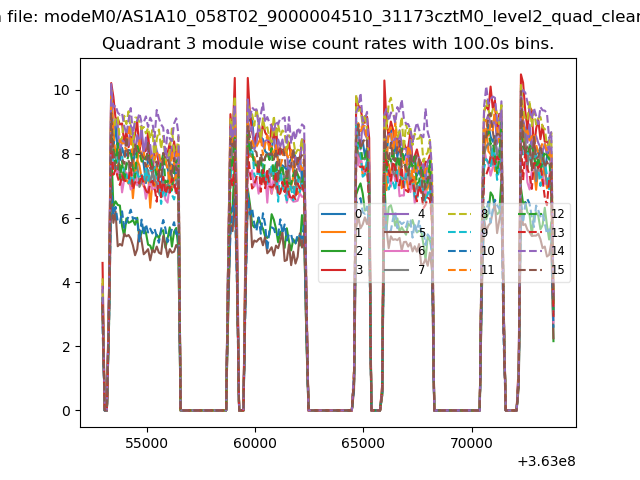 |
 |
| Parameter | Plot |
|---|---|
| CZT HV Monitor | 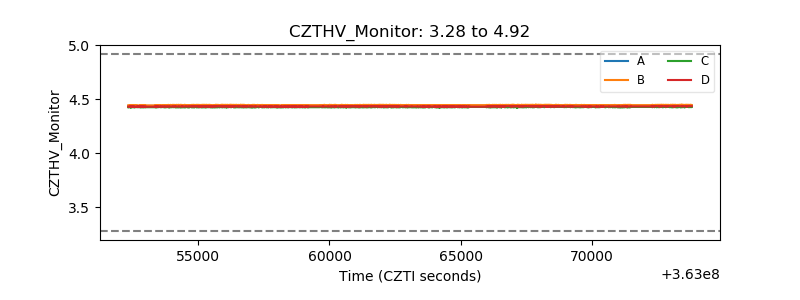 |
| D_VDD |  |
| Temperature 1 | 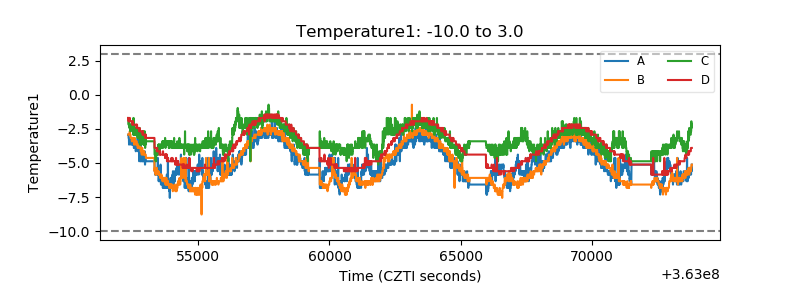 |
| Veto HV Monitor |  |
| Veto LLD |  |
| Alpha Counter | 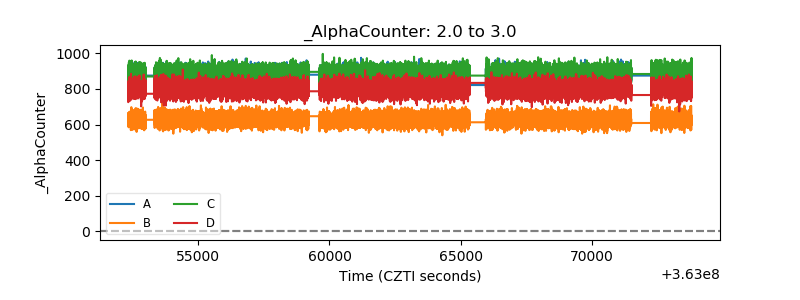 |
| _CPM_Rate | 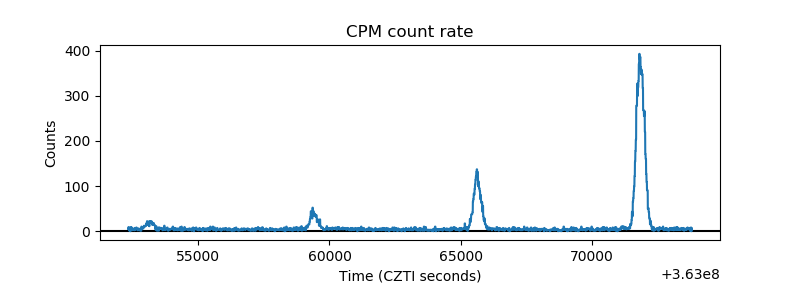 |
| CZT Counter |  |
| +2.5 Volts monitor |  |
| +5 Volts monitor | 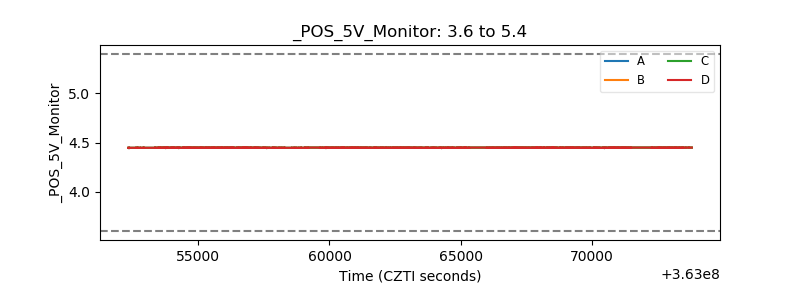 |
| _ROLL_ROT | 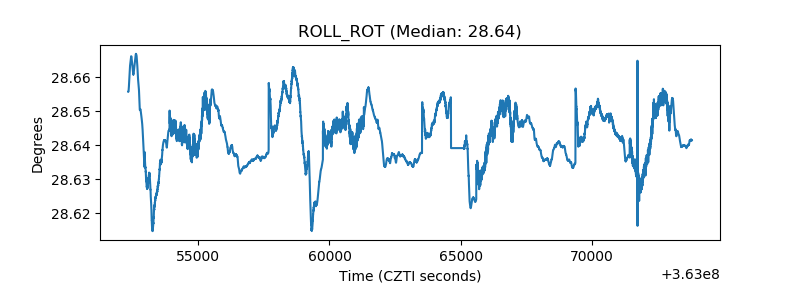 |
| _Roll_DEC | 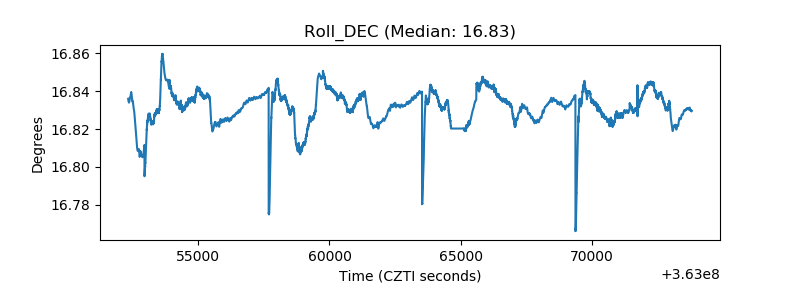 |
| _Roll_RA |  |
| Veto Counter | 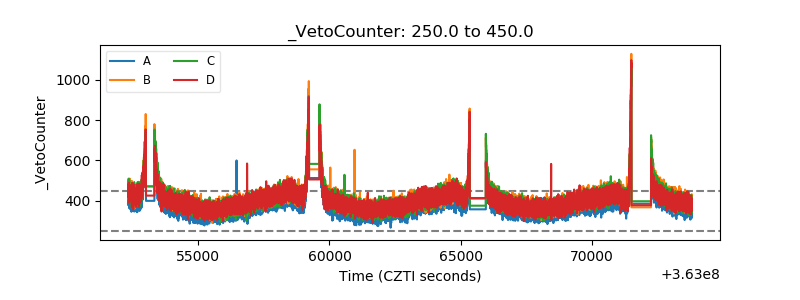 |