| Param | Original file | Final file |
|---|---|---|
| Filename | modeM0/AS1A10_058T02_9000004510_31176cztM0_level2.evt | modeM0/AS1A10_058T02_9000004510_31176cztM0_level2_quad_clean.evt |
| Size (bytes) | 584,792,640 | 86,713,920 |
| Size | 557.7 MB | 82.7 MB |
| Events in quadrant A | 3,244,749 | 561,176 |
| Events in quadrant B | 5,090,753 | 558,030 |
| Events in quadrant C | 3,416,852 | 529,897 |
| Events in quadrant D | 5,515,950 | 520,595 |
| Mode M0 | |||
|---|---|---|---|
| Quadrant | BADHDUFLAG | Total packets | Discarded packets |
| A | 0 | 13495 | 1 |
| B | 0 | 19899 | 1 |
| C | 0 | 14037 | 2 |
| D | 0 | 21641 | 1 |
| Mode SS | |||
|---|---|---|---|
| Quadrant | BADHDUFLAG | Total packets | Discarded packets |
| A | 0 | 134 | 0 |
| B | 0 | 134 | 0 |
| C | 0 | 134 | 0 |
| D | 0 | 134 | 0 |
| Mode M9 | |||
|---|---|---|---|
| Quadrant | BADHDUFLAG | Total packets | Discarded packets |
| A | 0 | 10 | 0 |
| B | 0 | 10 | 0 |
| C | 0 | 10 | 0 |
| D | 0 | 10 | 0 |
| Quadrant | Total seconds | Saturated seconds | Saturation percentage |
|---|---|---|---|
| A | 6536 | 56 | 0.856793% |
| B | 6537 | 108 | 1.652134% |
| C | 6536 | 124 | 1.897185% |
| D | 6536 | 90 | 1.376989% |
Noise dominated data is calculated using 1-second bins in cleaned event files. If a bin has >2000 counts, and if more than 50% of those come from <1% of pixels, then it is considered to be noise-dominated and hence unusable.
| Quadrant | # 1 sec bins | Bins with >0 counts | Bins with >2000 counts | High rate bins dominated by noise | Noise dominated (total time) | Noise dominated (detector-on time) | Marked lightcurve |
|---|---|---|---|---|---|---|---|
| A | 7586 | 6537 | 0 | 0 | 0.00% | 0.00% | 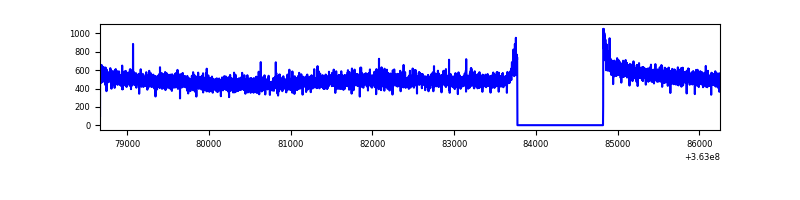 |
| B | 7587 | 6538 | 4 | 4 | 0.05% | 0.06% | 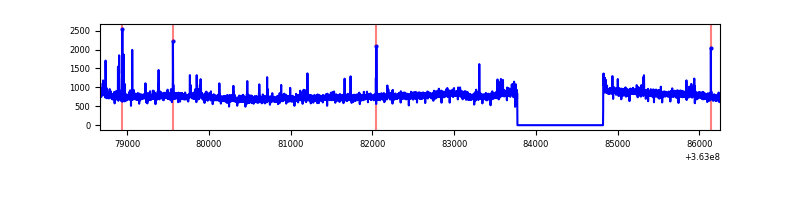 |
| C | 7586 | 6537 | 22 | 22 | 0.29% | 0.34% | 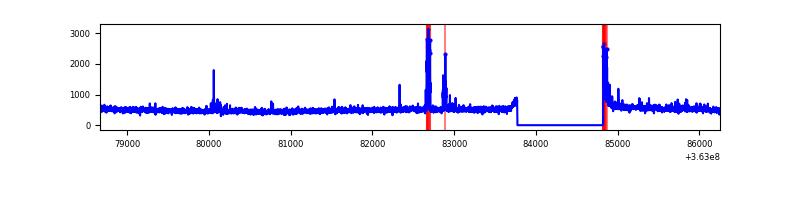 |
| D | 7586 | 6537 | 42 | 42 | 0.55% | 0.64% | 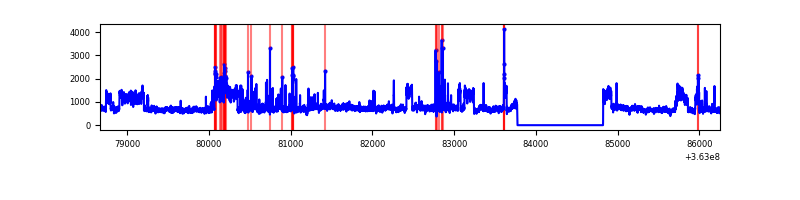 |
Top three noisy pixels from each quadrant. If the there are fewer than three noisy pixels in the level2.evt file, extra rows are filled as -1
| Pixel properties | Quadrant properties | ||||||
|---|---|---|---|---|---|---|---|
| Quadrant | DetID | PixID | Counts | Sigma | Mean | Median | Sigma |
| A | 13 | 254 | 10110 | 55.37 | 841 | 826 | 167.7 |
| A | 3 | 137 | 8277 | 44.44 | 841 | 826 | 167.7 |
| A | 0 | 226 | 6975 | 36.67 | 841 | 826 | 167.7 |
| B | 6 | 159 | 1751813 | 11035.38 | 821 | 800 | 158.7 |
| B | 4 | 80 | 49253 | 305.36 | 821 | 800 | 158.7 |
| B | 0 | 190 | 44206 | 273.56 | 821 | 800 | 158.7 |
| C | 14 | 238 | 131930 | 707.0 | 789 | 793 | 185.5 |
| C | 10 | 22 | 108907 | 582.87 | 789 | 793 | 185.5 |
| C | 0 | 10 | 71414 | 380.74 | 789 | 793 | 185.5 |
| D | 8 | 195 | 2174007 | 11431.91 | 803 | 782 | 190.1 |
| D | 12 | 233 | 183916 | 963.35 | 803 | 782 | 190.1 |
| D | 2 | 250 | 79410 | 413.61 | 803 | 782 | 190.1 |
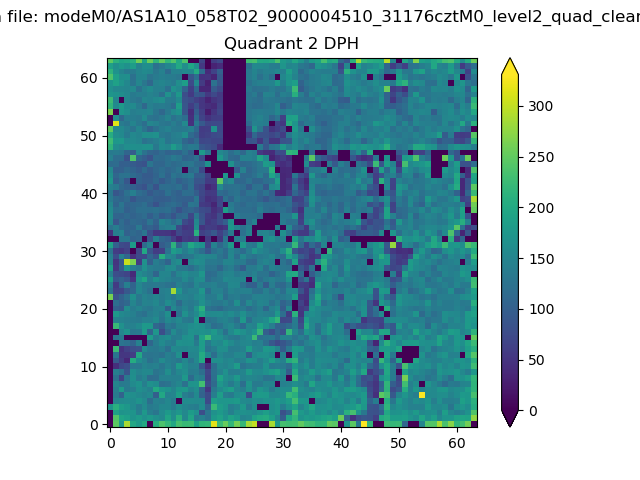
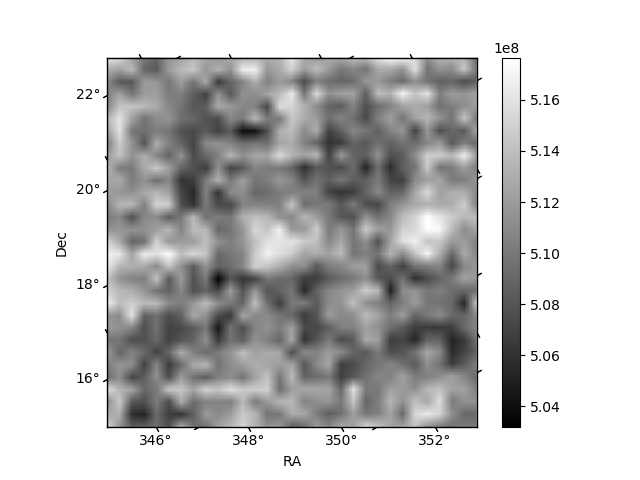
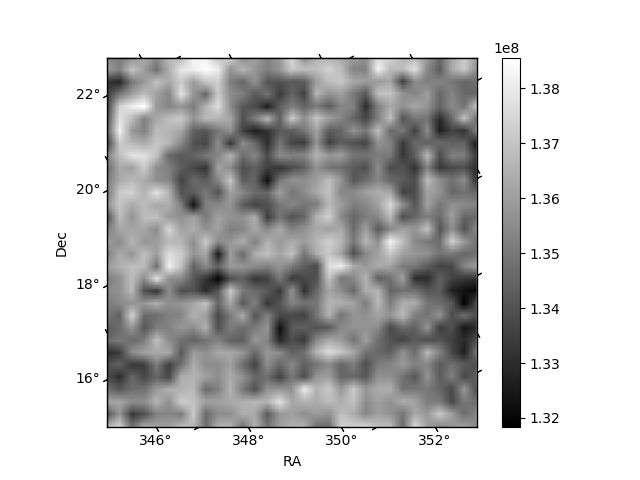
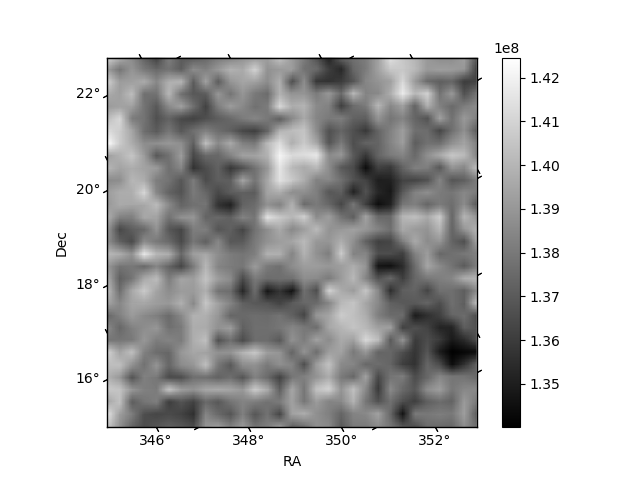
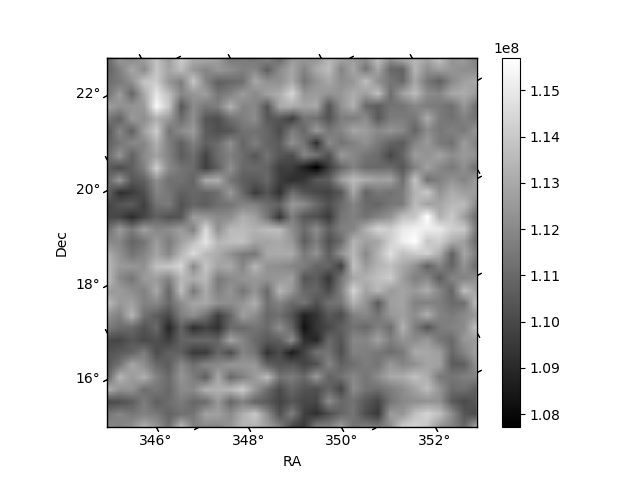
Histogram calculated using DETX and DETY for each event in the final _common_clean file
| Quadrant A | 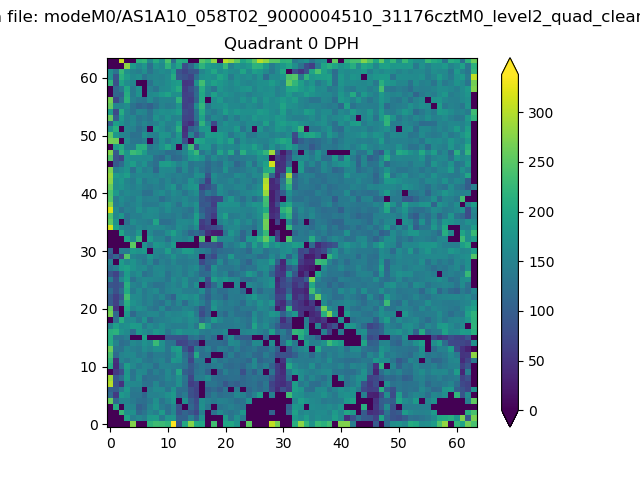 |
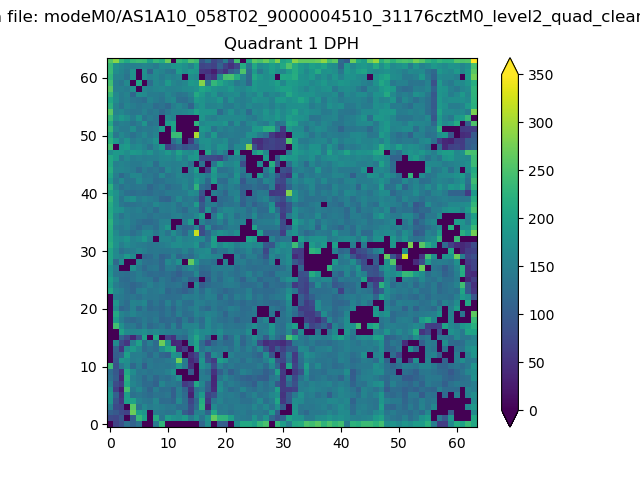 |
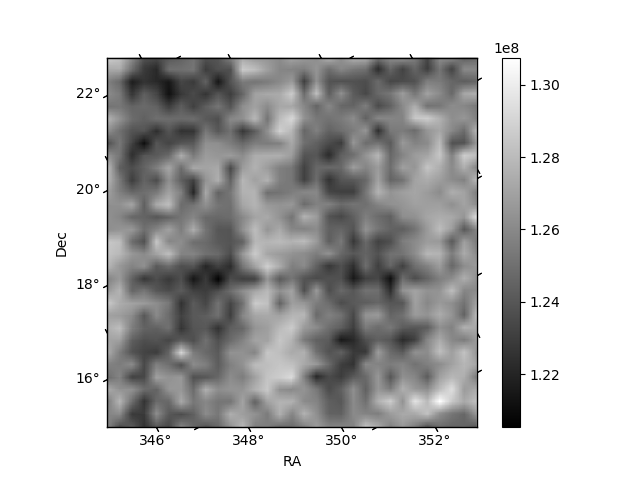
Quadrant B |
|---|---|---|---|
| Quadrant D | 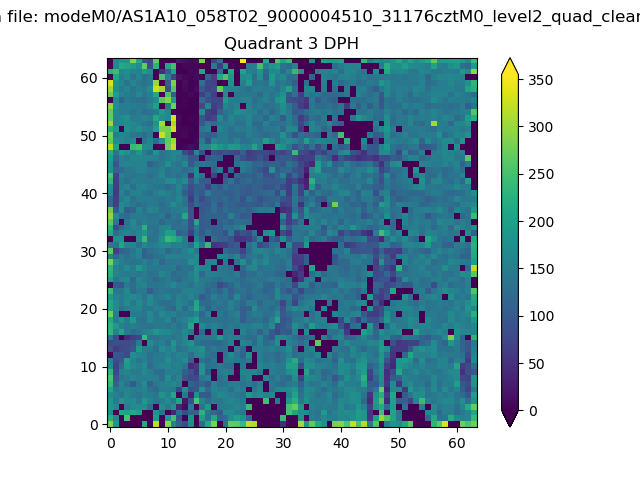 |
 |
Quadrant C |
| Plot type | Count rate plots | Images |
|---|---|---|
| Comparison with Poisson distribution Blue bars denote a histogram of data divided into 1 sec bins. Red curve is a Poisson curve with rate = median count rate of data. |
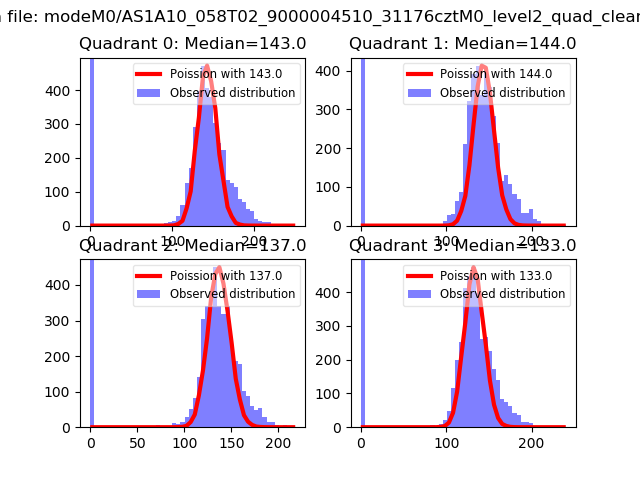 |
 |
| Quadrant-wise count rates Data is divided into 100 sec bins |
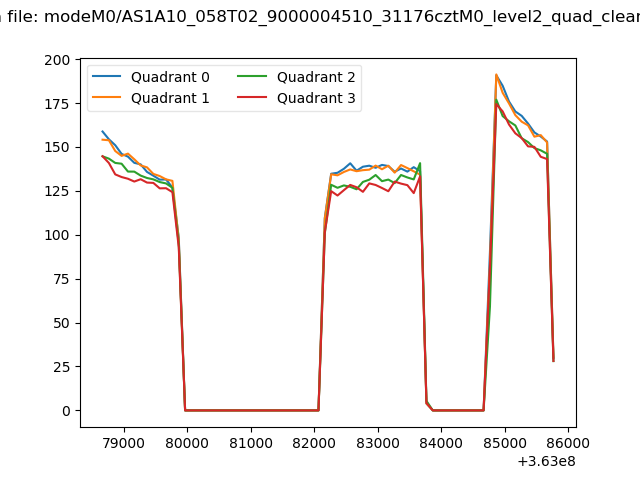 |
|
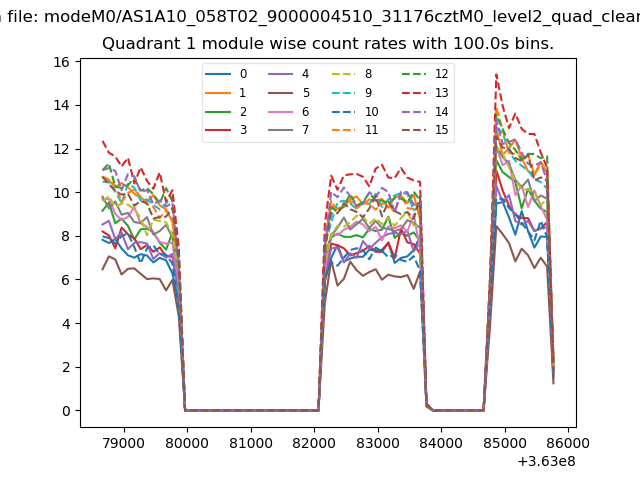
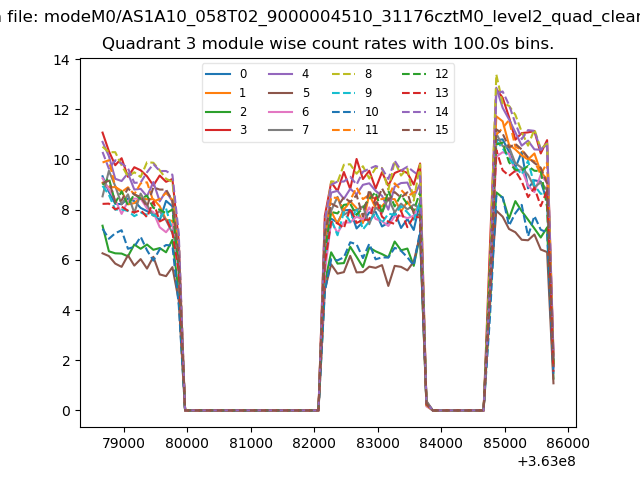
| Module-wise count rates for Quadrant A Data is divided into 100 sec bins |
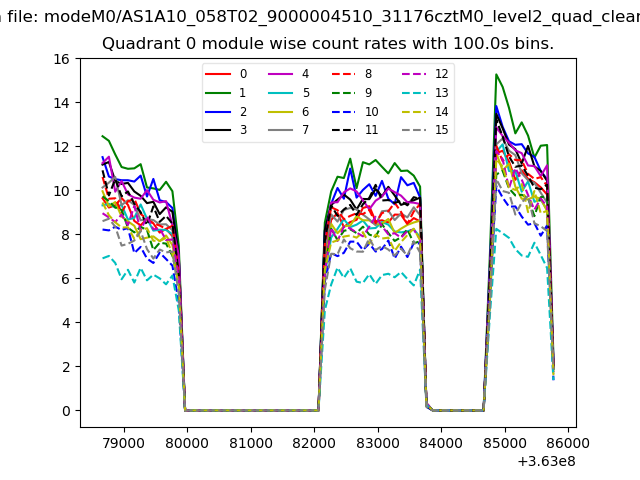 |
 |
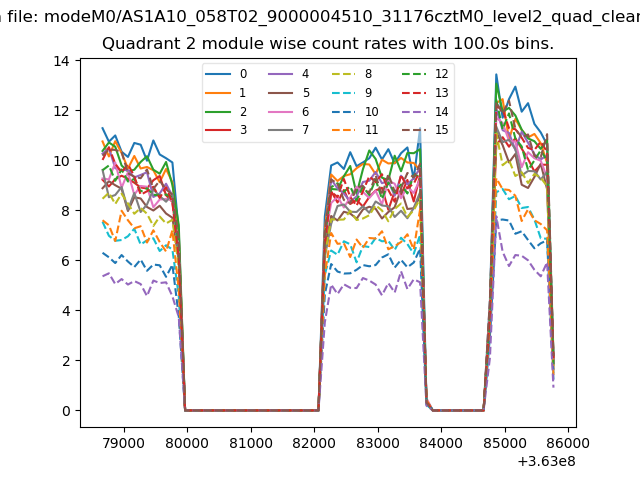
| Module-wise count rates for Quadrant B Data is divided into 100 sec bins |
 |
 |
| Module-wise count rates for Quadrant C Data is divided into 100 sec bins |
 |
 |
| Module-wise count rates for Quadrant D Data is divided into 100 sec bins |
 |
 |
| Parameter | Plot |
|---|---|
| CZT HV Monitor | 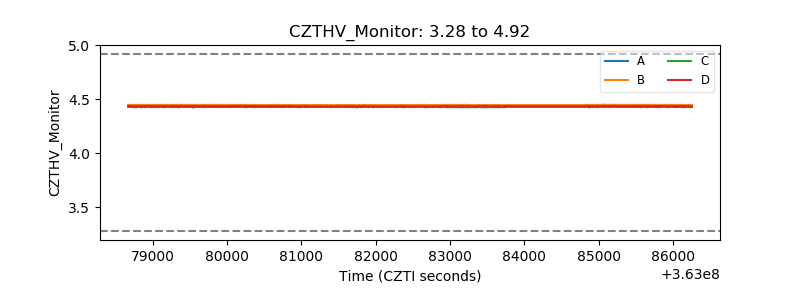 |
| D_VDD | 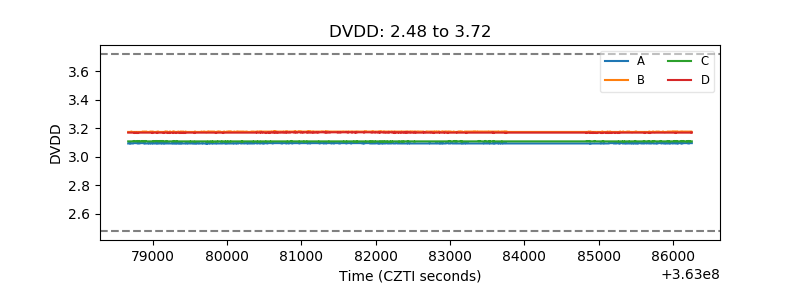 |
| Temperature 1 | 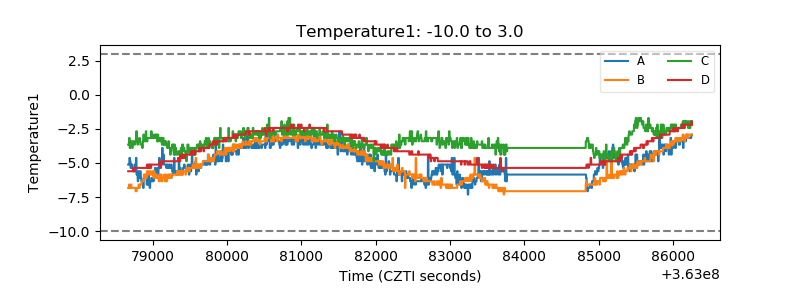 |
| Veto HV Monitor | 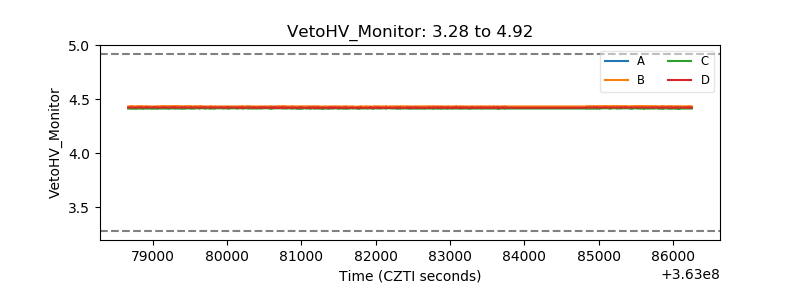 |
| Veto LLD | 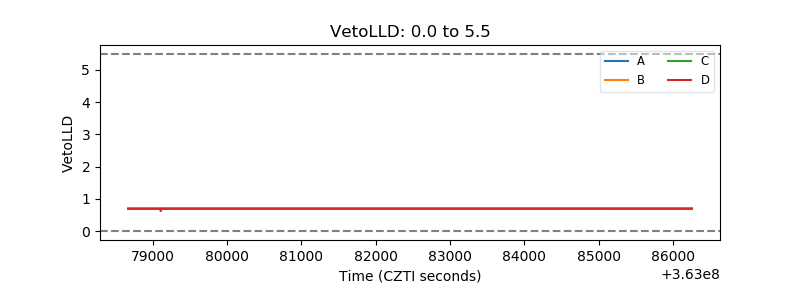 |
| Alpha Counter | 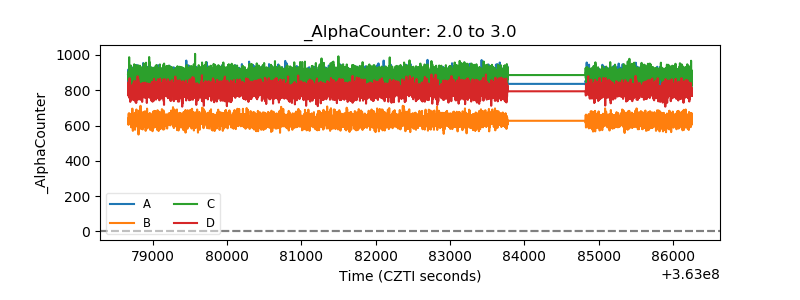 |
| _CPM_Rate | 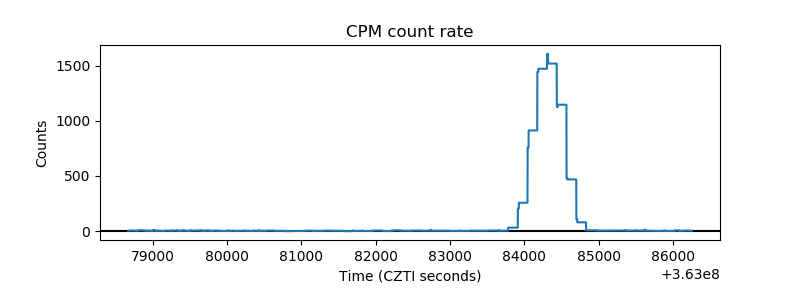 |
| CZT Counter | 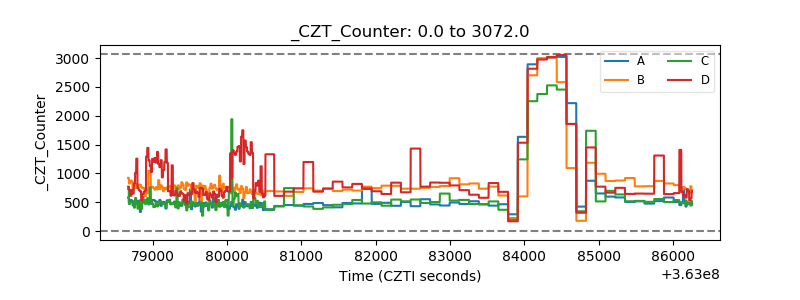 |
| +2.5 Volts monitor |  |
| +5 Volts monitor |  |
| _ROLL_ROT | 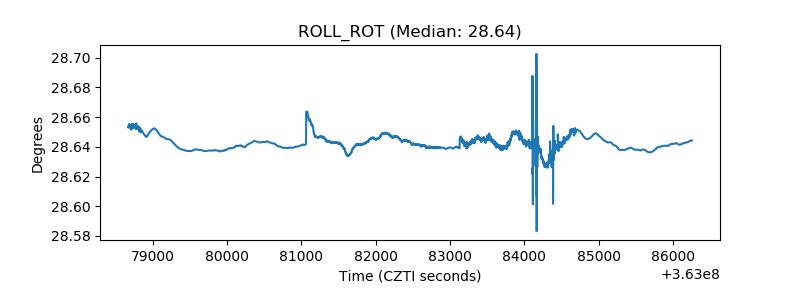 |
| _Roll_DEC | 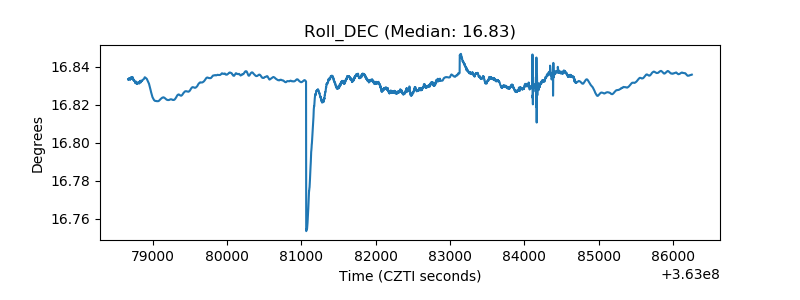 |
| _Roll_RA | 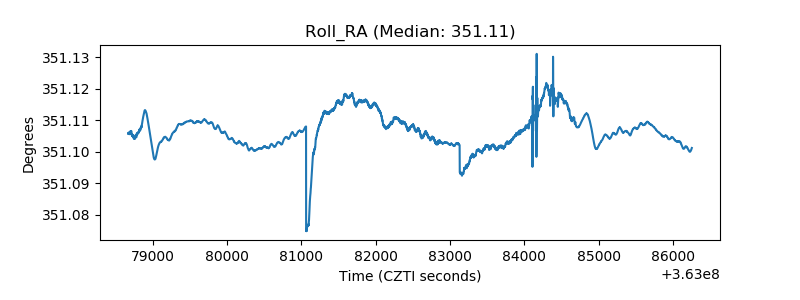 |
| Veto Counter | 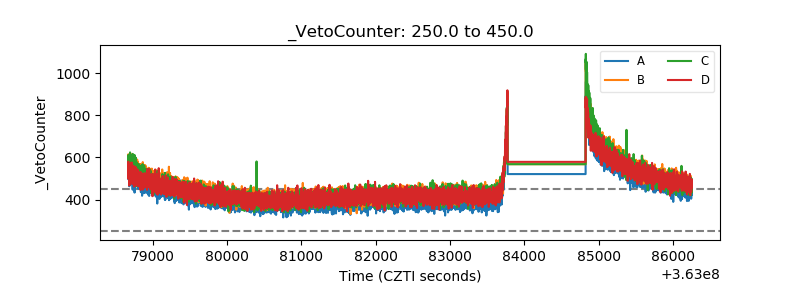 |