| Param | Original file | Final file |
|---|---|---|
| Filename | modeM0/AS1A10_058T02_9000004510_31177cztM0_level2.evt | modeM0/AS1A10_058T02_9000004510_31177cztM0_level2_quad_clean.evt |
| Size (bytes) | 583,712,640 | 76,858,560 |
| Size | 556.7 MB | 73.3 MB |
| Events in quadrant A | 3,376,613 | 487,675 |
| Events in quadrant B | 5,253,800 | 480,862 |
| Events in quadrant C | 3,491,793 | 460,334 |
| Events in quadrant D | 5,125,622 | 454,688 |
| Mode M0 | |||
|---|---|---|---|
| Quadrant | BADHDUFLAG | Total packets | Discarded packets |
| A | 0 | 13755 | 1 |
| B | 0 | 19866 | 1 |
| C | 0 | 14125 | 1 |
| D | 0 | 20457 | 2 |
| Mode SS | |||
|---|---|---|---|
| Quadrant | BADHDUFLAG | Total packets | Discarded packets |
| A | 0 | 128 | 0 |
| B | 0 | 128 | 0 |
| C | 0 | 128 | 0 |
| D | 0 | 128 | 0 |
| Mode M9 | |||
|---|---|---|---|
| Quadrant | BADHDUFLAG | Total packets | Discarded packets |
| A | 0 | 12 | 0 |
| B | 0 | 12 | 0 |
| C | 0 | 12 | 0 |
| D | 0 | 12 | 0 |
| Quadrant | Total seconds | Saturated seconds | Saturation percentage |
|---|---|---|---|
| A | 6365 | 62 | 0.974077% |
| B | 6365 | 161 | 2.529458% |
| C | 6365 | 111 | 1.743912% |
| D | 6364 | 89 | 1.398492% |
Noise dominated data is calculated using 1-second bins in cleaned event files. If a bin has >2000 counts, and if more than 50% of those come from <1% of pixels, then it is considered to be noise-dominated and hence unusable.
| Quadrant | # 1 sec bins | Bins with >0 counts | Bins with >2000 counts | High rate bins dominated by noise | Noise dominated (total time) | Noise dominated (detector-on time) | Marked lightcurve |
|---|---|---|---|---|---|---|---|
| A | 7530 | 6366 | 2 | 2 | 0.03% | 0.03% | 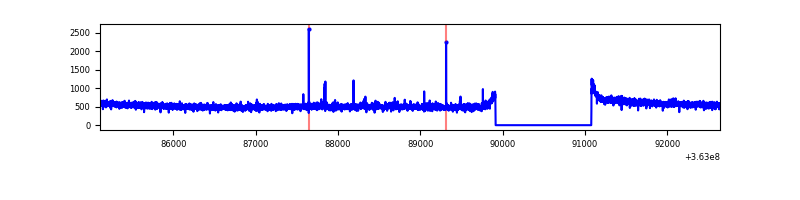 |
| B | 7530 | 6366 | 17 | 17 | 0.23% | 0.27% | 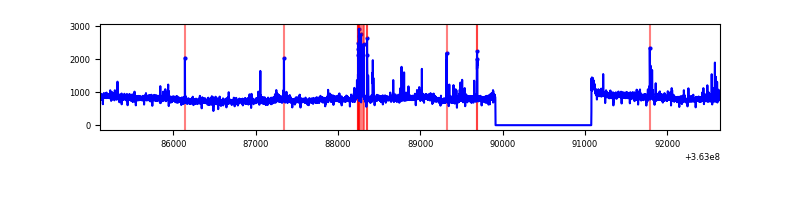 |
| C | 7530 | 6366 | 3 | 3 | 0.04% | 0.05% | 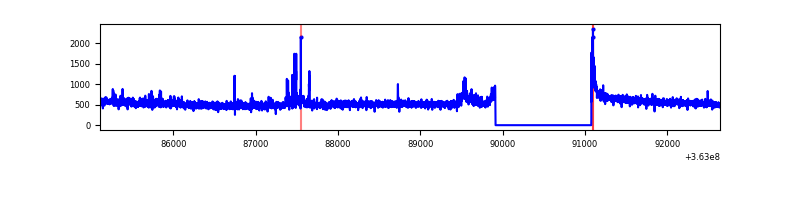 |
| D | 7529 | 6365 | 31 | 31 | 0.41% | 0.49% | 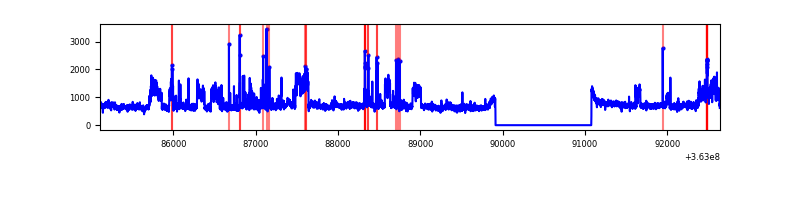 |
Top three noisy pixels from each quadrant. If the there are fewer than three noisy pixels in the level2.evt file, extra rows are filled as -1
| Pixel properties | Quadrant properties | ||||||
|---|---|---|---|---|---|---|---|
| Quadrant | DetID | PixID | Counts | Sigma | Mean | Median | Sigma |
| A | 12 | 96 | 29613 | 168.34 | 868 | 854 | 170.8 |
| A | 13 | 254 | 10551 | 56.76 | 868 | 854 | 170.8 |
| A | 3 | 137 | 8125 | 42.56 | 868 | 854 | 170.8 |
| B | 6 | 159 | 1711991 | 10719.46 | 841 | 822 | 159.6 |
| B | 4 | 80 | 136704 | 851.22 | 841 | 822 | 159.6 |
| B | 0 | 190 | 26181 | 158.86 | 841 | 822 | 159.6 |
| C | 14 | 238 | 139967 | 735.15 | 813 | 822 | 189.3 |
| C | 10 | 22 | 121919 | 639.8 | 813 | 822 | 189.3 |
| C | 0 | 10 | 26583 | 136.1 | 813 | 822 | 189.3 |
| D | 8 | 195 | 1787448 | 9094.26 | 832 | 811 | 196.5 |
| D | 12 | 233 | 63202 | 317.58 | 832 | 811 | 196.5 |
| D | 12 | 79 | 59740 | 299.96 | 832 | 811 | 196.5 |
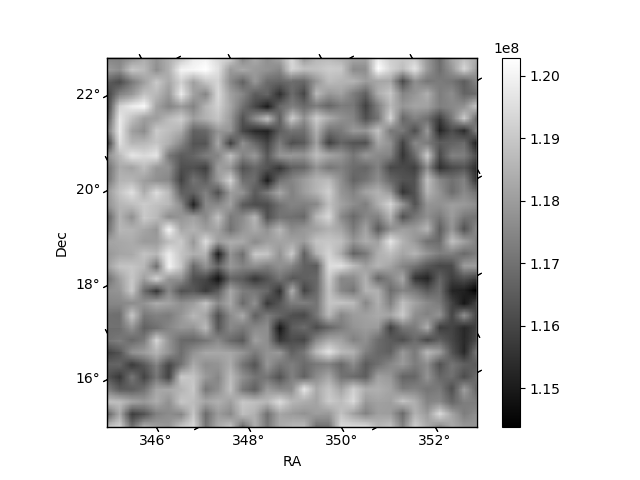
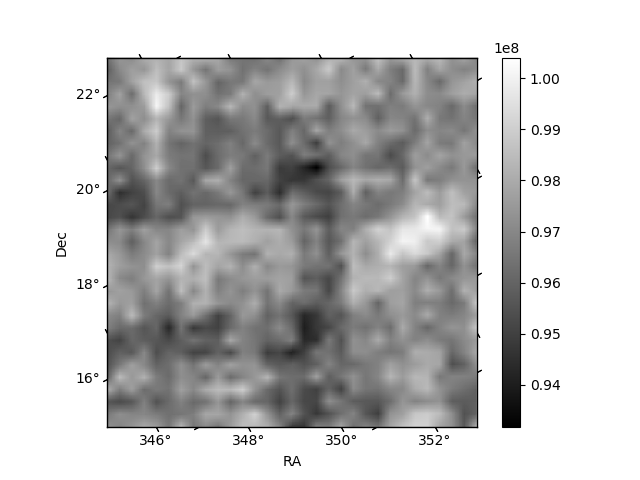
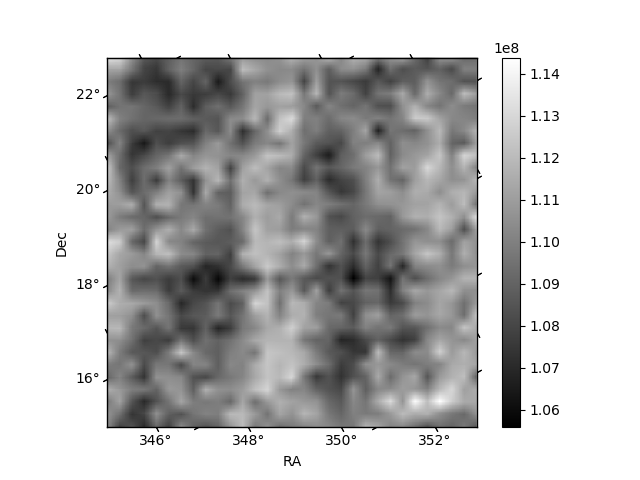
Histogram calculated using DETX and DETY for each event in the final _common_clean file
| Quadrant A |  |
 |
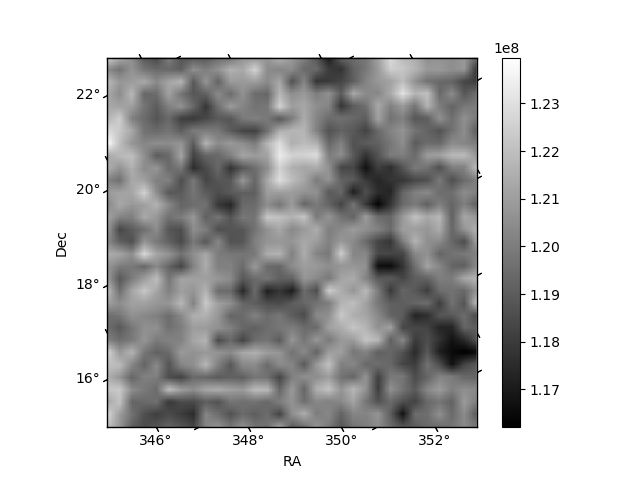
Quadrant B |
|---|---|---|---|
| Quadrant D |  |
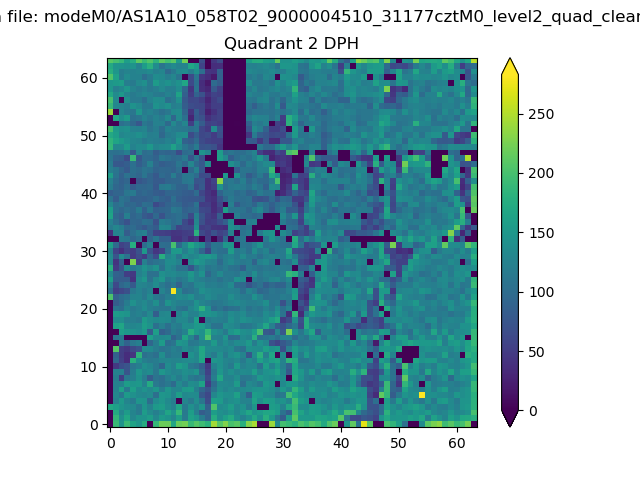 |
Quadrant C |
| Plot type | Count rate plots | Images |
|---|---|---|
| Comparison with Poisson distribution Blue bars denote a histogram of data divided into 1 sec bins. Red curve is a Poisson curve with rate = median count rate of data. |
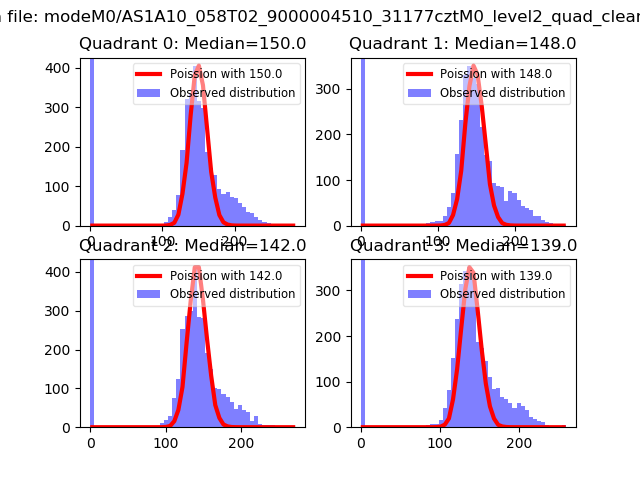 |
 |
| Quadrant-wise count rates Data is divided into 100 sec bins |
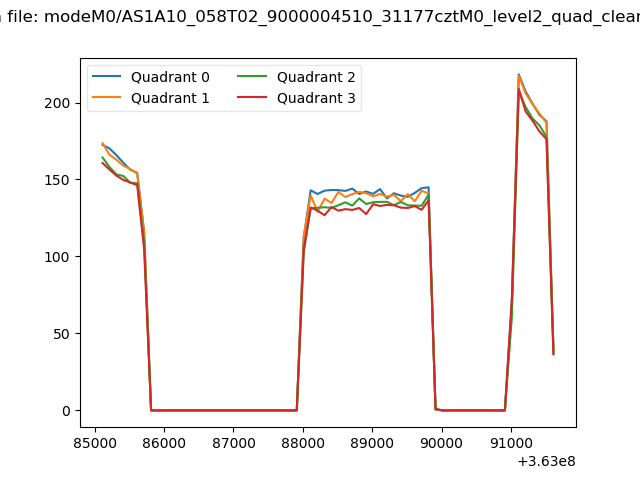 |
|
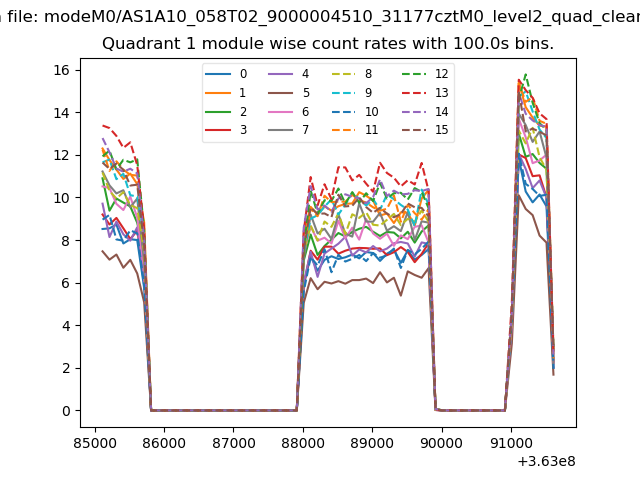
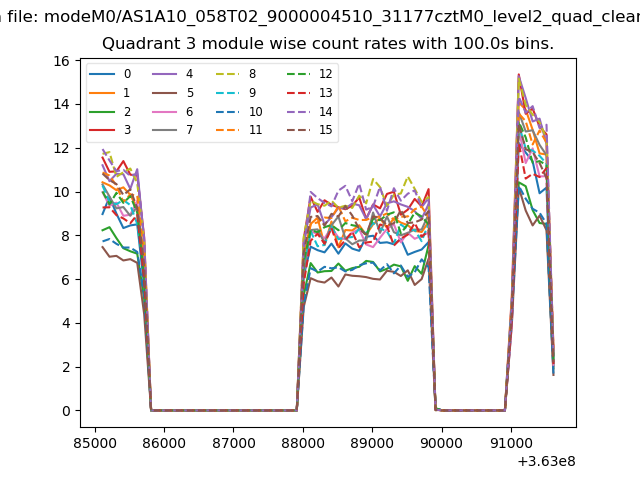
| Module-wise count rates for Quadrant A Data is divided into 100 sec bins |
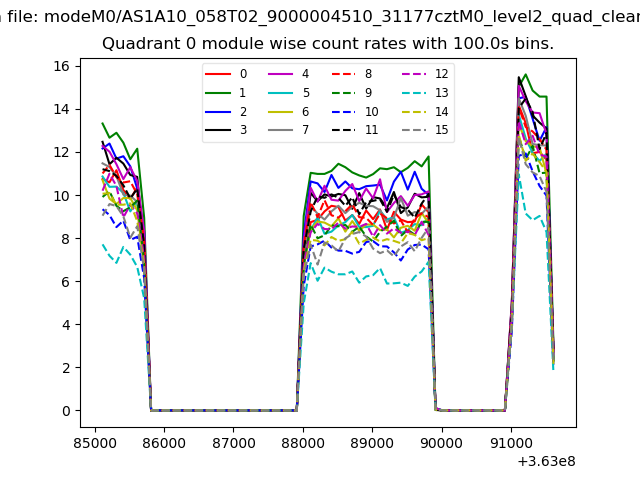 |
 |
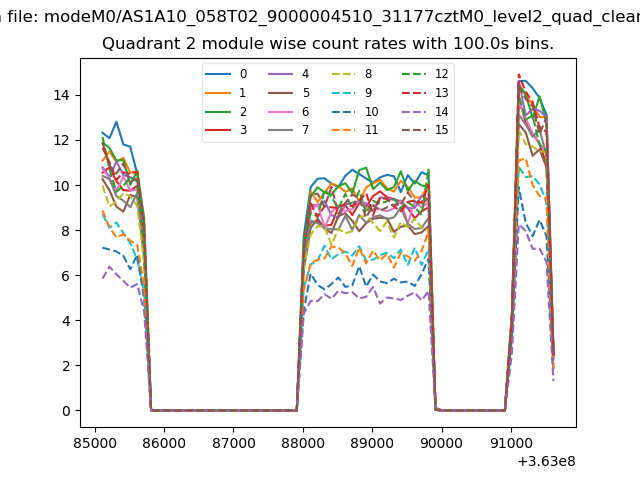
| Module-wise count rates for Quadrant B Data is divided into 100 sec bins |
 |
 |
| Module-wise count rates for Quadrant C Data is divided into 100 sec bins |
 |
 |
| Module-wise count rates for Quadrant D Data is divided into 100 sec bins |
 |
 |
| Parameter | Plot |
|---|---|
| CZT HV Monitor | 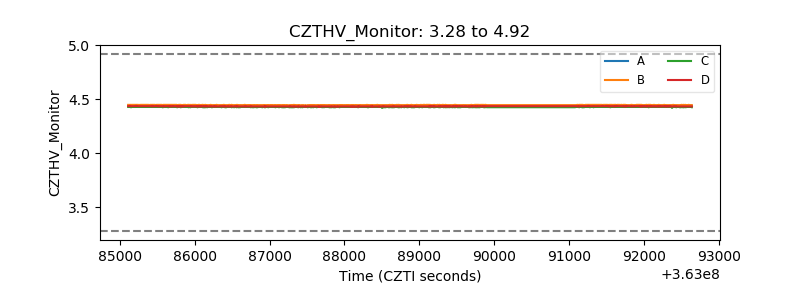 |
| D_VDD | 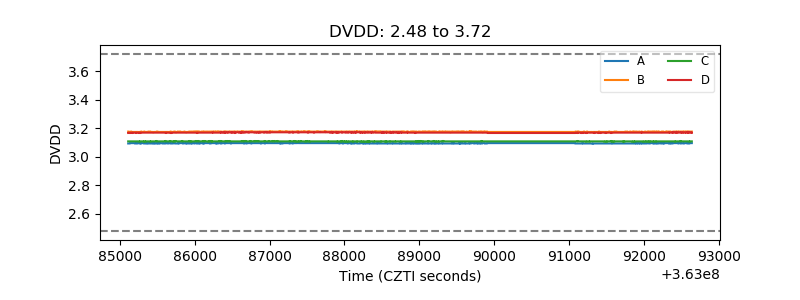 |
| Temperature 1 | 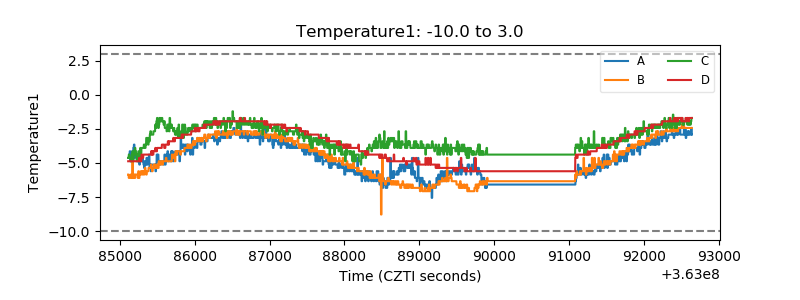 |
| Veto HV Monitor | 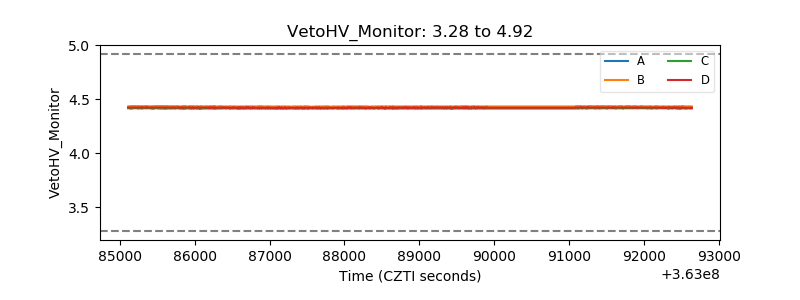 |
| Veto LLD |  |
| Alpha Counter | 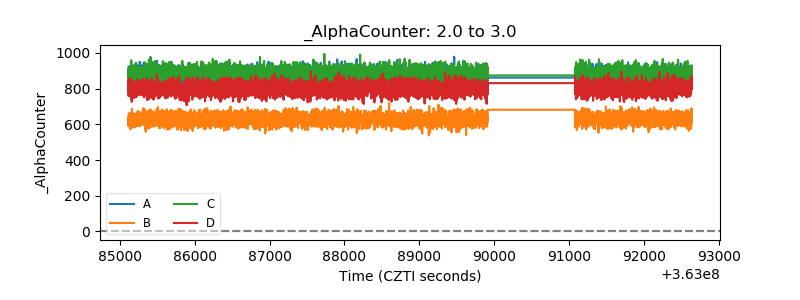 |
| _CPM_Rate | 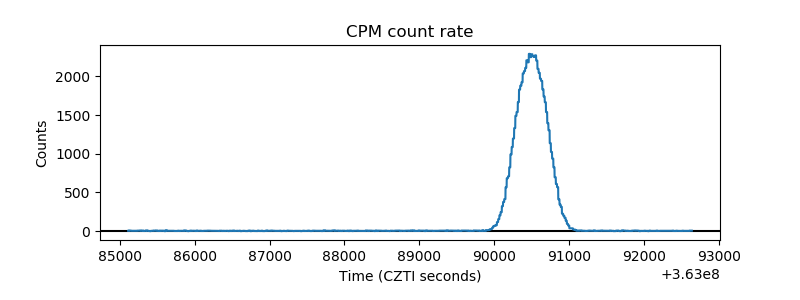 |
| CZT Counter | 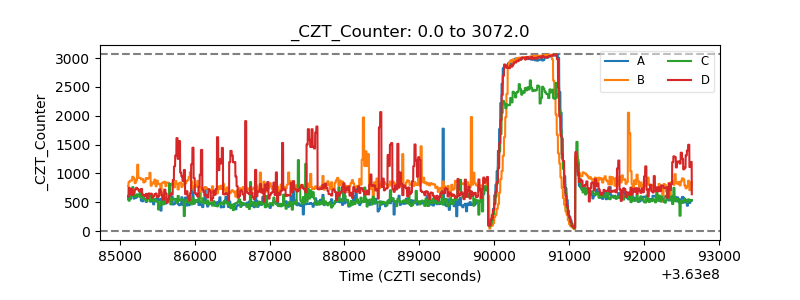 |
| +2.5 Volts monitor |  |
| +5 Volts monitor | 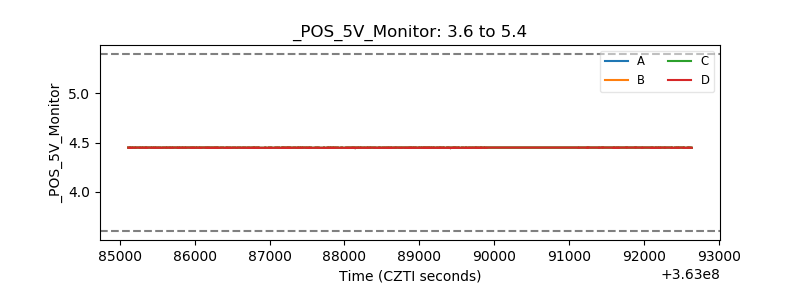 |
| _ROLL_ROT | 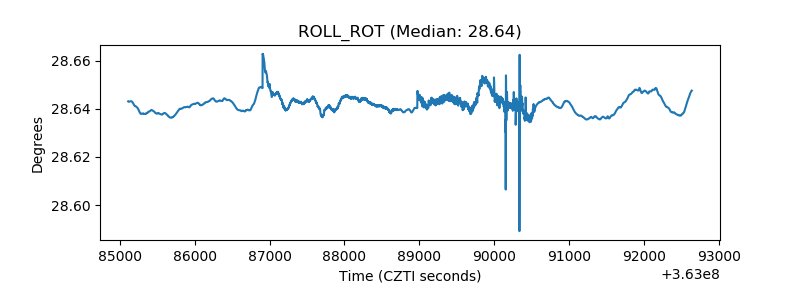 |
| _Roll_DEC | 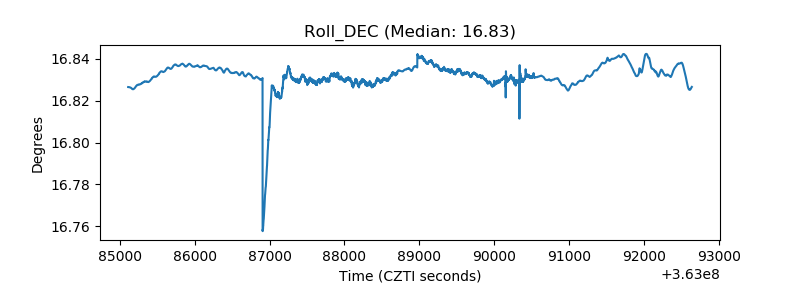 |
| _Roll_RA |  |
| Veto Counter | 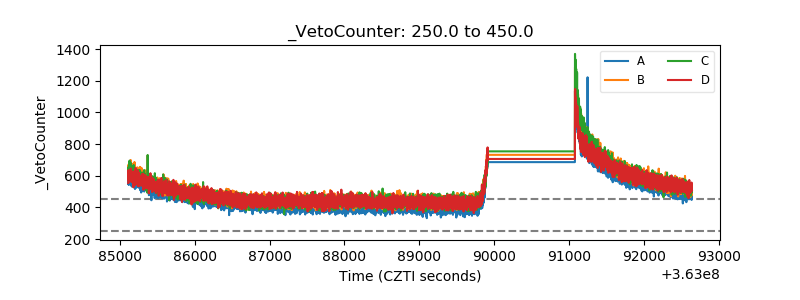 |