| Param | Original file | Final file |
|---|---|---|
| Filename | modeM0/AS1A10_058T02_9000004510_31178cztM0_level2.evt | modeM0/AS1A10_058T02_9000004510_31178cztM0_level2_quad_clean.evt |
| Size (bytes) | 632,842,560 | 74,894,400 |
| Size | 603.5 MB | 71.4 MB |
| Events in quadrant A | 3,711,631 | 469,828 |
| Events in quadrant B | 5,857,018 | 459,211 |
| Events in quadrant C | 3,834,681 | 439,459 |
| Events in quadrant D | 5,318,058 | 440,452 |
| Mode M0 | |||
|---|---|---|---|
| Quadrant | BADHDUFLAG | Total packets | Discarded packets |
| A | 0 | 15136 | 2 |
| B | 0 | 21662 | 2 |
| C | 0 | 15392 | 2 |
| D | 0 | 21019 | 2 |
| Mode SS | |||
|---|---|---|---|
| Quadrant | BADHDUFLAG | Total packets | Discarded packets |
| A | 0 | 134 | 0 |
| B | 0 | 134 | 0 |
| C | 0 | 134 | 0 |
| D | 0 | 134 | 0 |
| Mode M9 | |||
|---|---|---|---|
| Quadrant | BADHDUFLAG | Total packets | Discarded packets |
| A | 0 | 12 | 0 |
| B | 0 | 13 | 0 |
| C | 0 | 13 | 0 |
| D | 0 | 13 | 0 |
| Quadrant | Total seconds | Saturated seconds | Saturation percentage |
|---|---|---|---|
| A | 6577 | 95 | 1.444428% |
| B | 6577 | 298 | 4.530941% |
| C | 6577 | 175 | 2.660788% |
| D | 6577 | 99 | 1.505246% |
Noise dominated data is calculated using 1-second bins in cleaned event files. If a bin has >2000 counts, and if more than 50% of those come from <1% of pixels, then it is considered to be noise-dominated and hence unusable.
| Quadrant | # 1 sec bins | Bins with >0 counts | Bins with >2000 counts | High rate bins dominated by noise | Noise dominated (total time) | Noise dominated (detector-on time) | Marked lightcurve |
|---|---|---|---|---|---|---|---|
| A | 7832 | 6578 | 0 | 0 | 0.00% | 0.00% | 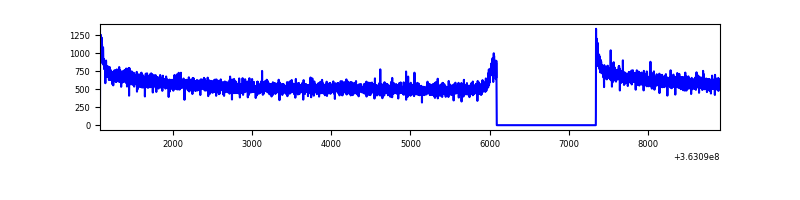 |
| B | 7832 | 6578 | 65 | 65 | 0.83% | 0.99% | 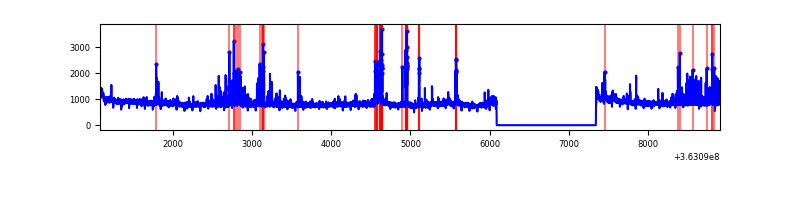 |
| C | 7832 | 6578 | 14 | 14 | 0.18% | 0.21% | 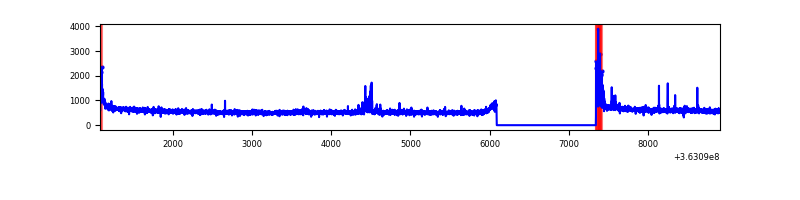 |
| D | 7832 | 6578 | 15 | 15 | 0.19% | 0.23% | 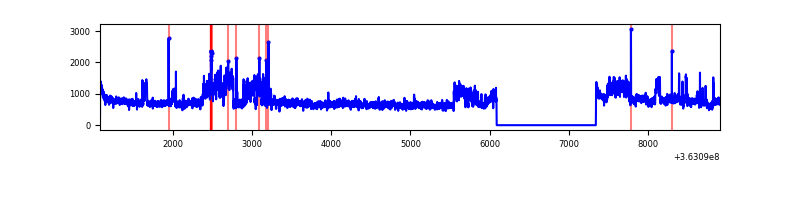 |
Top three noisy pixels from each quadrant. If the there are fewer than three noisy pixels in the level2.evt file, extra rows are filled as -1
| Pixel properties | Quadrant properties | ||||||
|---|---|---|---|---|---|---|---|
| Quadrant | DetID | PixID | Counts | Sigma | Mean | Median | Sigma |
| A | 13 | 254 | 11613 | 56.18 | 962 | 948 | 189.8 |
| A | 3 | 137 | 8694 | 40.8 | 962 | 948 | 189.8 |
| A | 0 | 226 | 8216 | 38.28 | 962 | 948 | 189.8 |
| B | 6 | 159 | 1701634 | 9858.34 | 923 | 905 | 172.5 |
| B | 12 | 18 | 280535 | 1620.89 | 923 | 905 | 172.5 |
| B | 4 | 80 | 207088 | 1195.15 | 923 | 905 | 172.5 |
| C | 14 | 238 | 148058 | 710.6 | 896 | 906 | 207.1 |
| C | 0 | 10 | 111083 | 532.05 | 896 | 906 | 207.1 |
| C | 10 | 22 | 57001 | 270.88 | 896 | 906 | 207.1 |
| D | 8 | 195 | 1754525 | 8212.24 | 921 | 900 | 213.5 |
| D | 2 | 250 | 33946 | 154.75 | 921 | 900 | 213.5 |
| D | 2 | 234 | 23501 | 105.84 | 921 | 900 | 213.5 |
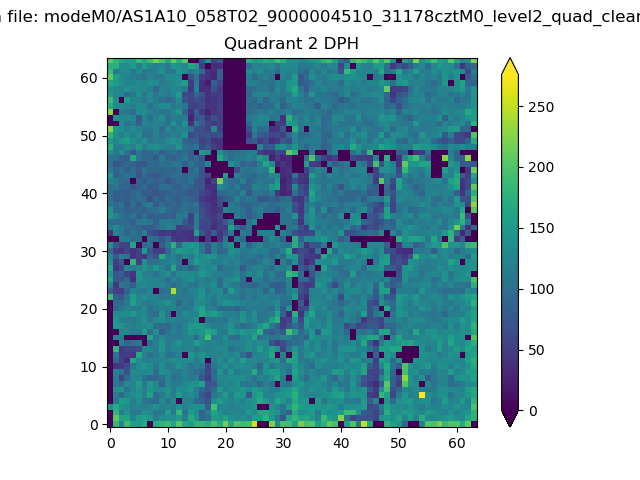
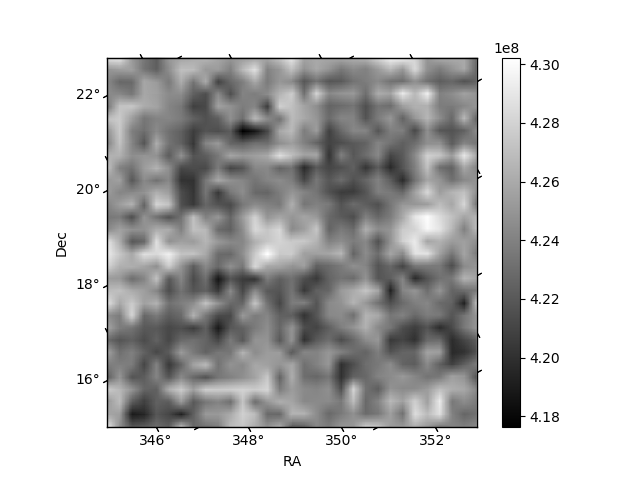
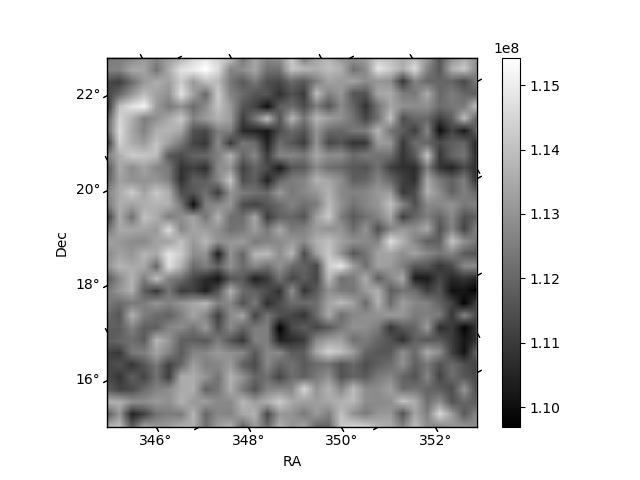
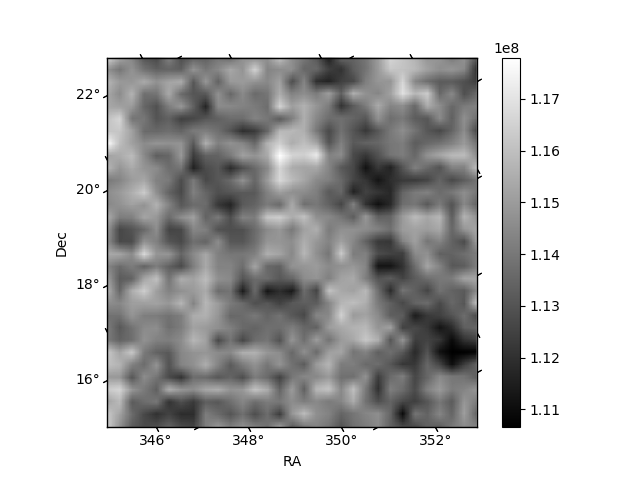
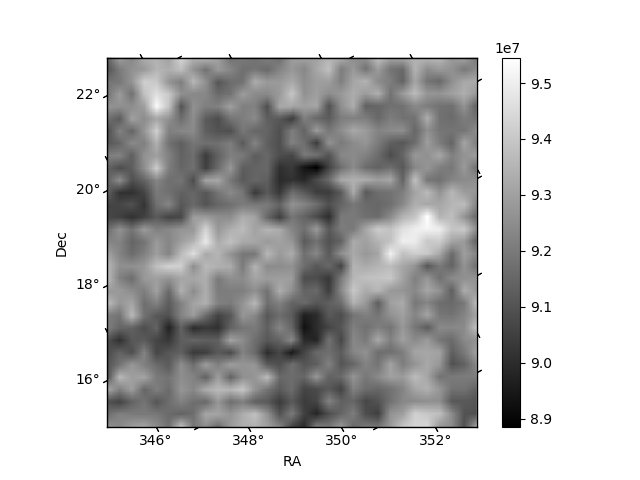
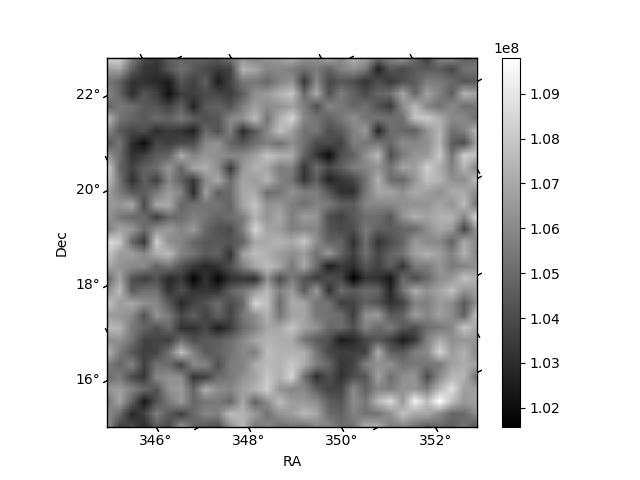
Histogram calculated using DETX and DETY for each event in the final _common_clean file
| Quadrant A | 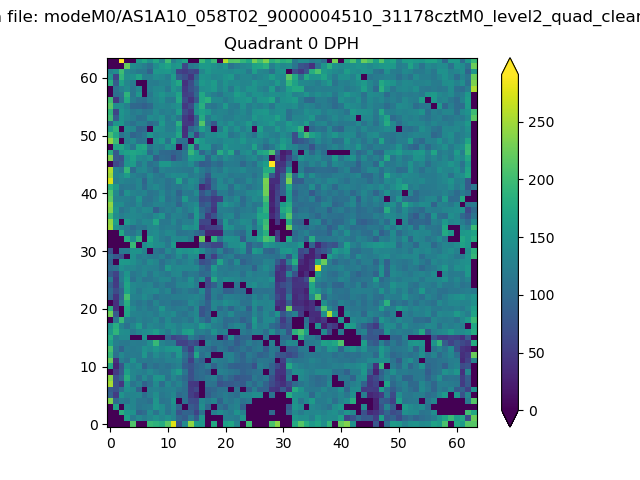 |
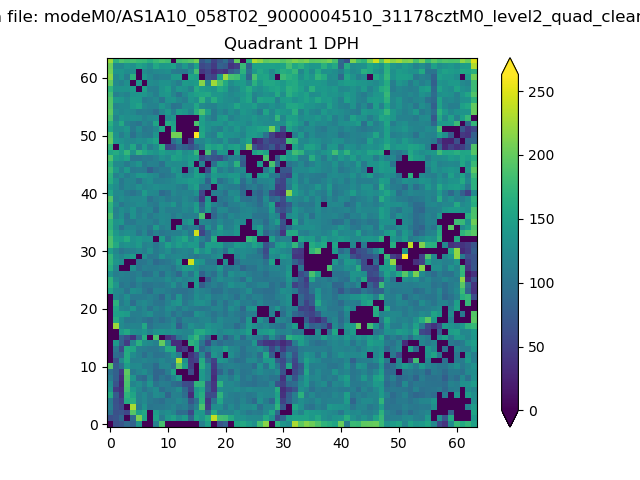 |
Quadrant B |
|---|---|---|---|
| Quadrant D | 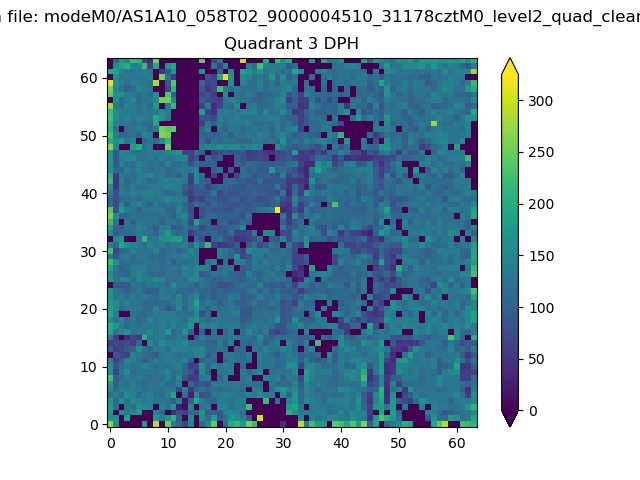 |
 |
Quadrant C |
| Plot type | Count rate plots | Images |
|---|---|---|
| Comparison with Poisson distribution Blue bars denote a histogram of data divided into 1 sec bins. Red curve is a Poisson curve with rate = median count rate of data. |
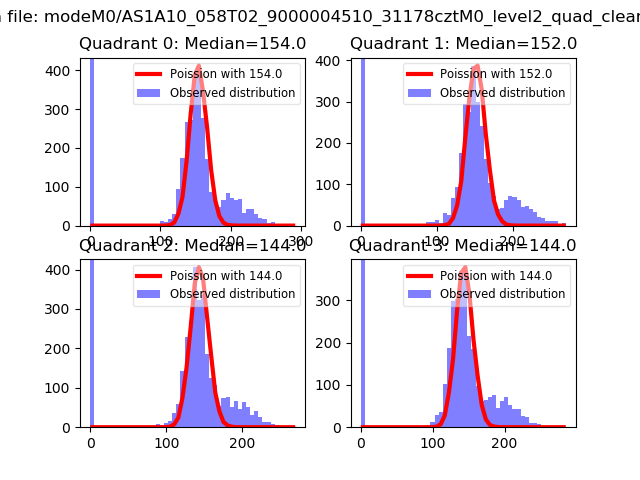 |
 |
| Quadrant-wise count rates Data is divided into 100 sec bins |
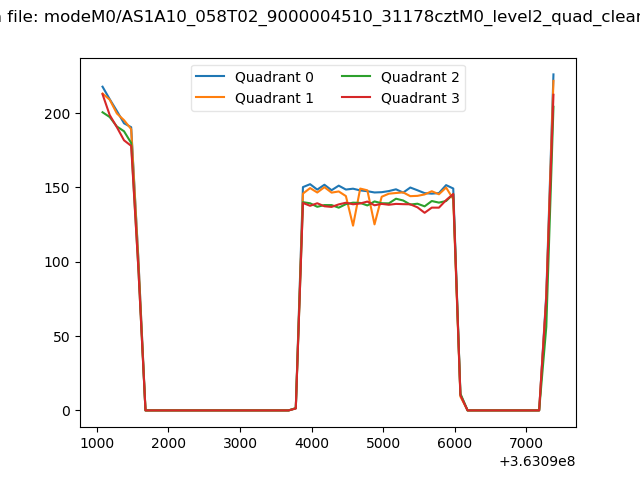 |
|
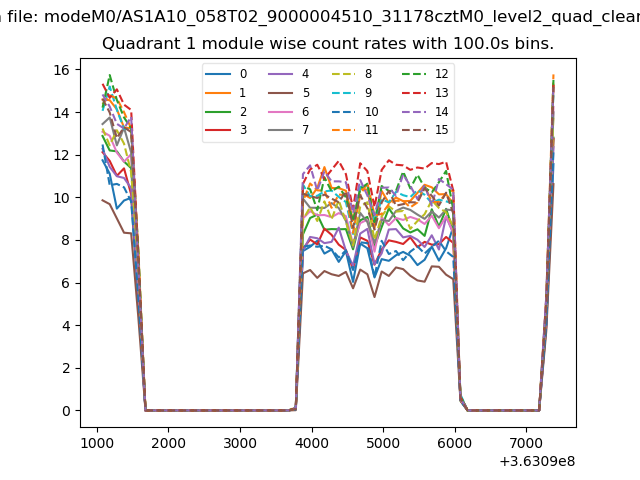
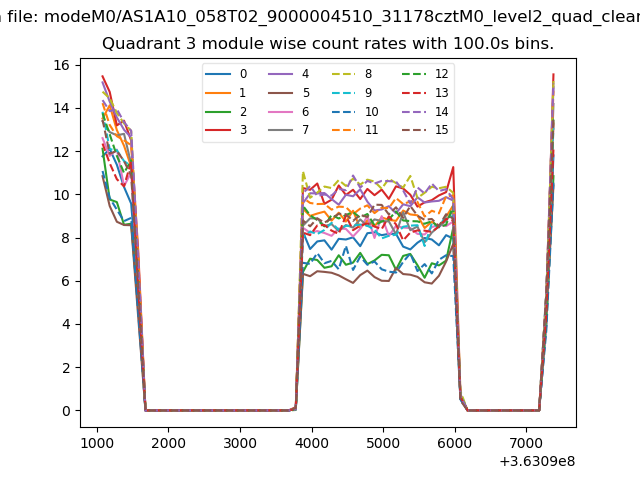
| Module-wise count rates for Quadrant A Data is divided into 100 sec bins |
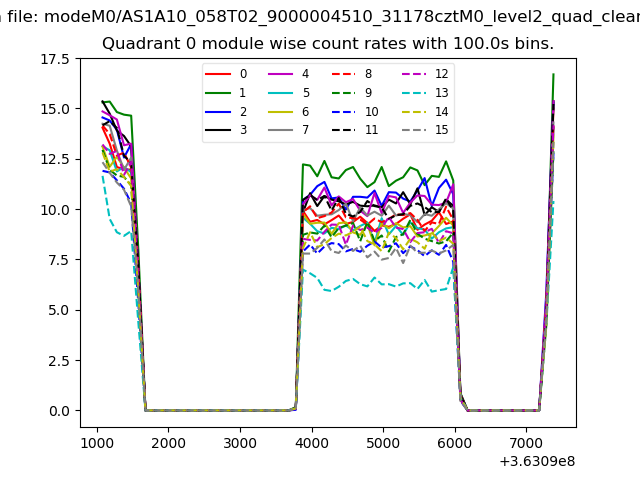 |
 |
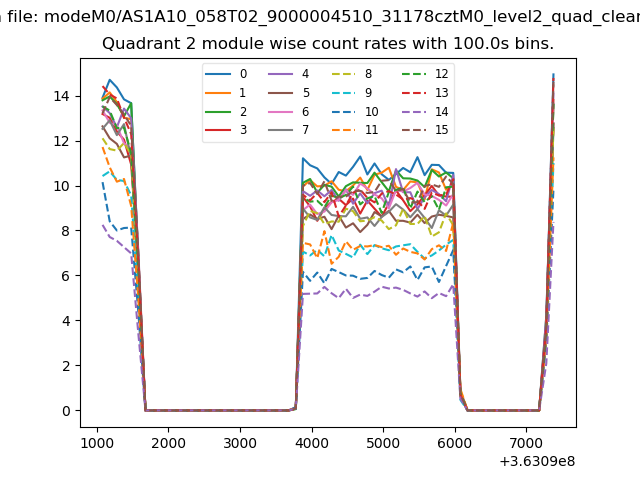
| Module-wise count rates for Quadrant B Data is divided into 100 sec bins |
 |
 |
| Module-wise count rates for Quadrant C Data is divided into 100 sec bins |
 |
 |
| Module-wise count rates for Quadrant D Data is divided into 100 sec bins |
 |
 |
| Parameter | Plot |
|---|---|
| CZT HV Monitor | 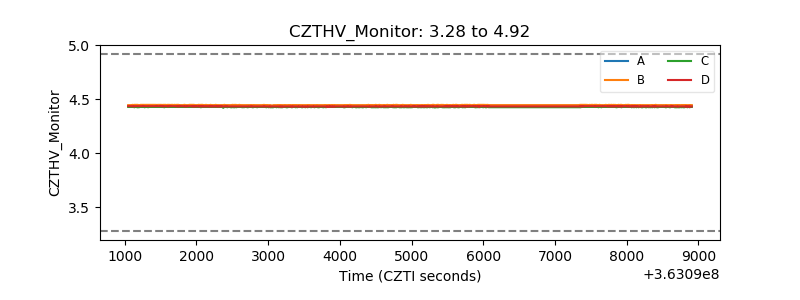 |
| D_VDD | 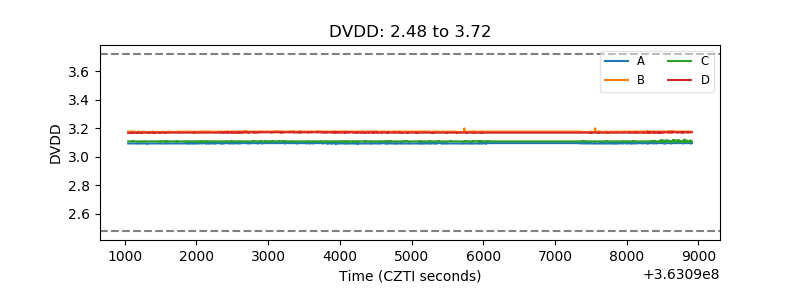 |
| Temperature 1 | 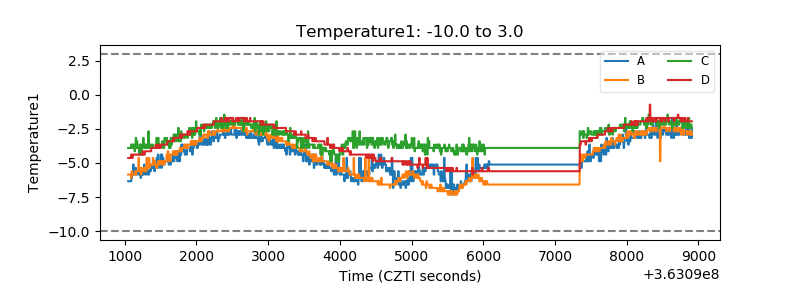 |
| Veto HV Monitor |  |
| Veto LLD | 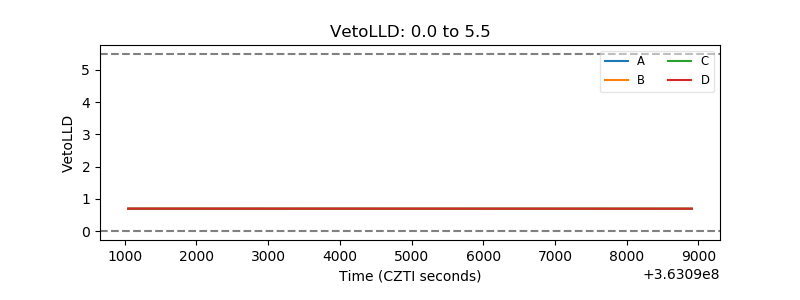 |
| Alpha Counter | 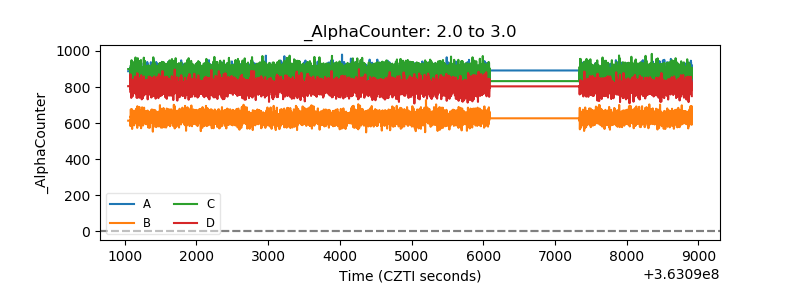 |
| _CPM_Rate | 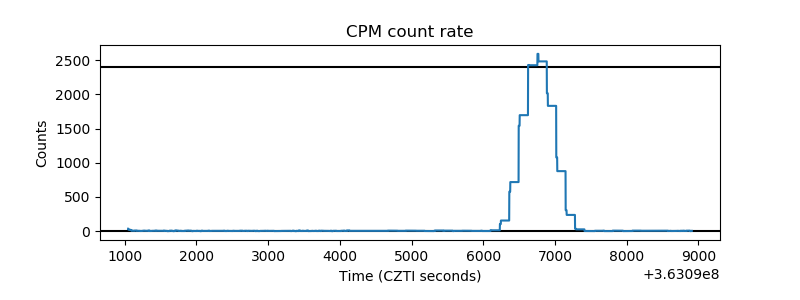 |
| CZT Counter | 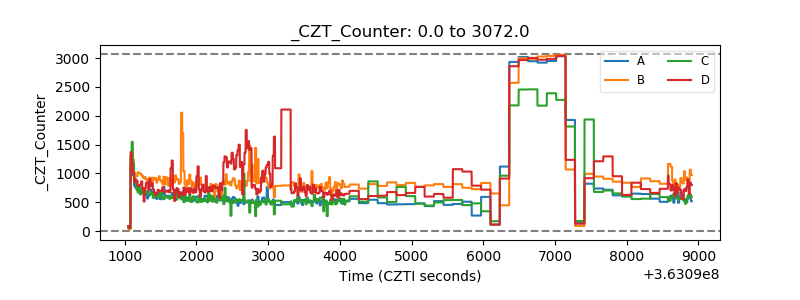 |
| +2.5 Volts monitor |  |
| +5 Volts monitor |  |
| _ROLL_ROT | 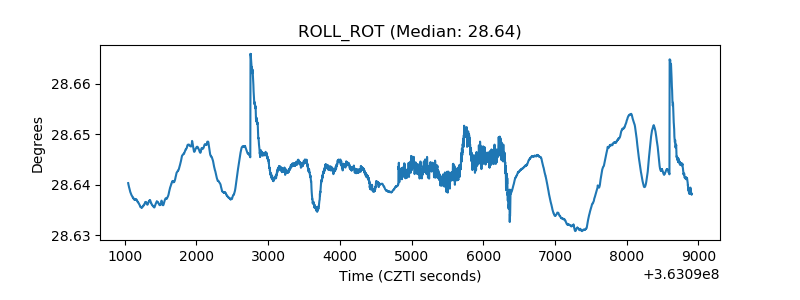 |
| _Roll_DEC | 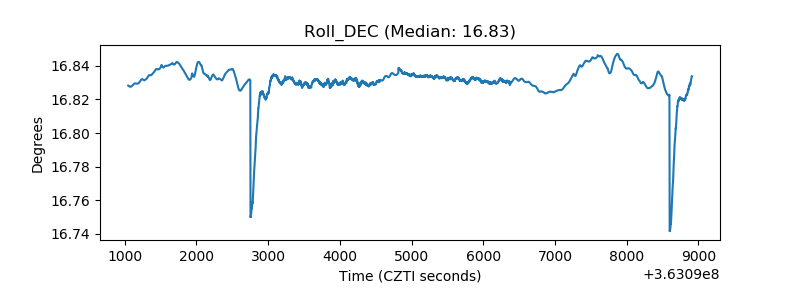 |
| _Roll_RA | 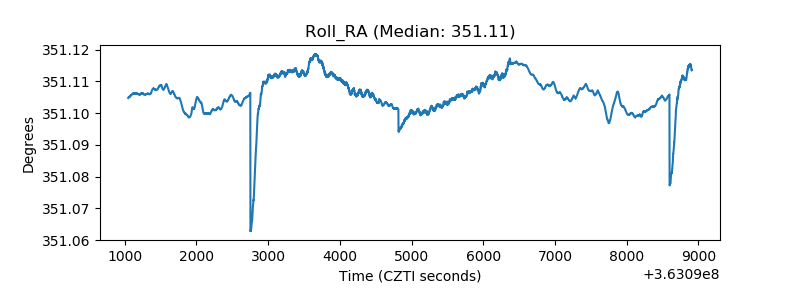 |
| Veto Counter | 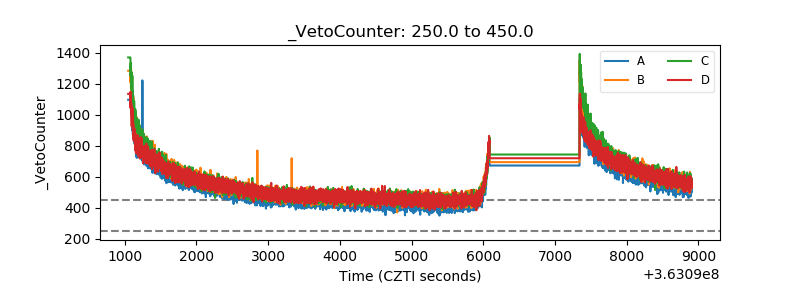 |