| Param | Original file | Final file |
|---|---|---|
| Filename | modeM0/AS1A10_058T02_9000004510_31179cztM0_level2.evt | modeM0/AS1A10_058T02_9000004510_31179cztM0_level2_quad_clean.evt |
| Size (bytes) | 640,183,680 | 69,056,640 |
| Size | 610.5 MB | 65.9 MB |
| Events in quadrant A | 3,746,294 | 425,931 |
| Events in quadrant B | 5,686,618 | 419,515 |
| Events in quadrant C | 3,980,095 | 399,821 |
| Events in quadrant D | 5,538,522 | 394,552 |
| Mode M0 | |||
|---|---|---|---|
| Quadrant | BADHDUFLAG | Total packets | Discarded packets |
| A | 0 | 15307 | 2 |
| B | 0 | 20905 | 2 |
| C | 0 | 15960 | 2 |
| D | 0 | 21215 | 2 |
| Mode SS | |||
|---|---|---|---|
| Quadrant | BADHDUFLAG | Total packets | Discarded packets |
| A | 0 | 132 | 0 |
| B | 0 | 132 | 0 |
| C | 0 | 132 | 0 |
| D | 0 | 132 | 0 |
| Mode M9 | |||
|---|---|---|---|
| Quadrant | BADHDUFLAG | Total packets | Discarded packets |
| A | 0 | 16 | 0 |
| B | 0 | 17 | 0 |
| C | 0 | 17 | 0 |
| D | 0 | 17 | 0 |
| Quadrant | Total seconds | Saturated seconds | Saturation percentage |
|---|---|---|---|
| A | 6464 | 101 | 1.562500% |
| B | 6464 | 224 | 3.465347% |
| C | 6464 | 272 | 4.207921% |
| D | 6464 | 162 | 2.506188% |
Noise dominated data is calculated using 1-second bins in cleaned event files. If a bin has >2000 counts, and if more than 50% of those come from <1% of pixels, then it is considered to be noise-dominated and hence unusable.
| Quadrant | # 1 sec bins | Bins with >0 counts | Bins with >2000 counts | High rate bins dominated by noise | Noise dominated (total time) | Noise dominated (detector-on time) | Marked lightcurve |
|---|---|---|---|---|---|---|---|
| A | 7779 | 6465 | 1 | 1 | 0.01% | 0.02% | 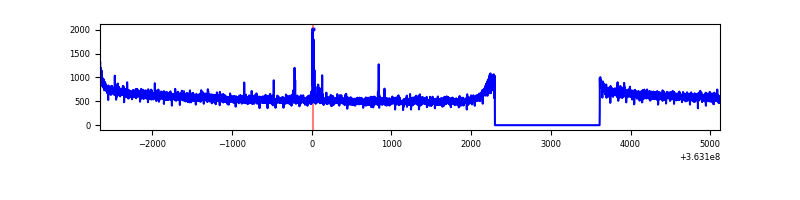 |
| B | 7779 | 6465 | 21 | 21 | 0.27% | 0.32% | 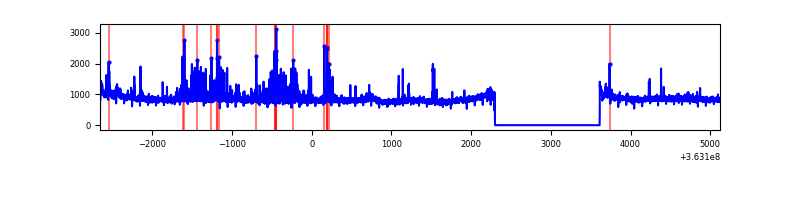 |
| C | 7779 | 6465 | 39 | 39 | 0.50% | 0.60% | 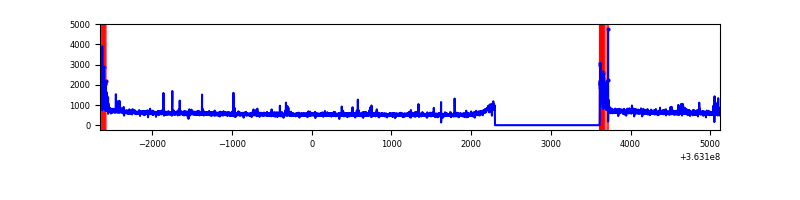 |
| D | 7779 | 6465 | 45 | 45 | 0.58% | 0.70% | 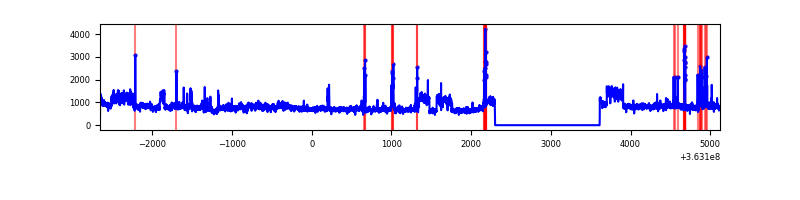 |
Top three noisy pixels from each quadrant. If the there are fewer than three noisy pixels in the level2.evt file, extra rows are filled as -1
| Pixel properties | Quadrant properties | ||||||
|---|---|---|---|---|---|---|---|
| Quadrant | DetID | PixID | Counts | Sigma | Mean | Median | Sigma |
| A | 12 | 96 | 28161 | 142.92 | 965 | 951 | 190.4 |
| A | 13 | 254 | 11852 | 57.26 | 965 | 951 | 190.4 |
| A | 3 | 137 | 8770 | 41.07 | 965 | 951 | 190.4 |
| B | 6 | 159 | 1678875 | 9631.98 | 934 | 917 | 174.2 |
| B | 12 | 18 | 206608 | 1180.73 | 934 | 917 | 174.2 |
| B | 4 | 80 | 76310 | 432.78 | 934 | 917 | 174.2 |
| C | 0 | 10 | 249392 | 1212.01 | 899 | 909 | 205.0 |
| C | 14 | 238 | 160040 | 776.18 | 899 | 909 | 205.0 |
| C | 14 | 254 | 16660 | 76.83 | 899 | 909 | 205.0 |
| D | 8 | 195 | 1699109 | 7947.91 | 925 | 909 | 213.7 |
| D | 2 | 250 | 130973 | 608.72 | 925 | 909 | 213.7 |
| D | 2 | 69 | 109470 | 508.09 | 925 | 909 | 213.7 |
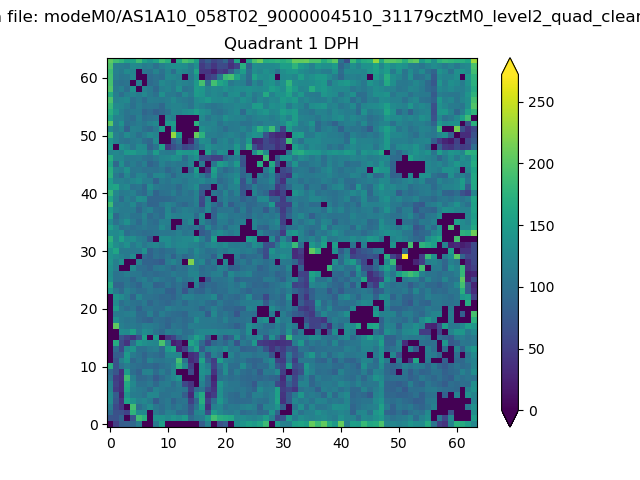
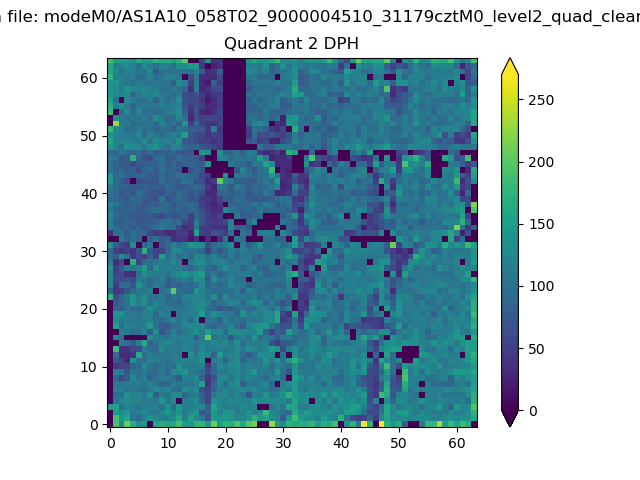
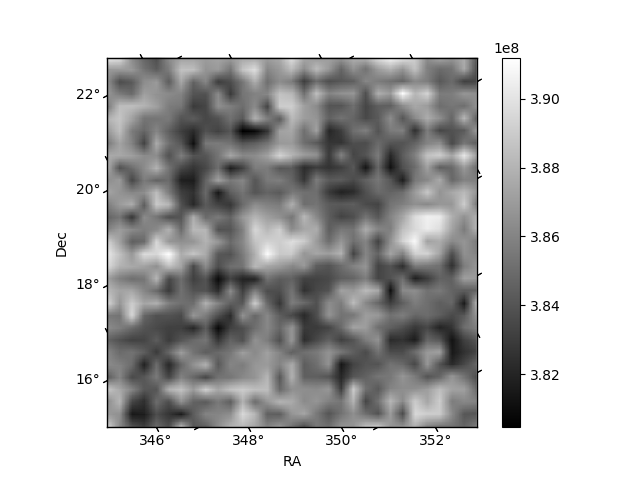
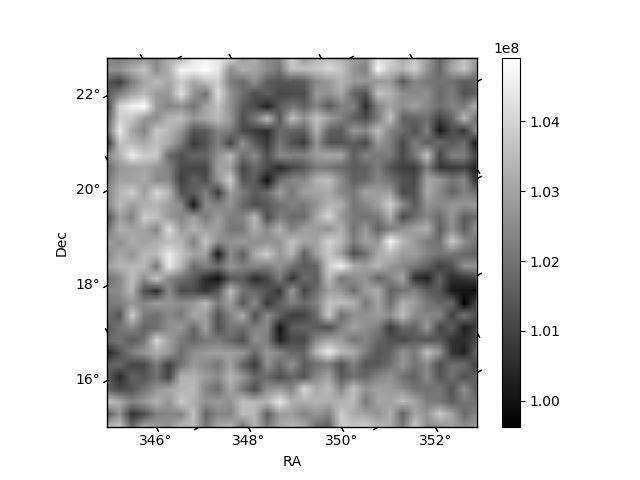
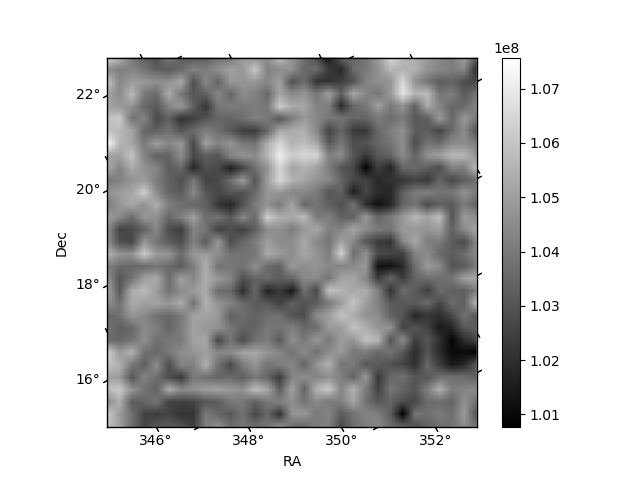
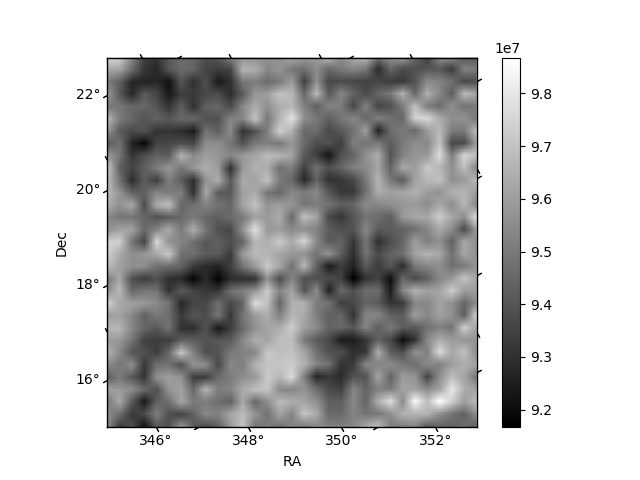
Histogram calculated using DETX and DETY for each event in the final _common_clean file
| Quadrant A |  |
 |
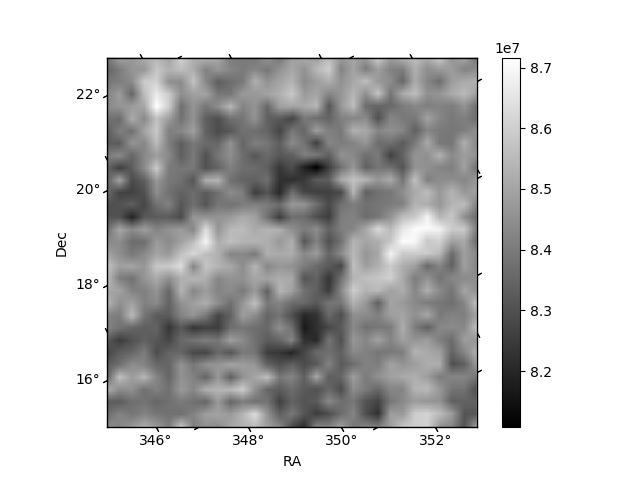
Quadrant B |
|---|---|---|---|
| Quadrant D | 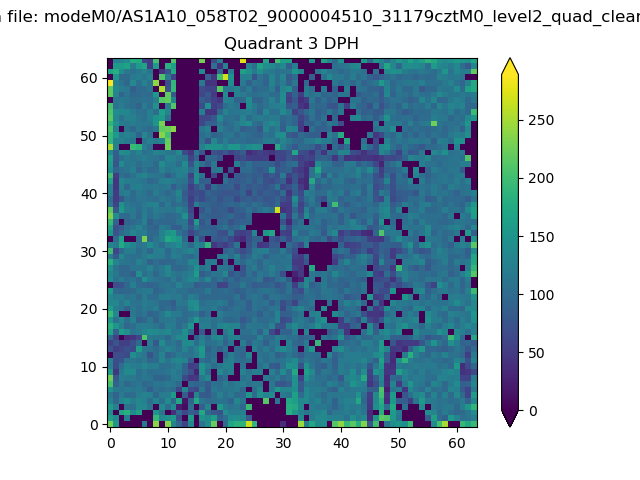 |
 |
Quadrant C |
| Plot type | Count rate plots | Images |
|---|---|---|
| Comparison with Poisson distribution Blue bars denote a histogram of data divided into 1 sec bins. Red curve is a Poisson curve with rate = median count rate of data. |
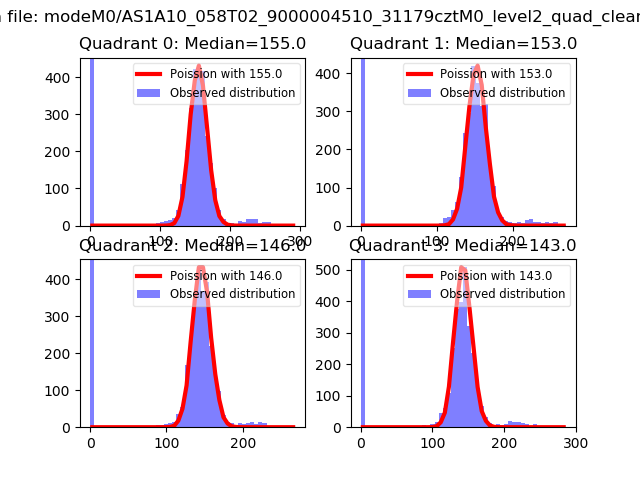 |
 |
| Quadrant-wise count rates Data is divided into 100 sec bins |
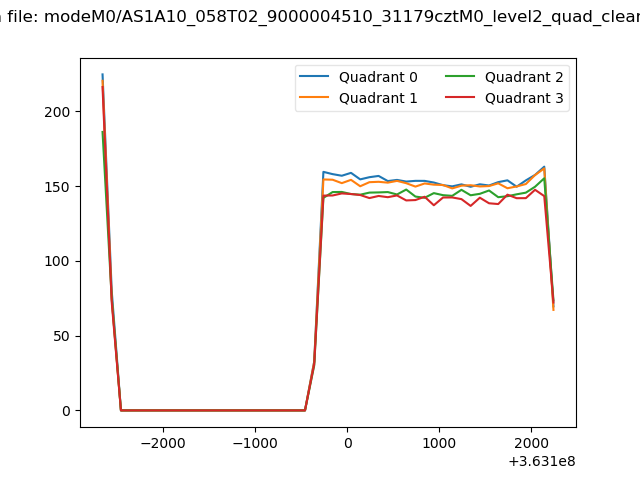 |
|
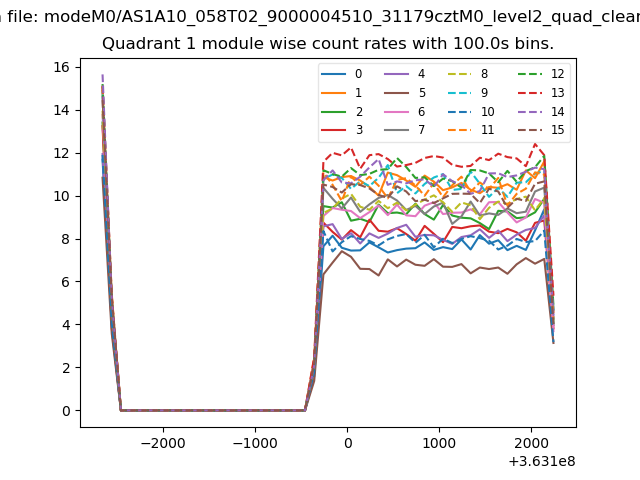
| Module-wise count rates for Quadrant A Data is divided into 100 sec bins |
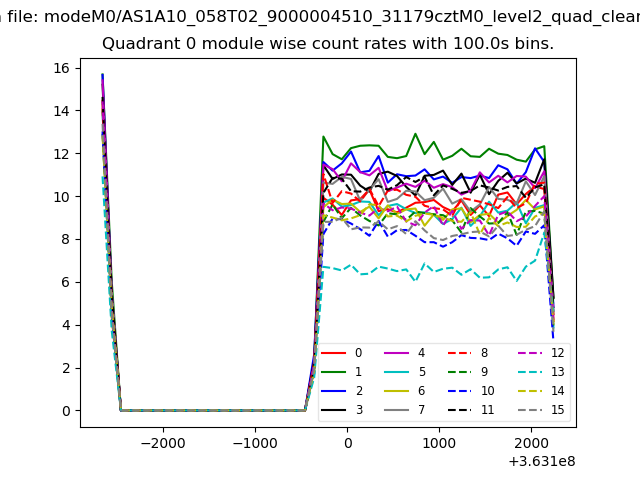 |
 |
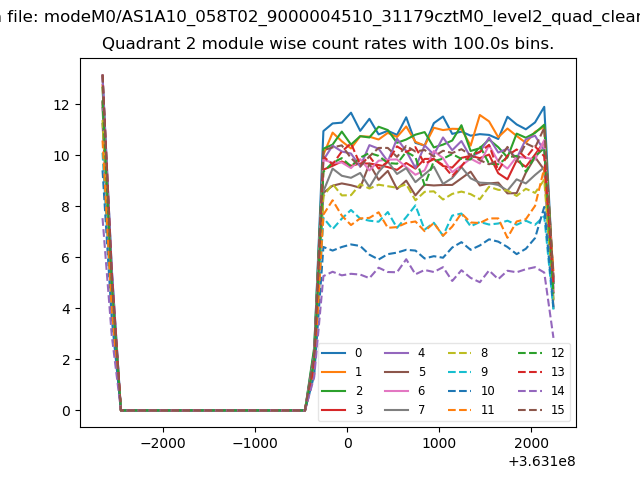
| Module-wise count rates for Quadrant B Data is divided into 100 sec bins |
 |
 |
| Module-wise count rates for Quadrant C Data is divided into 100 sec bins |
 |
 |
| Module-wise count rates for Quadrant D Data is divided into 100 sec bins |
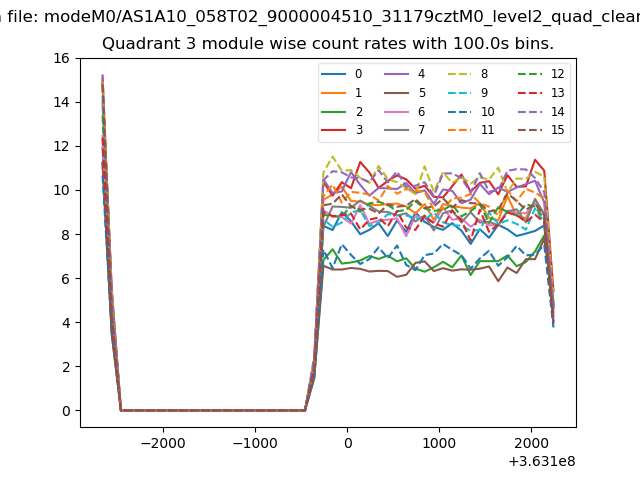 |
 |
| Parameter | Plot |
|---|---|
| CZT HV Monitor | 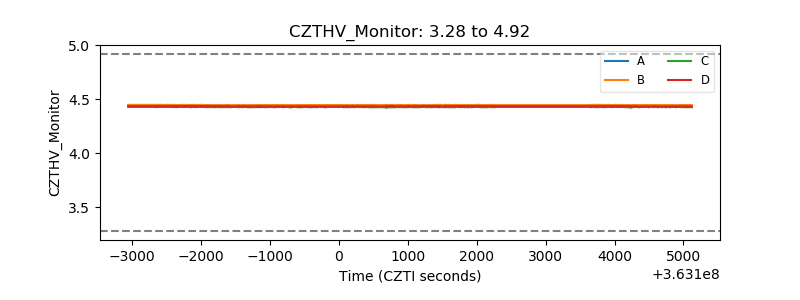 |
| D_VDD | 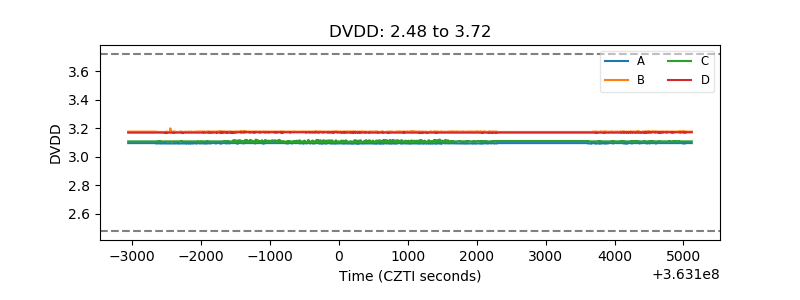 |
| Temperature 1 | 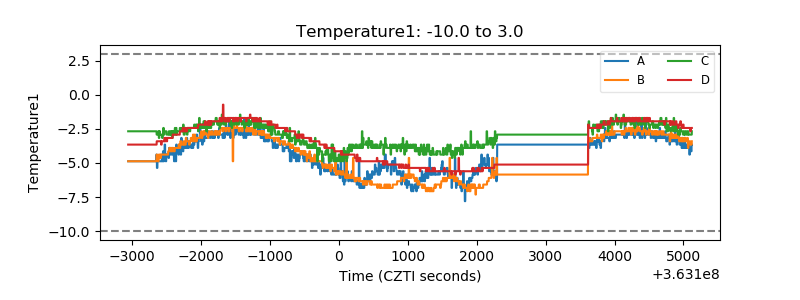 |
| Veto HV Monitor | 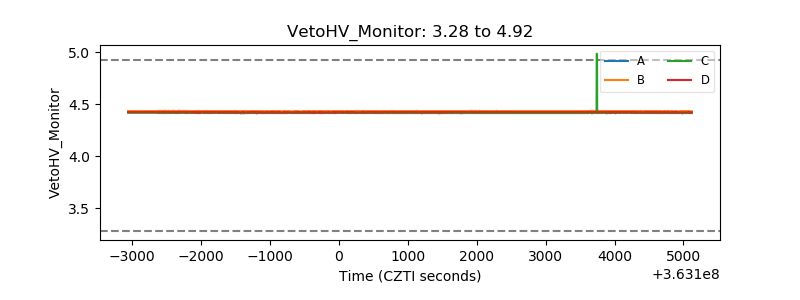 |
| Veto LLD | 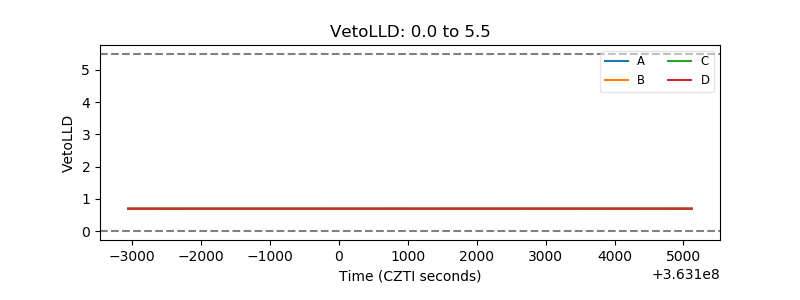 |
| Alpha Counter | 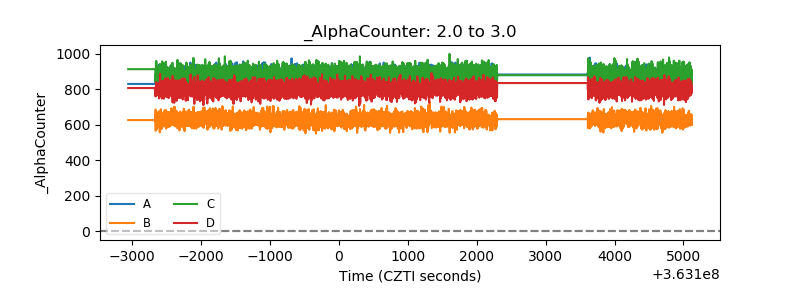 |
| _CPM_Rate | 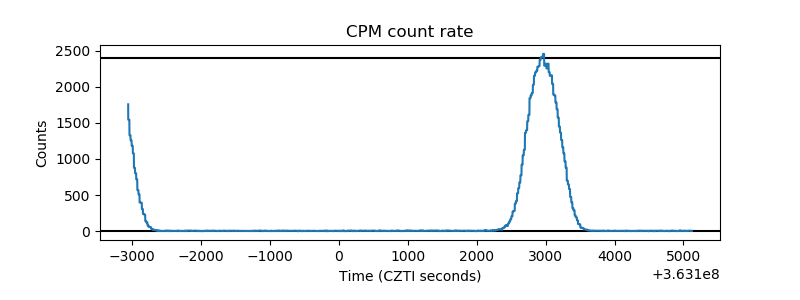 |
| CZT Counter | 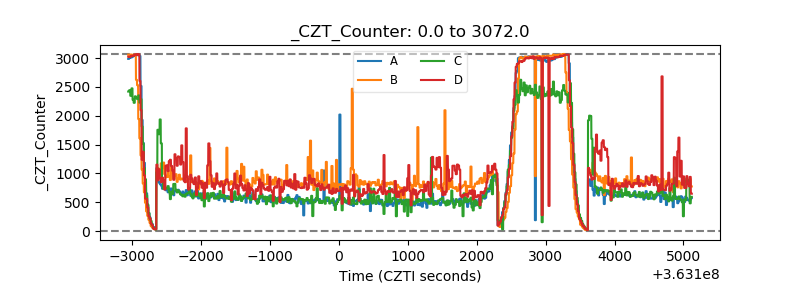 |
| +2.5 Volts monitor |  |
| +5 Volts monitor | 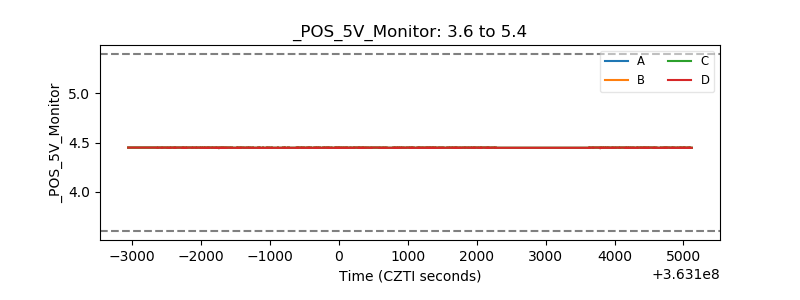 |
| _ROLL_ROT | 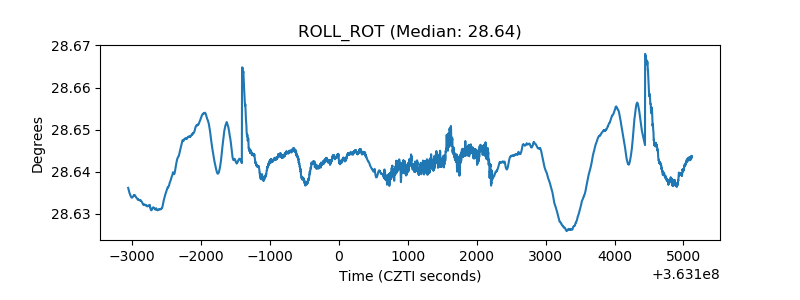 |
| _Roll_DEC | 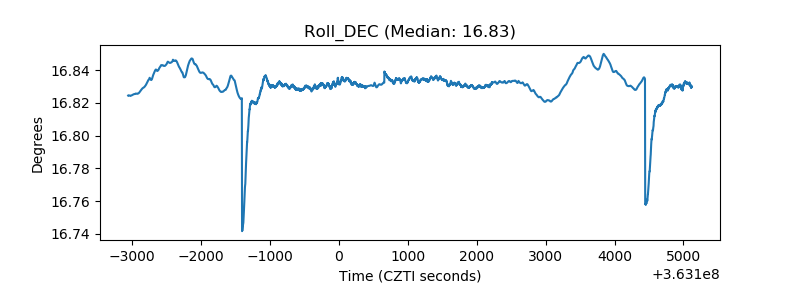 |
| _Roll_RA | 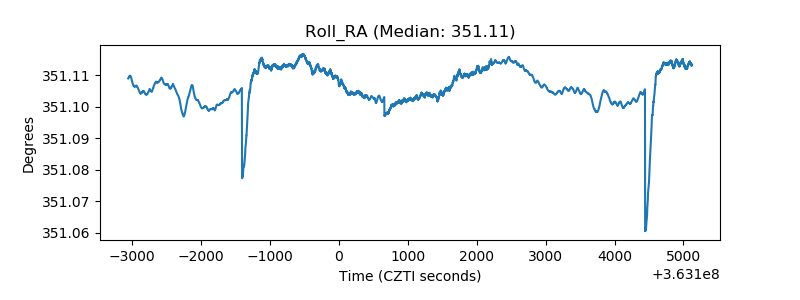 |
| Veto Counter | 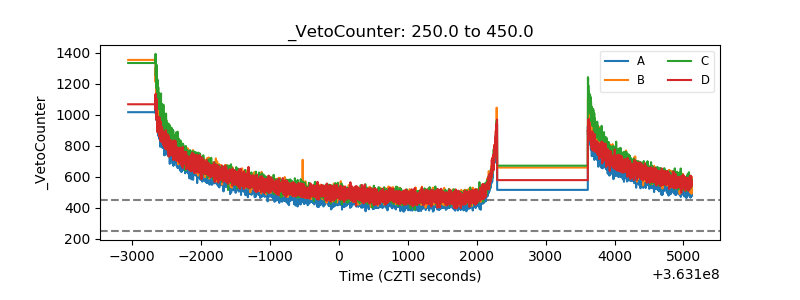 |