| Param | Original file | Final file |
|---|---|---|
| Filename | modeM0/AS1A10_058T02_9000004510_31181cztM0_level2.evt | modeM0/AS1A10_058T02_9000004510_31181cztM0_level2_quad_clean.evt |
| Size (bytes) | 627,137,280 | 83,727,360 |
| Size | 598.1 MB | 79.8 MB |
| Events in quadrant A | 3,405,703 | 539,274 |
| Events in quadrant B | 5,693,990 | 533,637 |
| Events in quadrant C | 3,847,376 | 514,034 |
| Events in quadrant D | 5,617,148 | 505,681 |
| Mode M0 | |||
|---|---|---|---|
| Quadrant | BADHDUFLAG | Total packets | Discarded packets |
| A | 0 | 14043 | 2 |
| B | 0 | 21069 | 2 |
| C | 0 | 15418 | 2 |
| D | 0 | 21274 | 2 |
| Mode SS | |||
|---|---|---|---|
| Quadrant | BADHDUFLAG | Total packets | Discarded packets |
| A | 0 | 128 | 0 |
| B | 0 | 128 | 0 |
| C | 0 | 128 | 0 |
| D | 0 | 128 | 0 |
| Mode M9 | |||
|---|---|---|---|
| Quadrant | BADHDUFLAG | Total packets | Discarded packets |
| A | 0 | 23 | 0 |
| B | 0 | 24 | 0 |
| C | 0 | 24 | 0 |
| D | 0 | 24 | 0 |
| Quadrant | Total seconds | Saturated seconds | Saturation percentage |
|---|---|---|---|
| A | 6348 | 82 | 1.291745% |
| B | 6348 | 448 | 7.057341% |
| C | 6348 | 425 | 6.695022% |
| D | 6348 | 159 | 2.504726% |
Noise dominated data is calculated using 1-second bins in cleaned event files. If a bin has >2000 counts, and if more than 50% of those come from <1% of pixels, then it is considered to be noise-dominated and hence unusable.
| Quadrant | # 1 sec bins | Bins with >0 counts | Bins with >2000 counts | High rate bins dominated by noise | Noise dominated (total time) | Noise dominated (detector-on time) | Marked lightcurve |
|---|---|---|---|---|---|---|---|
| A | 7513 | 6349 | 1 | 1 | 0.01% | 0.02% | 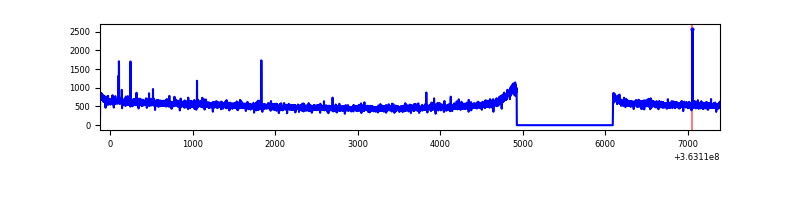 |
| B | 7513 | 6349 | 132 | 132 | 1.76% | 2.08% | 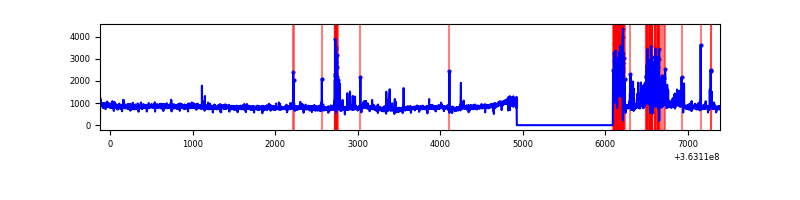 |
| C | 7513 | 6349 | 45 | 45 | 0.60% | 0.71% | 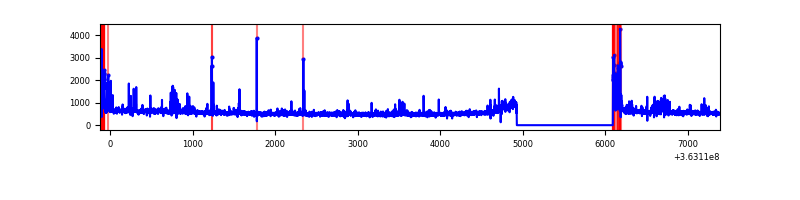 |
| D | 7513 | 6349 | 18 | 18 | 0.24% | 0.28% | 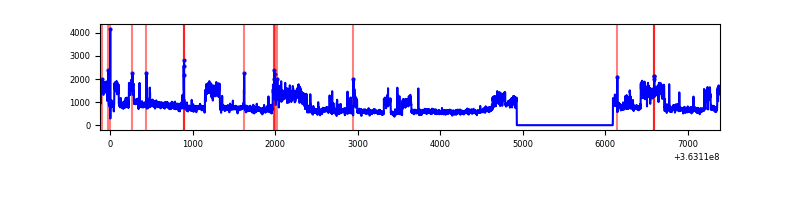 |
Top three noisy pixels from each quadrant. If the there are fewer than three noisy pixels in the level2.evt file, extra rows are filled as -1
| Pixel properties | Quadrant properties | ||||||
|---|---|---|---|---|---|---|---|
| Quadrant | DetID | PixID | Counts | Sigma | Mean | Median | Sigma |
| A | 12 | 96 | 23263 | 128.5 | 877 | 863 | 174.3 |
| A | 13 | 254 | 12304 | 65.63 | 877 | 863 | 174.3 |
| A | 3 | 137 | 8593 | 44.34 | 877 | 863 | 174.3 |
| B | 6 | 159 | 1698387 | 10585.84 | 845 | 827 | 160.4 |
| B | 4 | 80 | 568111 | 3537.53 | 845 | 827 | 160.4 |
| B | 0 | 190 | 49971 | 306.46 | 845 | 827 | 160.4 |
| C | 0 | 10 | 339504 | 1764.6 | 825 | 834 | 191.9 |
| C | 14 | 238 | 182182 | 944.89 | 825 | 834 | 191.9 |
| C | 14 | 254 | 68319 | 351.62 | 825 | 834 | 191.9 |
| D | 8 | 195 | 2246850 | 11188.31 | 851 | 831 | 200.7 |
| D | 2 | 250 | 79902 | 393.88 | 851 | 831 | 200.7 |
| D | 2 | 69 | 31494 | 152.74 | 851 | 831 | 200.7 |
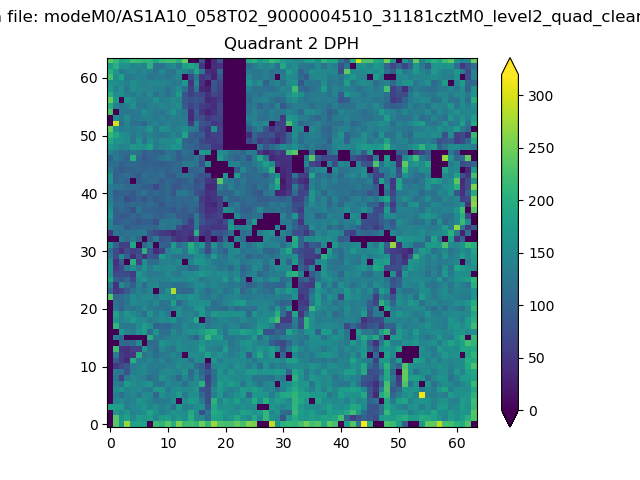
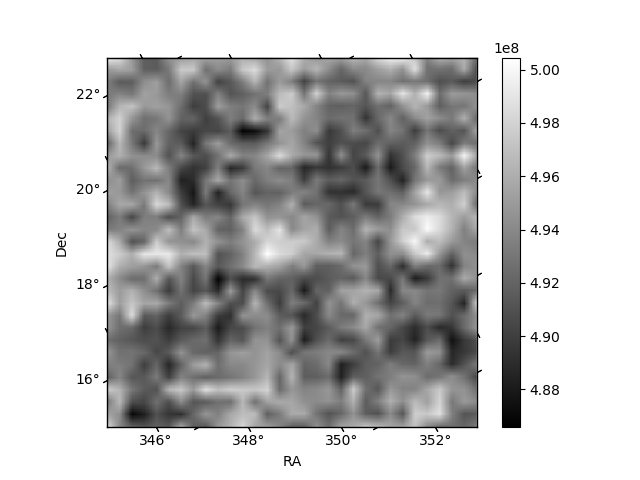
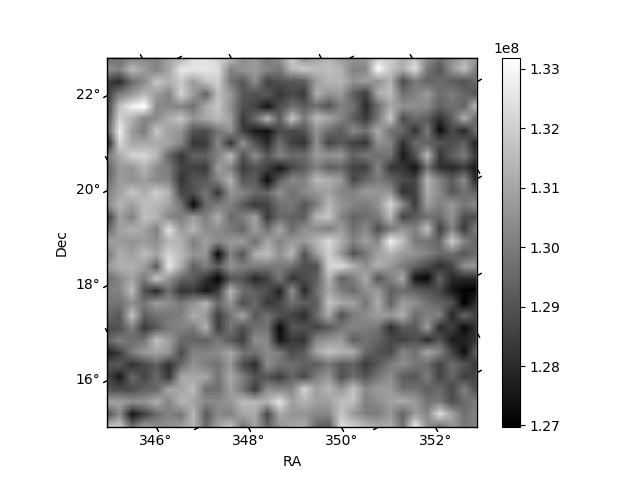
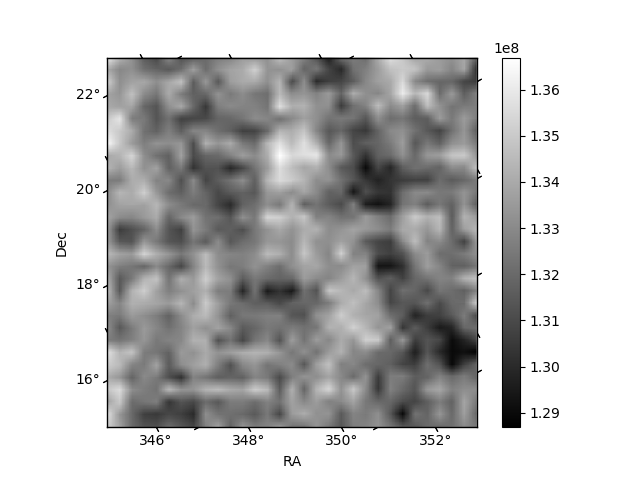
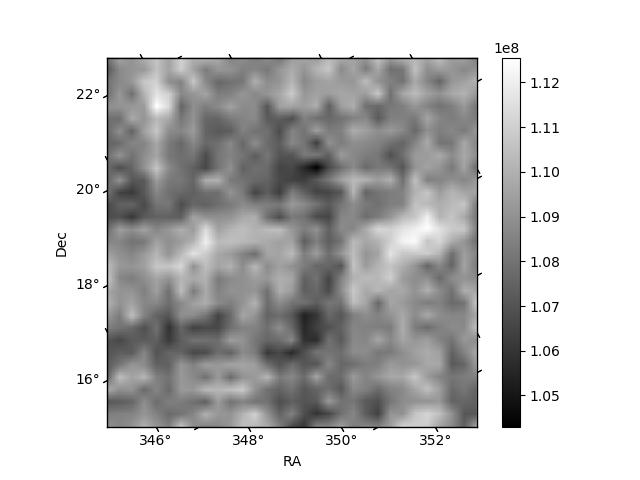
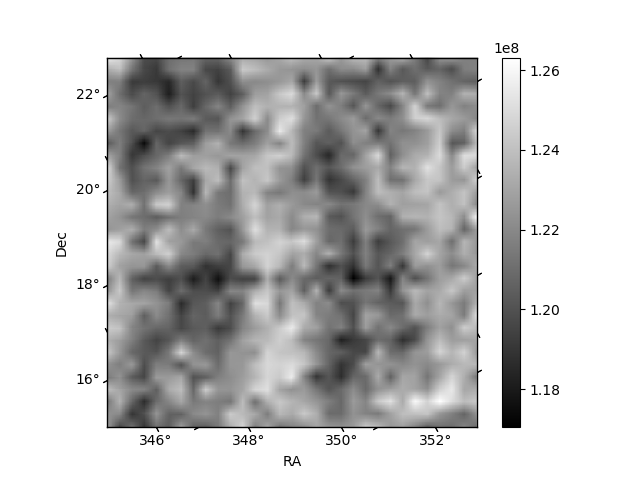
Histogram calculated using DETX and DETY for each event in the final _common_clean file
| Quadrant A | 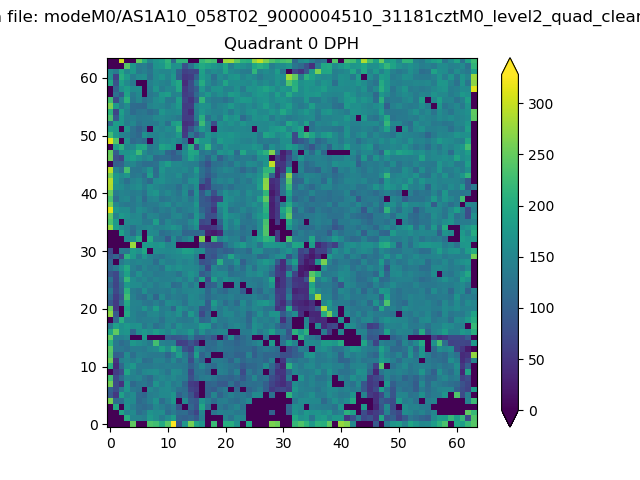 |
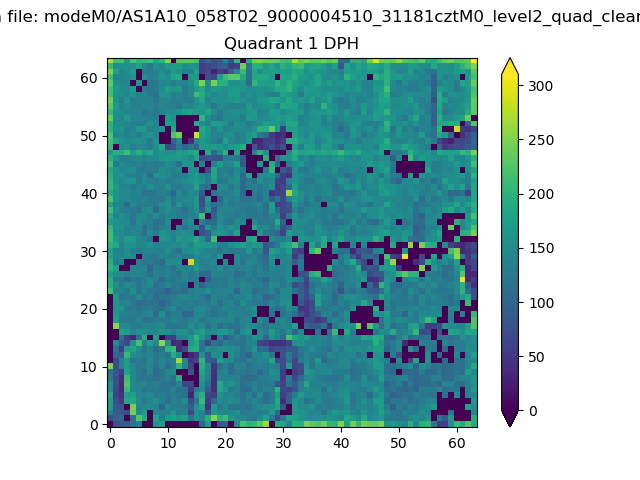 |
Quadrant B |
|---|---|---|---|
| Quadrant D | 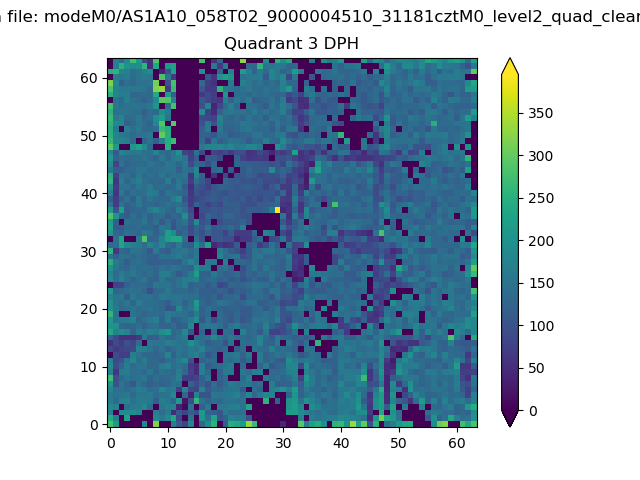 |
 |
Quadrant C |
| Plot type | Count rate plots | Images |
|---|---|---|
| Comparison with Poisson distribution Blue bars denote a histogram of data divided into 1 sec bins. Red curve is a Poisson curve with rate = median count rate of data. |
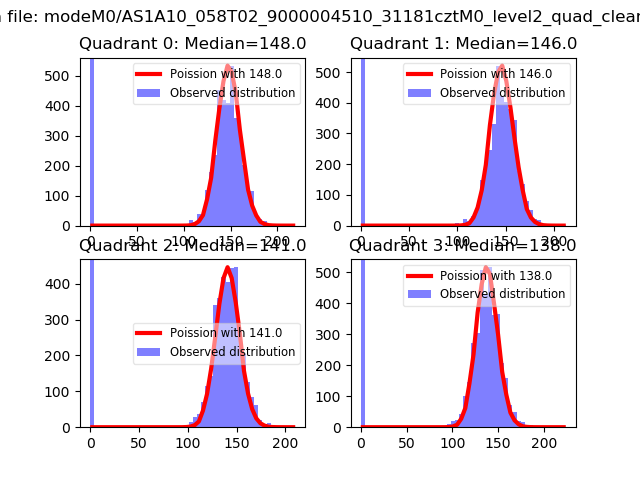 |
 |
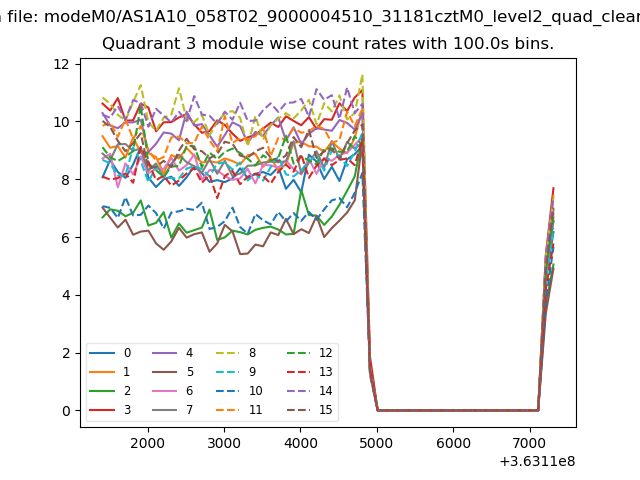
| Quadrant-wise count rates Data is divided into 100 sec bins |
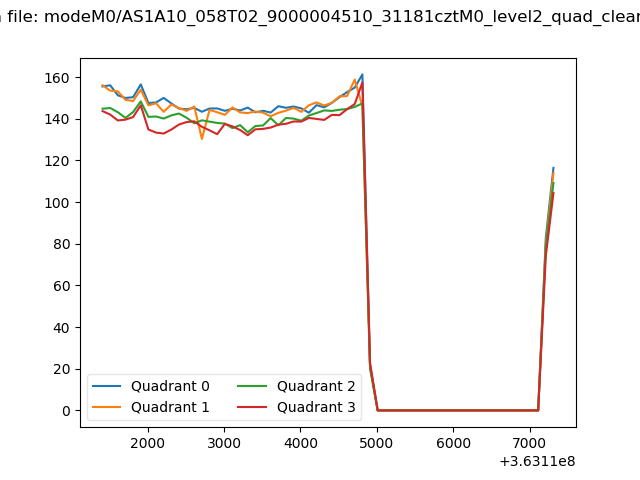 |
|
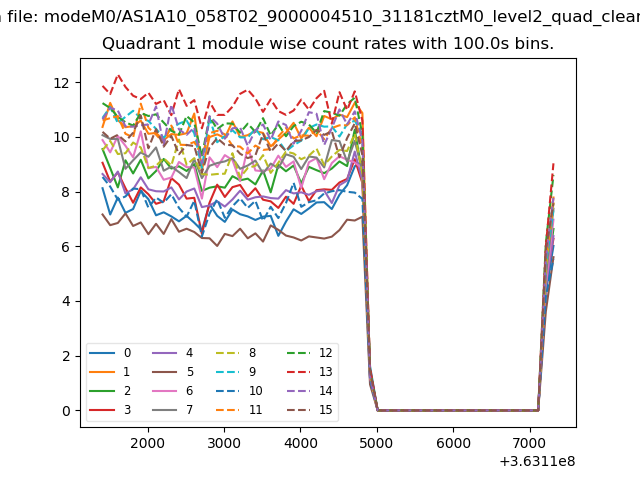
| Module-wise count rates for Quadrant A Data is divided into 100 sec bins |
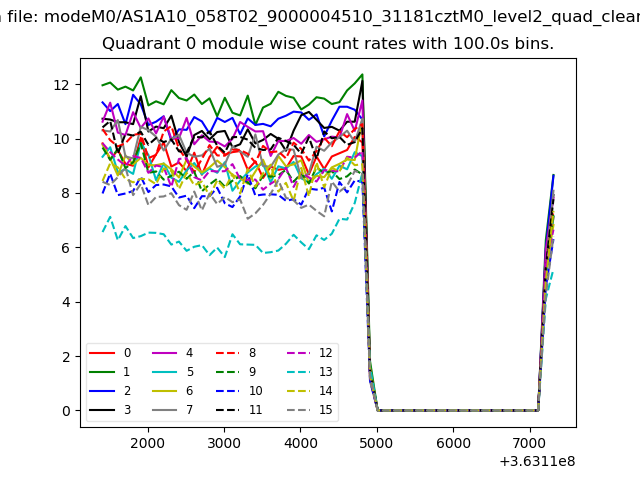 |
 |
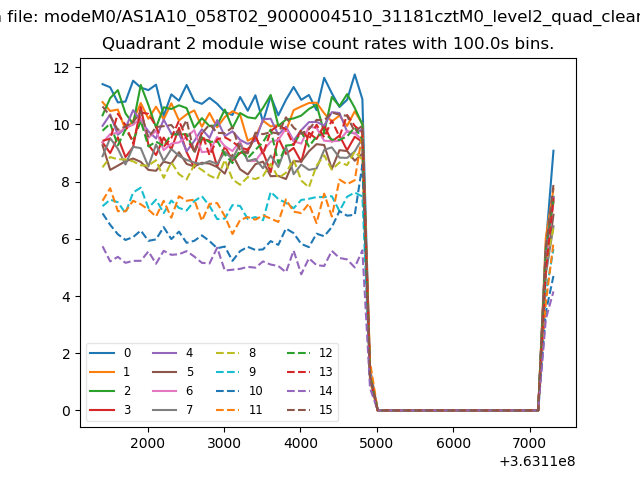
| Module-wise count rates for Quadrant B Data is divided into 100 sec bins |
 |
 |
| Module-wise count rates for Quadrant C Data is divided into 100 sec bins |
 |
 |
| Module-wise count rates for Quadrant D Data is divided into 100 sec bins |
 |
 |
| Parameter | Plot |
|---|---|
| CZT HV Monitor | 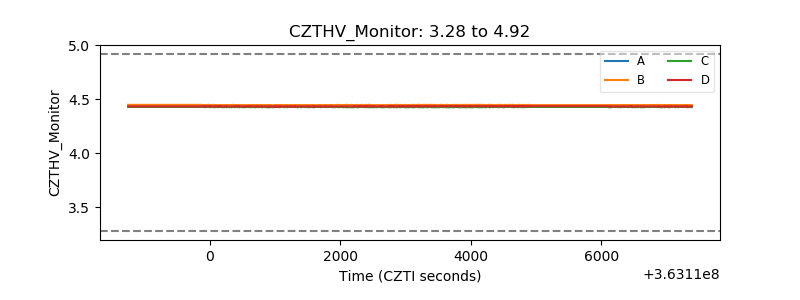 |
| D_VDD | 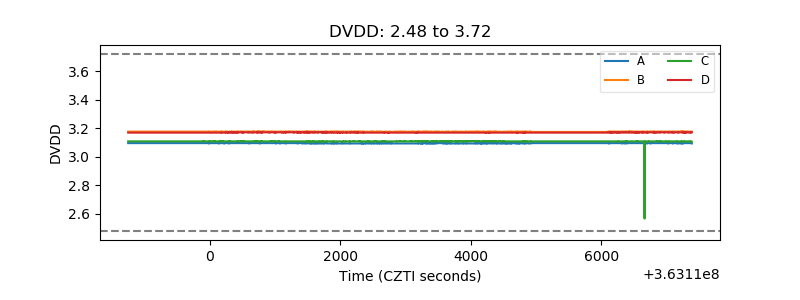 |
| Temperature 1 | 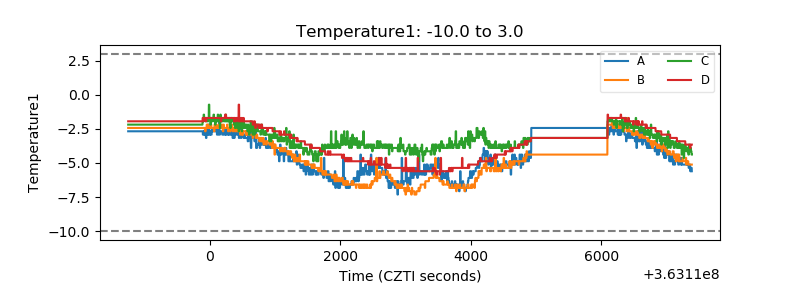 |
| Veto HV Monitor | 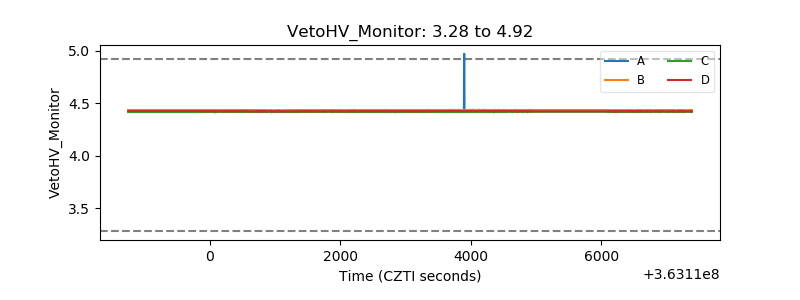 |
| Veto LLD | 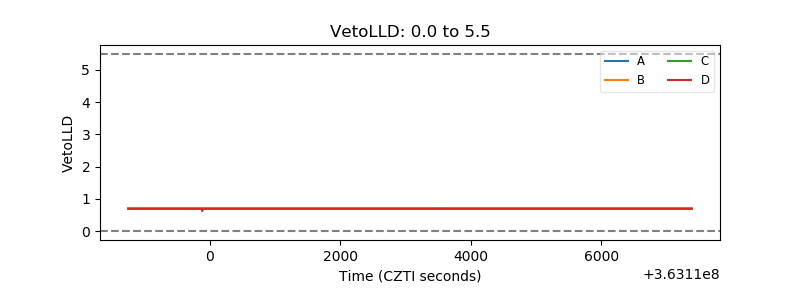 |
| Alpha Counter | 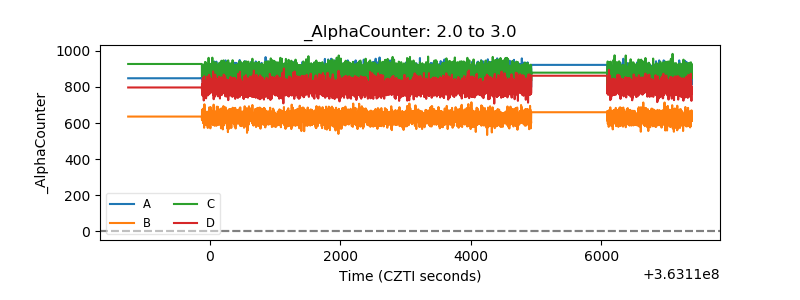 |
| _CPM_Rate | 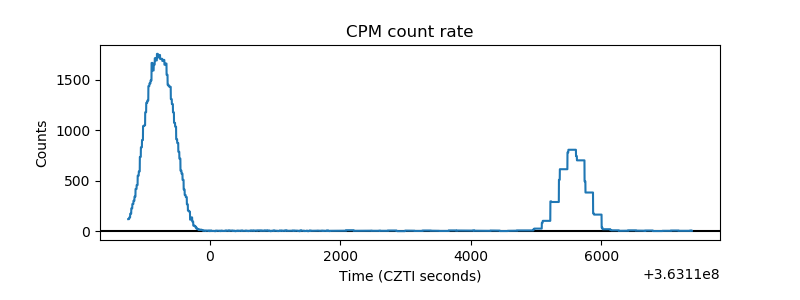 |
| CZT Counter | 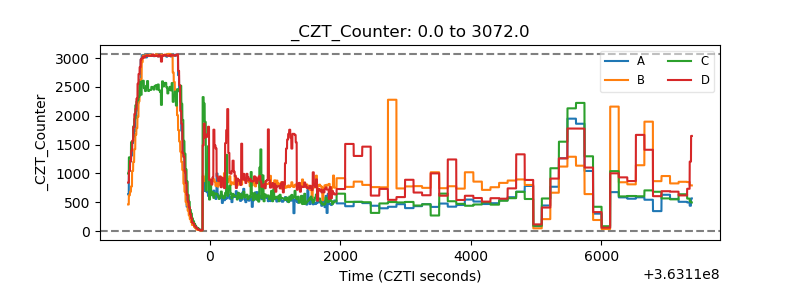 |
| +2.5 Volts monitor |  |
| +5 Volts monitor |  |
| _ROLL_ROT | 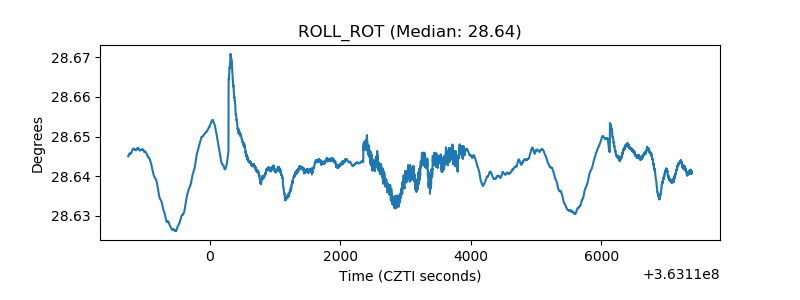 |
| _Roll_DEC | 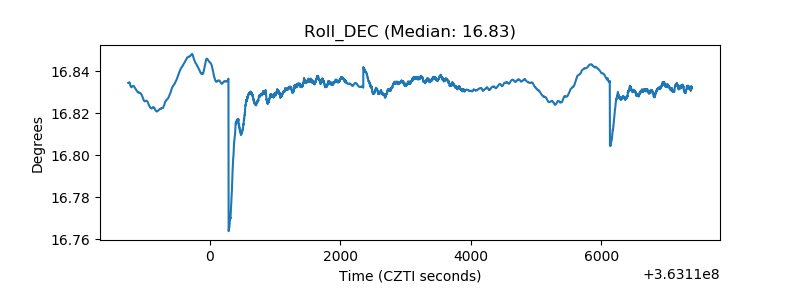 |
| _Roll_RA | 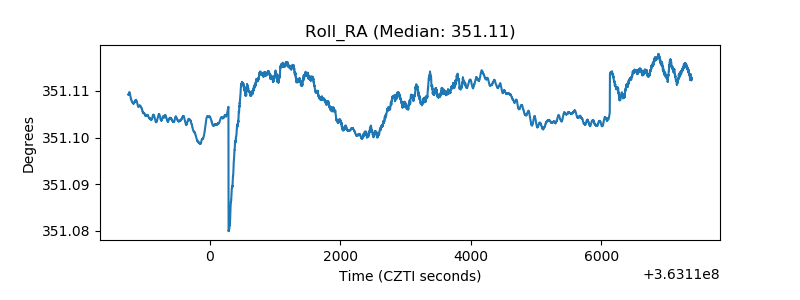 |
| Veto Counter | 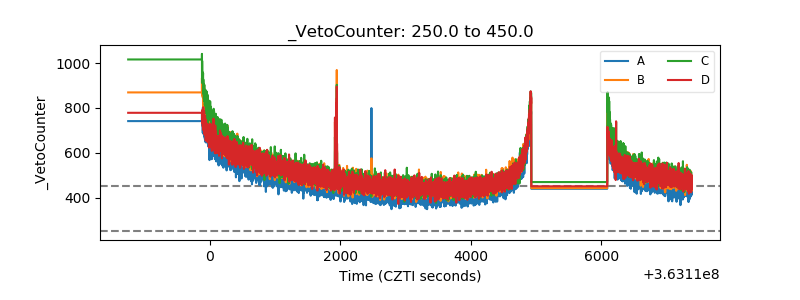 |