| Param | Original file | Final file |
|---|---|---|
| Filename | modeM0/AS1A10_058T02_9000004510_31182cztM0_level2.evt | modeM0/AS1A10_058T02_9000004510_31182cztM0_level2_quad_clean.evt |
| Size (bytes) | 676,160,640 | 92,257,920 |
| Size | 644.8 MB | 88.0 MB |
| Events in quadrant A | 3,626,690 | 602,506 |
| Events in quadrant B | 6,628,058 | 575,857 |
| Events in quadrant C | 3,923,560 | 574,749 |
| Events in quadrant D | 5,833,420 | 560,417 |
| Mode M0 | |||
|---|---|---|---|
| Quadrant | BADHDUFLAG | Total packets | Discarded packets |
| A | 0 | 14966 | 2 |
| B | 0 | 24424 | 2 |
| C | 0 | 15854 | 2 |
| D | 0 | 22370 | 2 |
| Mode SS | |||
|---|---|---|---|
| Quadrant | BADHDUFLAG | Total packets | Discarded packets |
| A | 0 | 142 | 0 |
| B | 0 | 142 | 0 |
| C | 0 | 142 | 0 |
| D | 0 | 142 | 0 |
| Mode M9 | |||
|---|---|---|---|
| Quadrant | BADHDUFLAG | Total packets | Discarded packets |
| A | 0 | 20 | 0 |
| B | 0 | 20 | 0 |
| C | 0 | 20 | 0 |
| D | 0 | 20 | 0 |
| Quadrant | Total seconds | Saturated seconds | Saturation percentage |
|---|---|---|---|
| A | 6889 | 163 | 2.366091% |
| B | 6889 | 875 | 12.701408% |
| C | 6889 | 546 | 7.925679% |
| D | 6889 | 301 | 4.369284% |
Noise dominated data is calculated using 1-second bins in cleaned event files. If a bin has >2000 counts, and if more than 50% of those come from <1% of pixels, then it is considered to be noise-dominated and hence unusable.
| Quadrant | # 1 sec bins | Bins with >0 counts | Bins with >2000 counts | High rate bins dominated by noise | Noise dominated (total time) | Noise dominated (detector-on time) | Marked lightcurve |
|---|---|---|---|---|---|---|---|
| A | 8904 | 6891 | 5 | 5 | 0.06% | 0.07% | 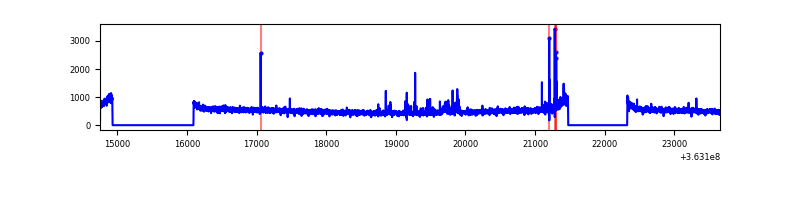 |
| B | 8904 | 6891 | 313 | 313 | 3.52% | 4.54% | 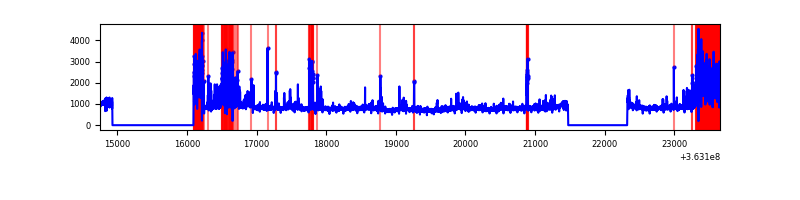 |
| C | 8904 | 6891 | 33 | 33 | 0.37% | 0.48% | 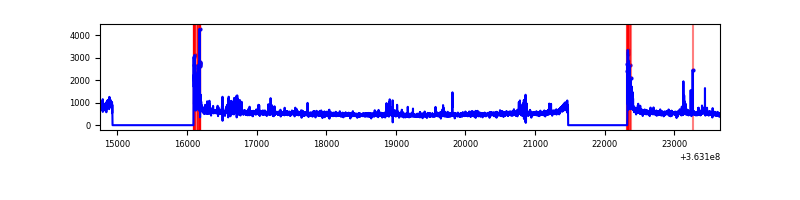 |
| D | 8904 | 6891 | 109 | 109 | 1.22% | 1.58% | 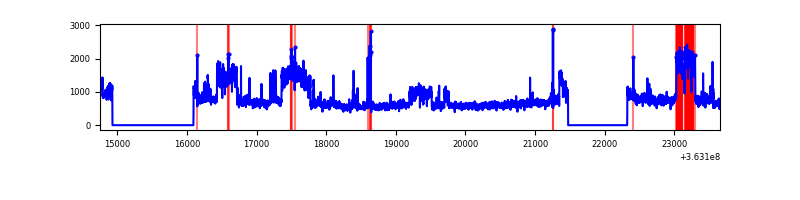 |
Top three noisy pixels from each quadrant. If the there are fewer than three noisy pixels in the level2.evt file, extra rows are filled as -1
| Pixel properties | Quadrant properties | ||||||
|---|---|---|---|---|---|---|---|
| Quadrant | DetID | PixID | Counts | Sigma | Mean | Median | Sigma |
| A | 12 | 96 | 93885 | 508.78 | 915 | 896 | 182.8 |
| A | 13 | 254 | 15091 | 77.66 | 915 | 896 | 182.8 |
| A | 3 | 137 | 9450 | 46.8 | 915 | 896 | 182.8 |
| B | 6 | 159 | 1820252 | 10744.8 | 865 | 843 | 169.3 |
| B | 4 | 80 | 1224462 | 7226.27 | 865 | 843 | 169.3 |
| B | 0 | 190 | 57253 | 333.14 | 865 | 843 | 169.3 |
| C | 0 | 10 | 225336 | 1119.59 | 857 | 865 | 200.5 |
| C | 14 | 238 | 212449 | 1055.32 | 857 | 865 | 200.5 |
| C | 14 | 254 | 106129 | 525.03 | 857 | 865 | 200.5 |
| D | 8 | 195 | 2329759 | 11026.05 | 885 | 865 | 211.2 |
| D | 2 | 250 | 73970 | 346.11 | 885 | 865 | 211.2 |
| D | 2 | 69 | 52717 | 245.49 | 885 | 865 | 211.2 |
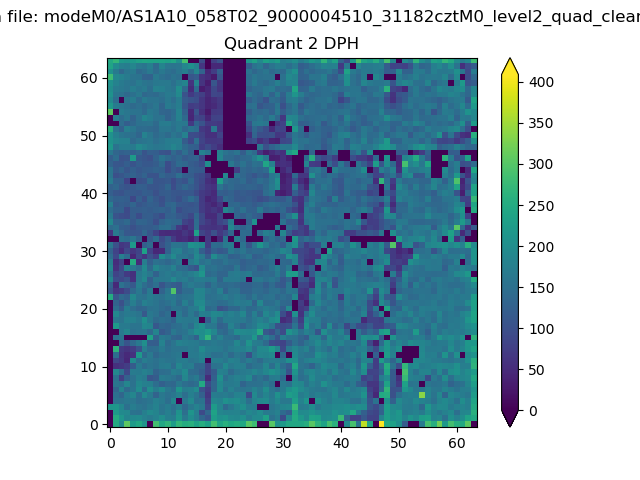
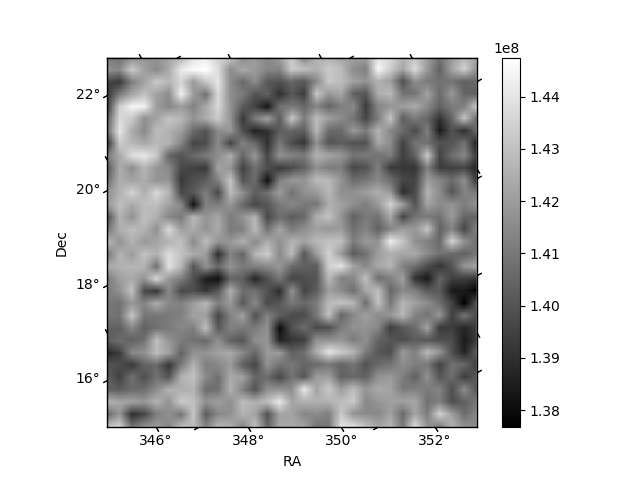
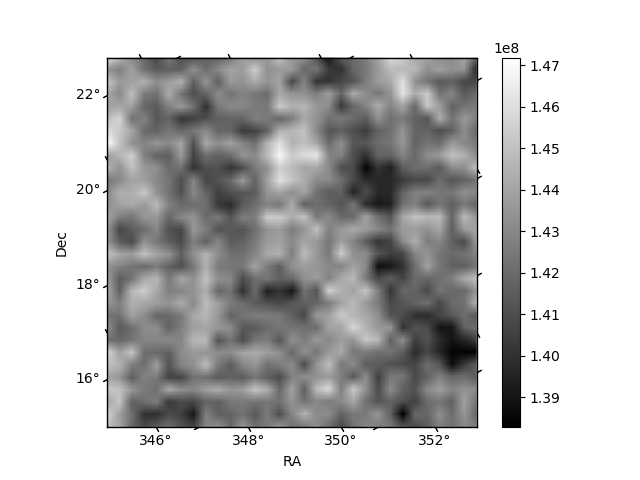
Histogram calculated using DETX and DETY for each event in the final _common_clean file
| Quadrant A | 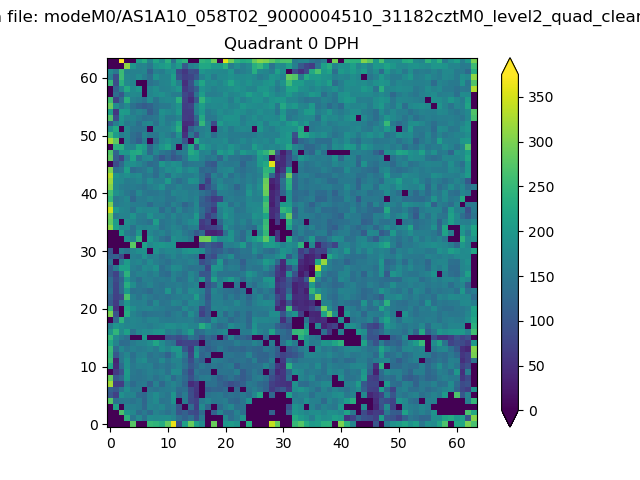 |
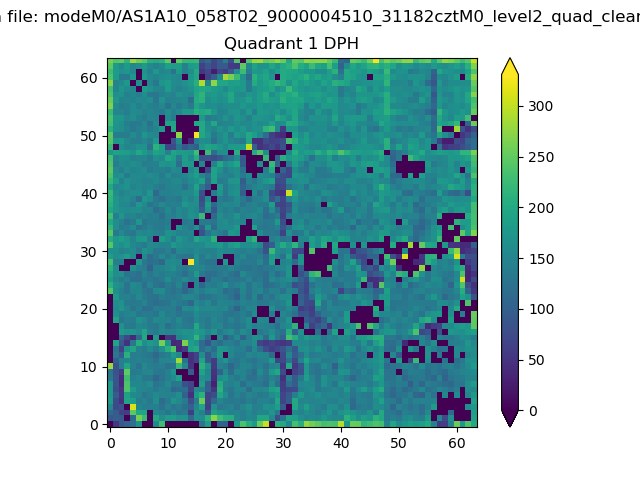 |
Quadrant B |
|---|---|---|---|
| Quadrant D | 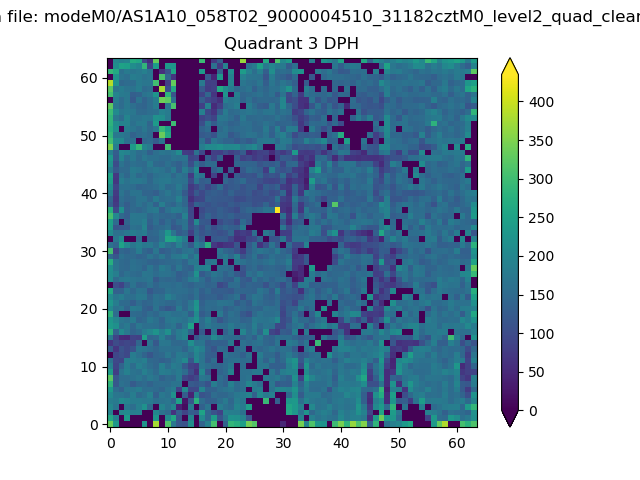 |
 |
Quadrant C |
| Plot type | Count rate plots | Images |
|---|---|---|
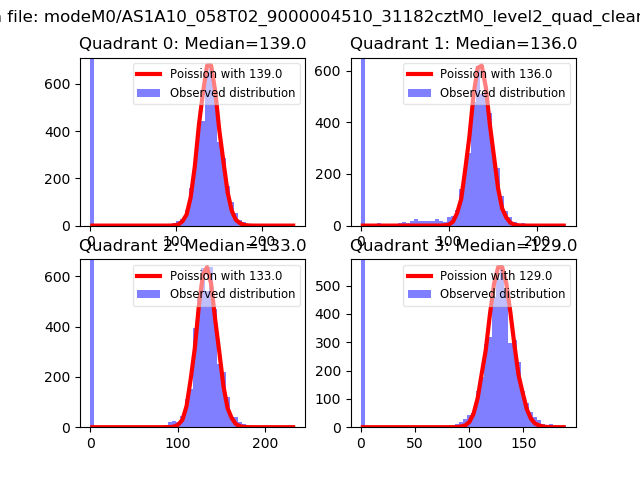
| Comparison with Poisson distribution Blue bars denote a histogram of data divided into 1 sec bins. Red curve is a Poisson curve with rate = median count rate of data. |
 |
 |
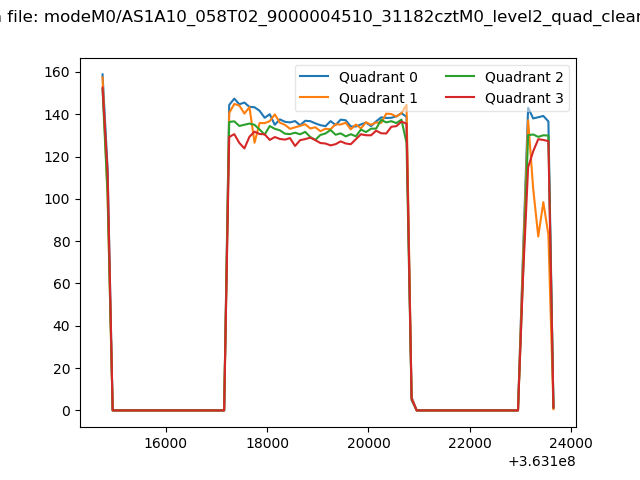
| Quadrant-wise count rates Data is divided into 100 sec bins |
 |
|
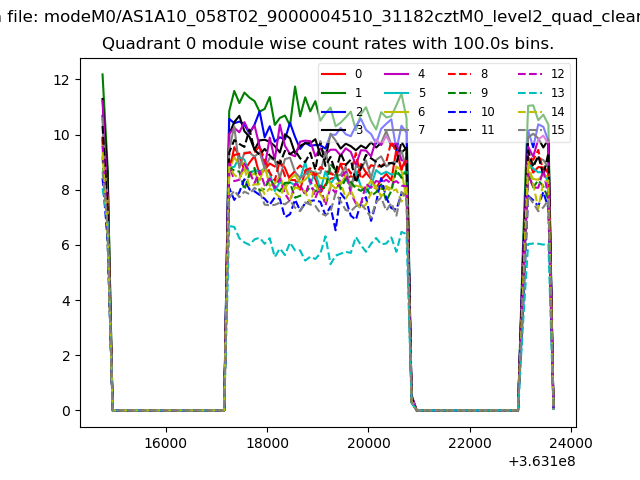
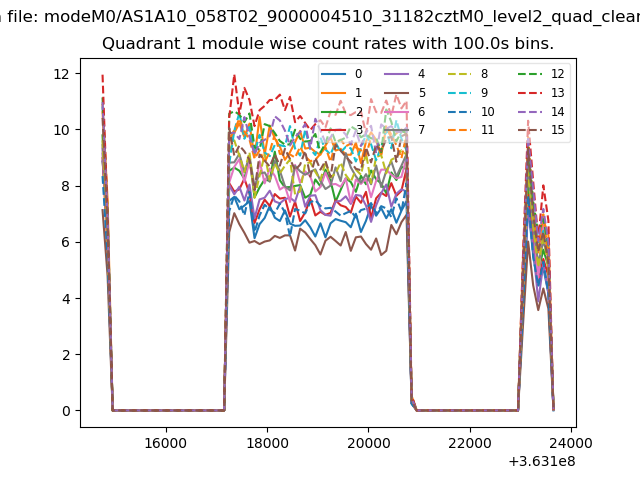
| Module-wise count rates for Quadrant A Data is divided into 100 sec bins |
 |
 |
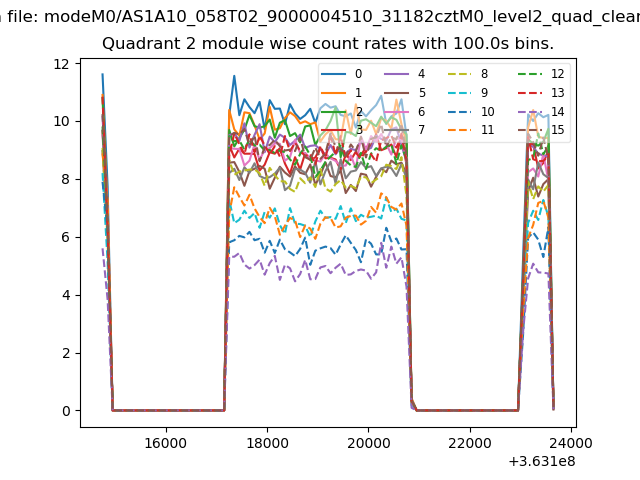
| Module-wise count rates for Quadrant B Data is divided into 100 sec bins |
 |
 |
| Module-wise count rates for Quadrant C Data is divided into 100 sec bins |
 |
 |
| Module-wise count rates for Quadrant D Data is divided into 100 sec bins |
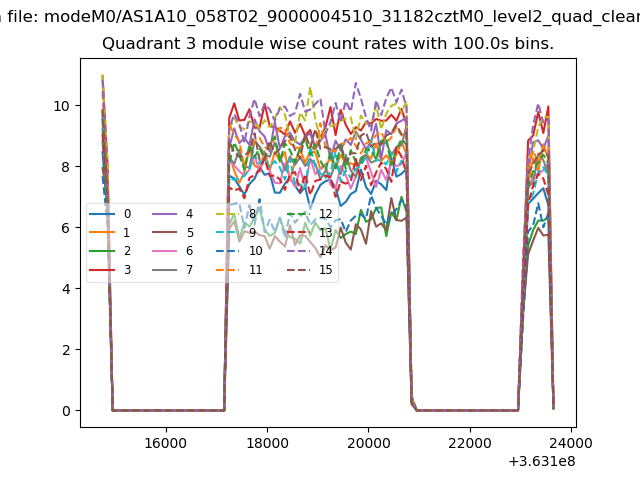 |
 |
| Parameter | Plot |
|---|---|
| CZT HV Monitor | 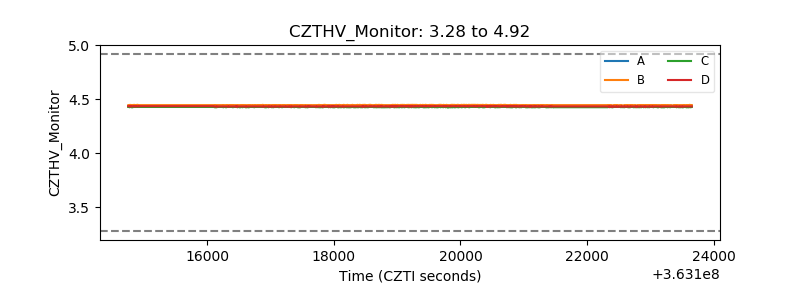 |
| D_VDD | 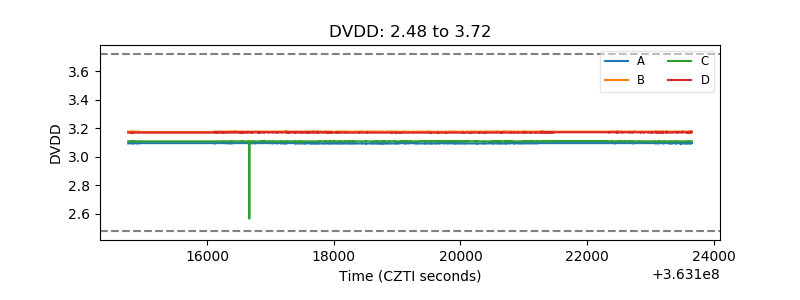 |
| Temperature 1 | 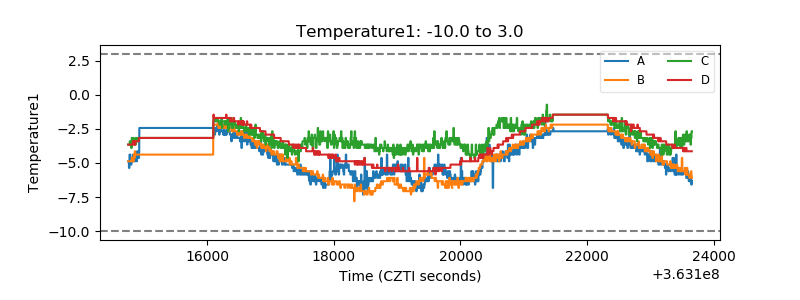 |
| Veto HV Monitor | 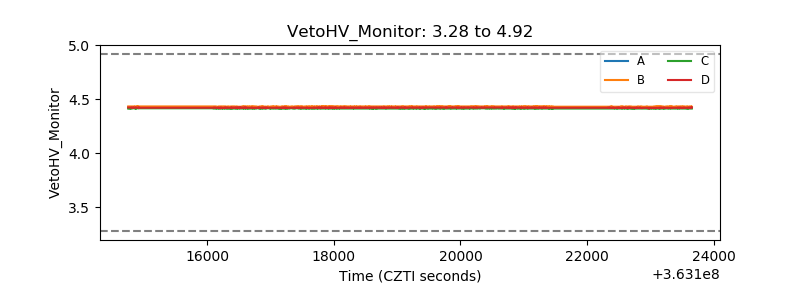 |
| Veto LLD | 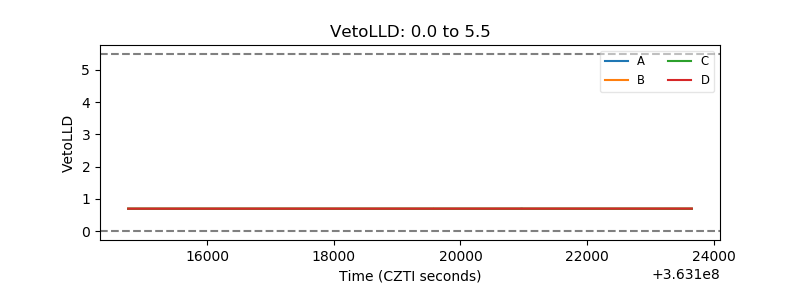 |
| Alpha Counter | 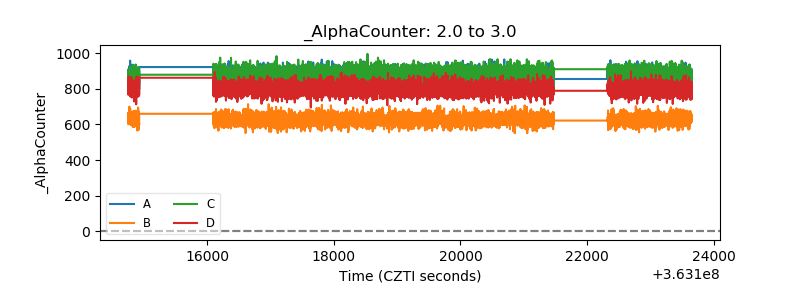 |
| _CPM_Rate | 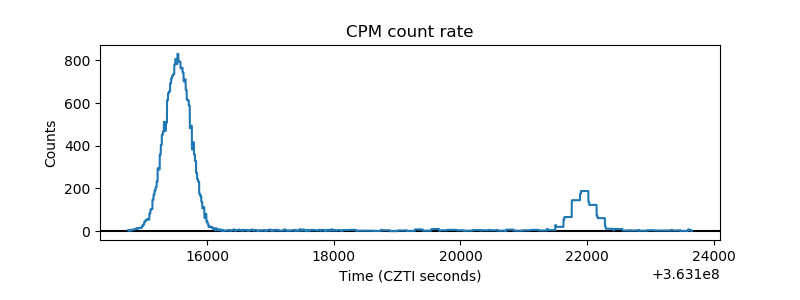 |
| CZT Counter | 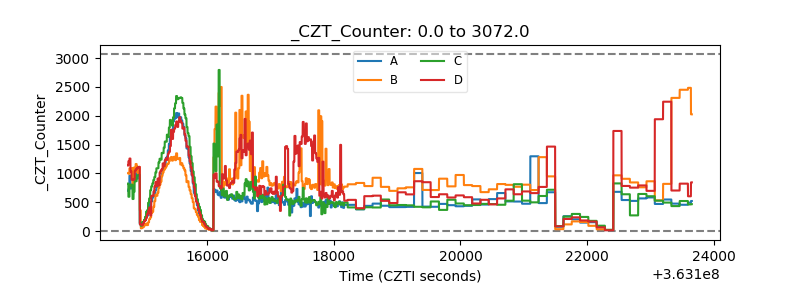 |
| +2.5 Volts monitor |  |
| +5 Volts monitor |  |
| _ROLL_ROT | 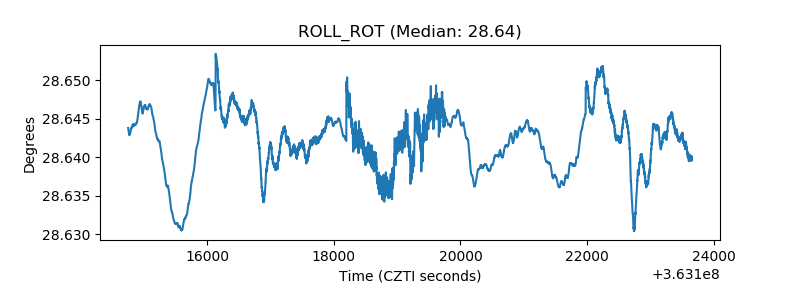 |
| _Roll_DEC | 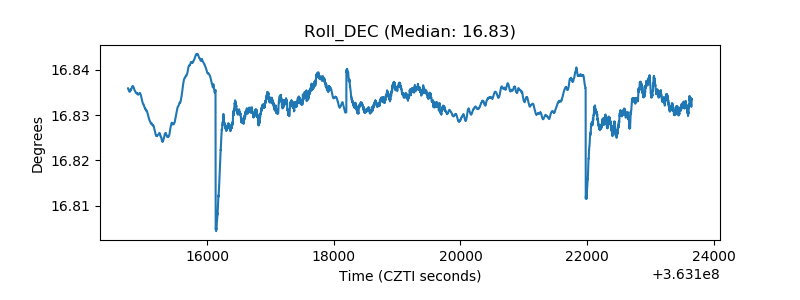 |
| _Roll_RA | 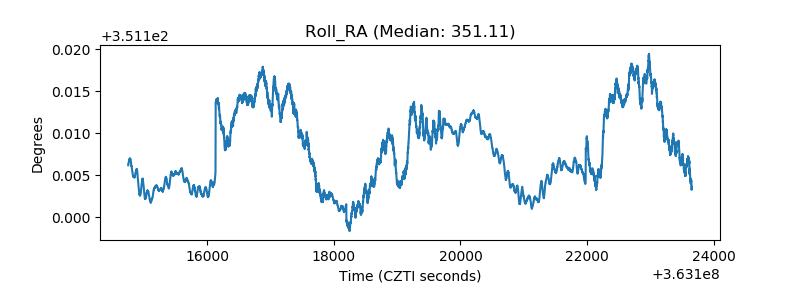 |
| Veto Counter | 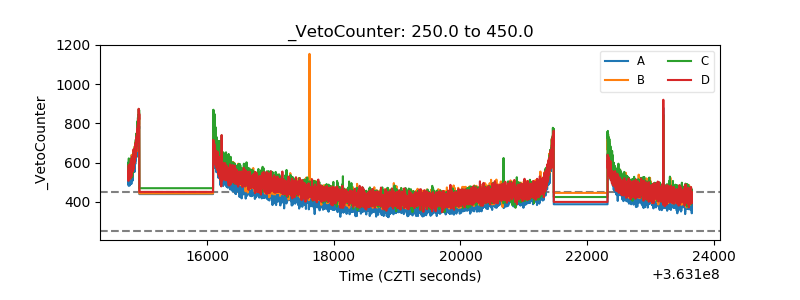 |