| Param | Original file | Final file |
|---|---|---|
| Filename | modeM0/AS1A10_058T02_9000004510_31183cztM0_level2.evt | modeM0/AS1A10_058T02_9000004510_31183cztM0_level2_quad_clean.evt |
| Size (bytes) | 718,107,840 | 93,435,840 |
| Size | 684.8 MB | 89.1 MB |
| Events in quadrant A | 3,541,993 | 613,649 |
| Events in quadrant B | 6,814,161 | 568,937 |
| Events in quadrant C | 3,621,542 | 587,182 |
| Events in quadrant D | 7,290,615 | 564,720 |
| Mode M0 | |||
|---|---|---|---|
| Quadrant | BADHDUFLAG | Total packets | Discarded packets |
| A | 0 | 15027 | 1 |
| B | 0 | 25187 | 3 |
| C | 0 | 15113 | 1 |
| D | 0 | 26938 | 1 |
| Mode SS | |||
|---|---|---|---|
| Quadrant | BADHDUFLAG | Total packets | Discarded packets |
| A | 0 | 146 | 0 |
| B | 0 | 146 | 0 |
| C | 0 | 146 | 0 |
| D | 0 | 146 | 0 |
| Mode M9 | |||
|---|---|---|---|
| Quadrant | BADHDUFLAG | Total packets | Discarded packets |
| A | 0 | 5 | 0 |
| B | 0 | 5 | 0 |
| C | 0 | 5 | 0 |
| D | 0 | 5 | 0 |
| Quadrant | Total seconds | Saturated seconds | Saturation percentage |
|---|---|---|---|
| A | 7106 | 73 | 1.027301% |
| B | 7106 | 820 | 11.539544% |
| C | 7106 | 187 | 2.631579% |
| D | 7106 | 586 | 8.246552% |
Noise dominated data is calculated using 1-second bins in cleaned event files. If a bin has >2000 counts, and if more than 50% of those come from <1% of pixels, then it is considered to be noise-dominated and hence unusable.
| Quadrant | # 1 sec bins | Bins with >0 counts | Bins with >2000 counts | High rate bins dominated by noise | Noise dominated (total time) | Noise dominated (detector-on time) | Marked lightcurve |
|---|---|---|---|---|---|---|---|
| A | 7566 | 7108 | 8 | 8 | 0.11% | 0.11% | 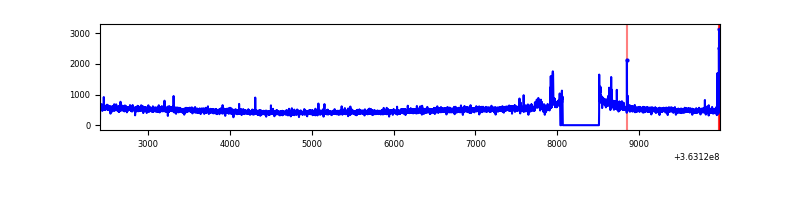 |
| B | 7566 | 7108 | 417 | 417 | 5.51% | 5.87% | 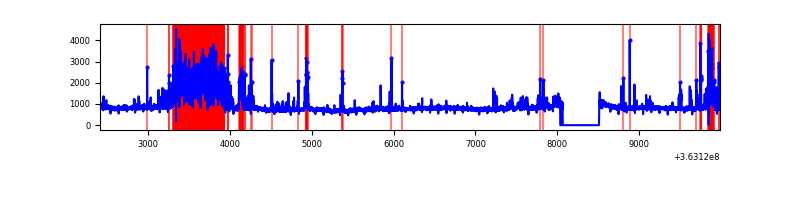 |
| C | 7566 | 7108 | 2 | 2 | 0.03% | 0.03% | 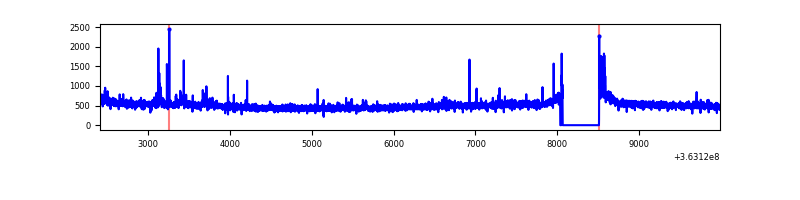 |
| D | 7566 | 7108 | 376 | 376 | 4.97% | 5.29% | 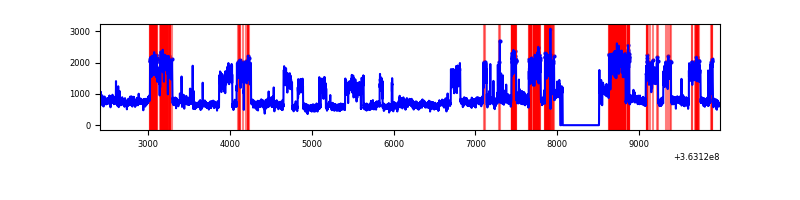 |
Top three noisy pixels from each quadrant. If the there are fewer than three noisy pixels in the level2.evt file, extra rows are filled as -1
| Pixel properties | Quadrant properties | ||||||
|---|---|---|---|---|---|---|---|
| Quadrant | DetID | PixID | Counts | Sigma | Mean | Median | Sigma |
| A | 12 | 96 | 91545 | 509.62 | 893 | 876 | 177.9 |
| A | 13 | 254 | 14969 | 79.21 | 893 | 876 | 177.9 |
| A | 3 | 137 | 9275 | 47.21 | 893 | 876 | 177.9 |
| B | 6 | 159 | 1916861 | 11466.27 | 853 | 831 | 167.1 |
| B | 4 | 80 | 1432086 | 8565.19 | 853 | 831 | 167.1 |
| B | 0 | 190 | 53422 | 314.73 | 853 | 831 | 167.1 |
| C | 14 | 238 | 159440 | 778.07 | 856 | 860 | 203.8 |
| C | 0 | 10 | 64666 | 313.06 | 856 | 860 | 203.8 |
| C | 14 | 254 | 30169 | 143.8 | 856 | 860 | 203.8 |
| D | 8 | 195 | 3967866 | 19489.69 | 853 | 829 | 203.5 |
| D | 2 | 250 | 30153 | 144.07 | 853 | 829 | 203.5 |
| D | 2 | 234 | 28843 | 137.63 | 853 | 829 | 203.5 |
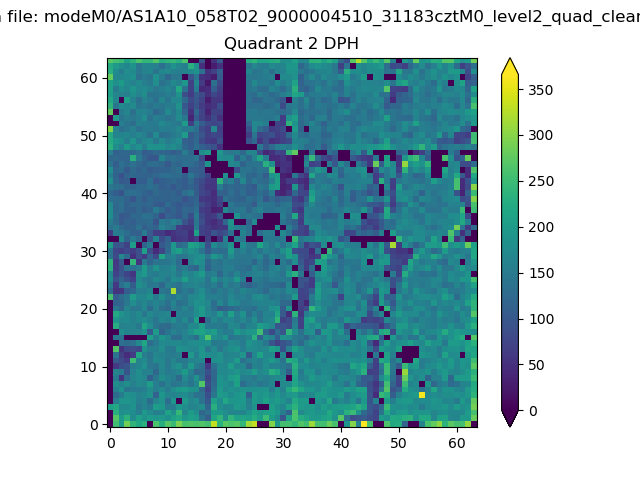
Histogram calculated using DETX and DETY for each event in the final _common_clean file
| Quadrant A | 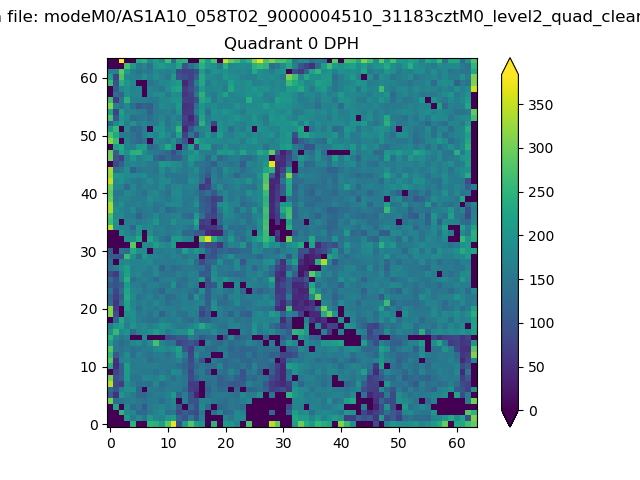 |
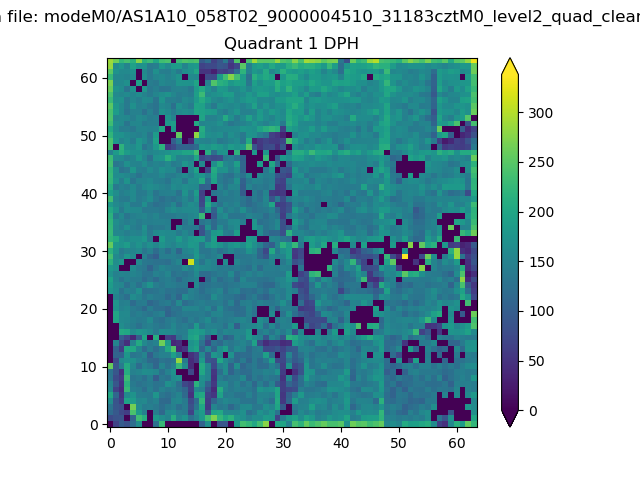 |
Quadrant B |
|---|---|---|---|
| Quadrant D | 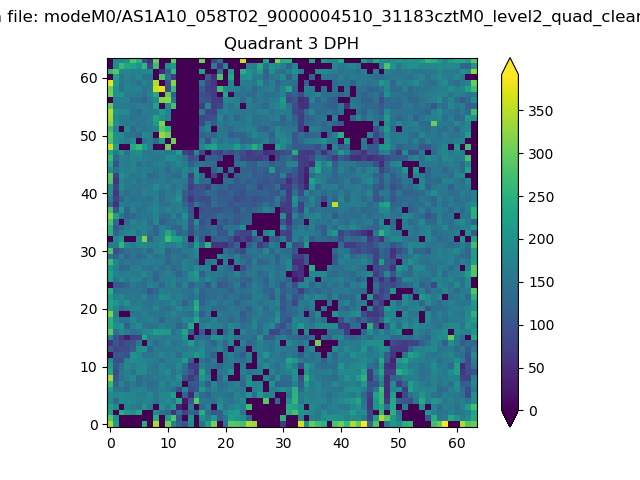 |
 |
Quadrant C |
| Plot type | Count rate plots | Images |
|---|---|---|
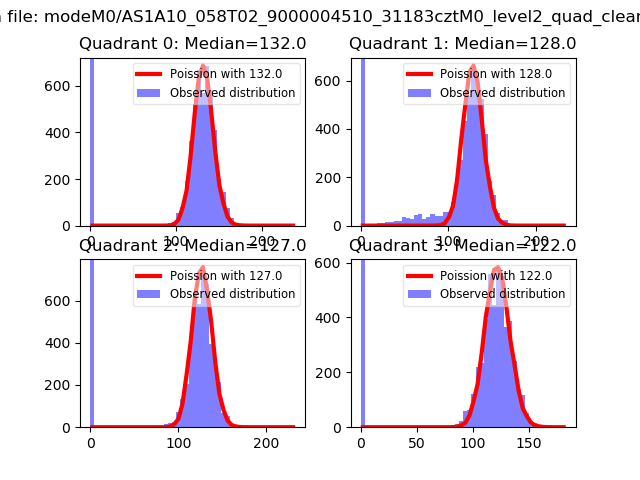
| Comparison with Poisson distribution Blue bars denote a histogram of data divided into 1 sec bins. Red curve is a Poisson curve with rate = median count rate of data. |
 |
 |
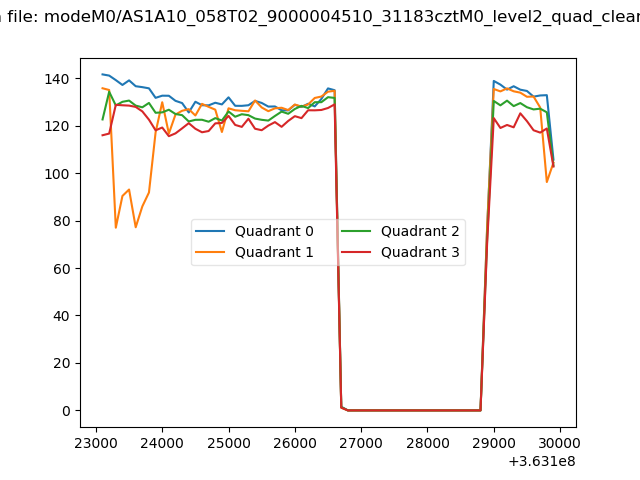
| Quadrant-wise count rates Data is divided into 100 sec bins |
 |
|
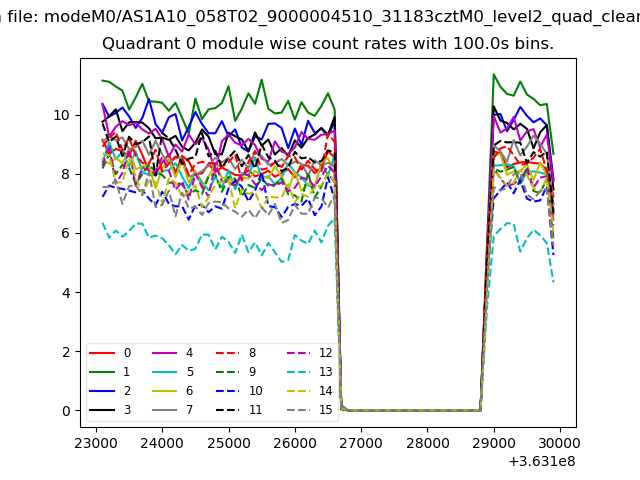
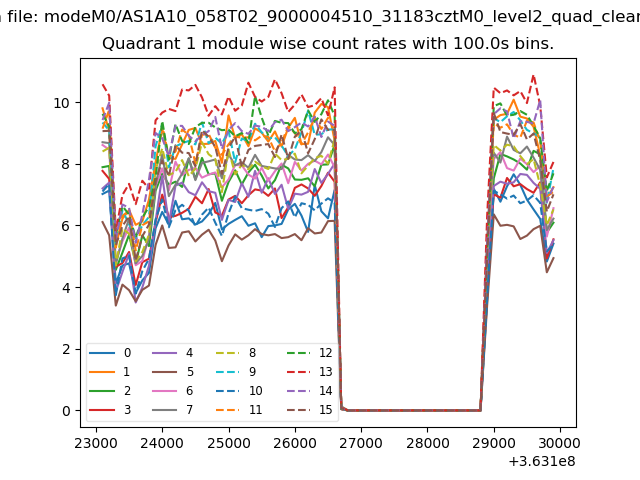
| Module-wise count rates for Quadrant A Data is divided into 100 sec bins |
 |
 |
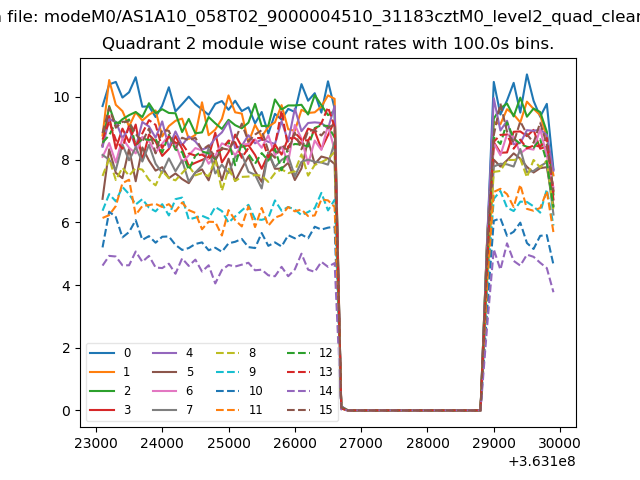
| Module-wise count rates for Quadrant B Data is divided into 100 sec bins |
 |
 |
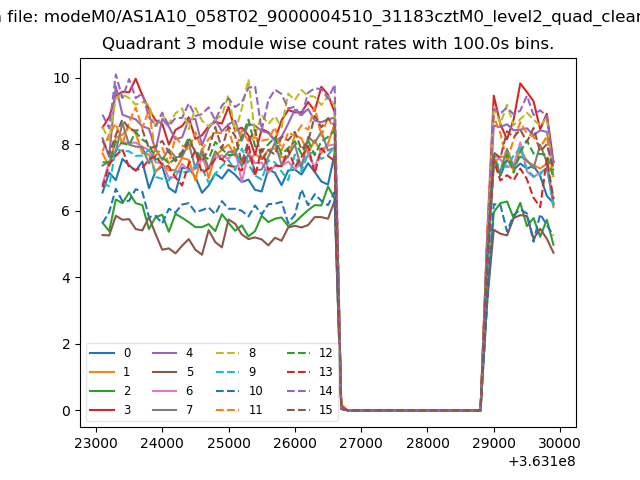
| Module-wise count rates for Quadrant C Data is divided into 100 sec bins |
 |
 |
| Module-wise count rates for Quadrant D Data is divided into 100 sec bins |
 |
 |
| Parameter | Plot |
|---|---|
| CZT HV Monitor | 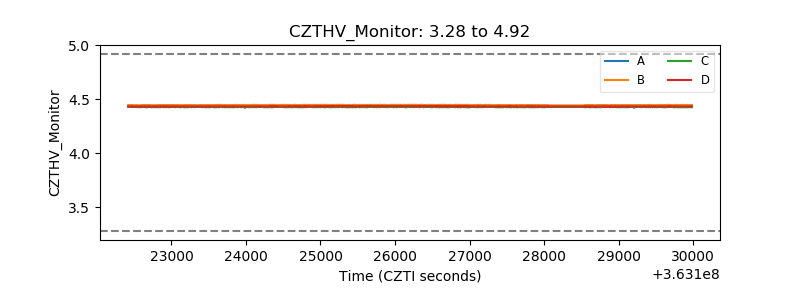 |
| D_VDD | 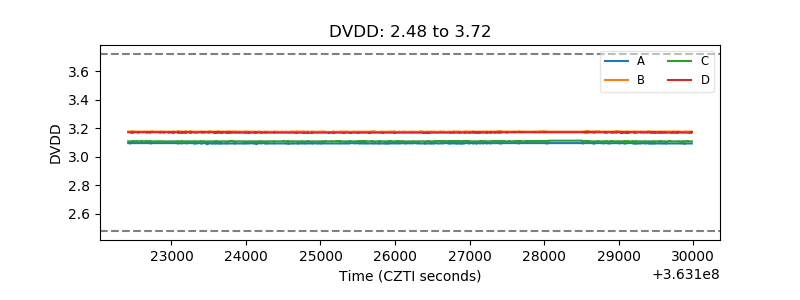 |
| Temperature 1 |  |
| Veto HV Monitor |  |
| Veto LLD |  |
| Alpha Counter | 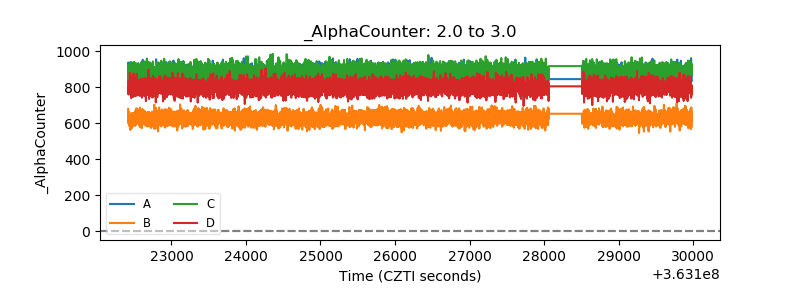 |
| _CPM_Rate | 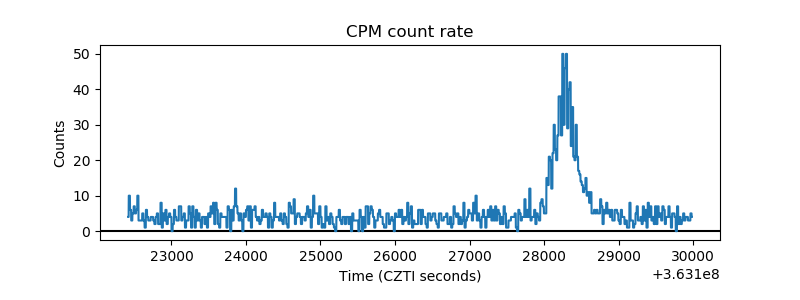 |
| CZT Counter |  |
| +2.5 Volts monitor |  |
| +5 Volts monitor | 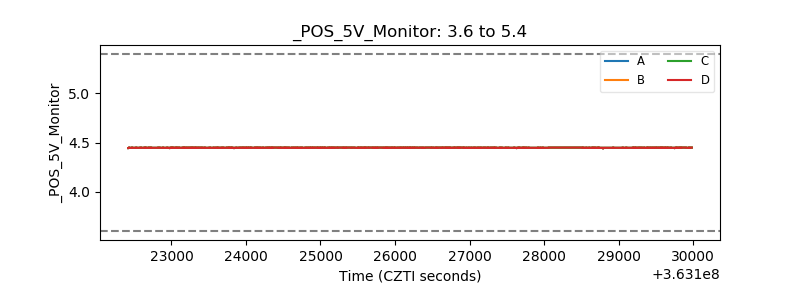 |
| _ROLL_ROT | 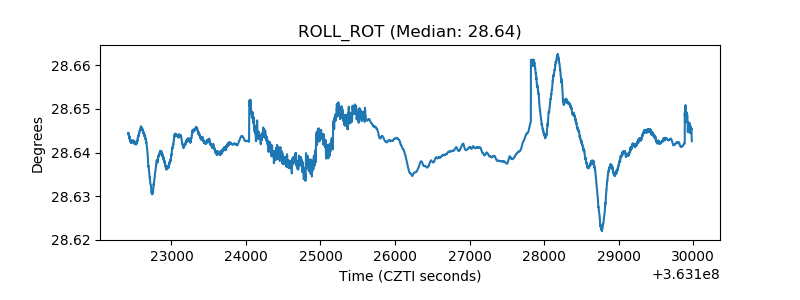 |
| _Roll_DEC | 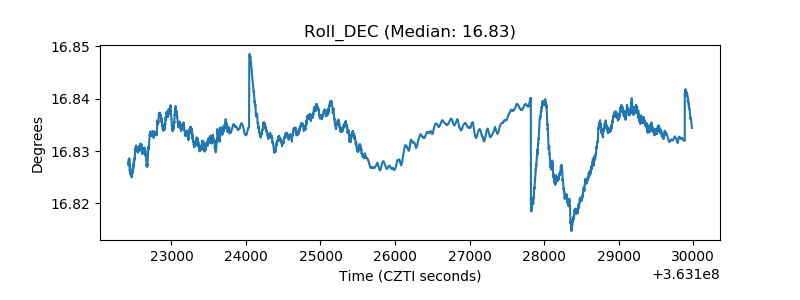 |
| _Roll_RA |  |
| Veto Counter | 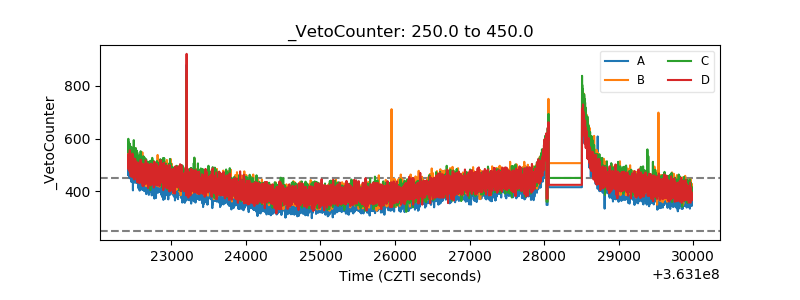 |