| Param | Original file | Final file |
|---|---|---|
| Filename | modeM0/AS1A10_058T02_9000004510_31184cztM0_level2.evt | modeM0/AS1A10_058T02_9000004510_31184cztM0_level2_quad_clean.evt |
| Size (bytes) | 736,427,520 | 103,907,520 |
| Size | 702.3 MB | 99.1 MB |
| Events in quadrant A | 3,848,619 | 676,318 |
| Events in quadrant B | 6,696,784 | 661,566 |
| Events in quadrant C | 3,852,435 | 649,852 |
| Events in quadrant D | 7,388,269 | 626,524 |
| Mode M0 | |||
|---|---|---|---|
| Quadrant | BADHDUFLAG | Total packets | Discarded packets |
| A | 0 | 16371 | 2 |
| B | 0 | 25280 | 2 |
| C | 0 | 16250 | 2 |
| D | 0 | 27556 | 2 |
| Mode SS | |||
|---|---|---|---|
| Quadrant | BADHDUFLAG | Total packets | Discarded packets |
| A | 0 | 160 | 0 |
| B | 0 | 160 | 0 |
| C | 0 | 160 | 0 |
| D | 0 | 160 | 0 |
| Mode M9 | |||
|---|---|---|---|
| Quadrant | BADHDUFLAG | Total packets | Discarded packets |
| A | 0 | 9 | 0 |
| B | 0 | 9 | 0 |
| C | 0 | 9 | 0 |
| D | 0 | 9 | 0 |
| Quadrant | Total seconds | Saturated seconds | Saturation percentage |
|---|---|---|---|
| A | 7659 | 88 | 1.148975% |
| B | 7659 | 443 | 5.784045% |
| C | 7659 | 204 | 2.663533% |
| D | 7658 | 547 | 7.142857% |
Noise dominated data is calculated using 1-second bins in cleaned event files. If a bin has >2000 counts, and if more than 50% of those come from <1% of pixels, then it is considered to be noise-dominated and hence unusable.
| Quadrant | # 1 sec bins | Bins with >0 counts | Bins with >2000 counts | High rate bins dominated by noise | Noise dominated (total time) | Noise dominated (detector-on time) | Marked lightcurve |
|---|---|---|---|---|---|---|---|
| A | 8474 | 7663 | 18 | 18 | 0.21% | 0.23% | 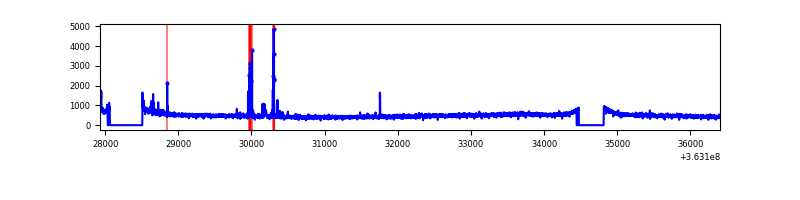 |
| B | 8474 | 7663 | 167 | 167 | 1.97% | 2.18% | 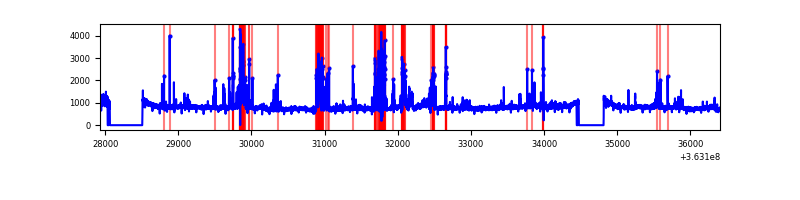 |
| C | 8474 | 7663 | 1 | 1 | 0.01% | 0.01% | 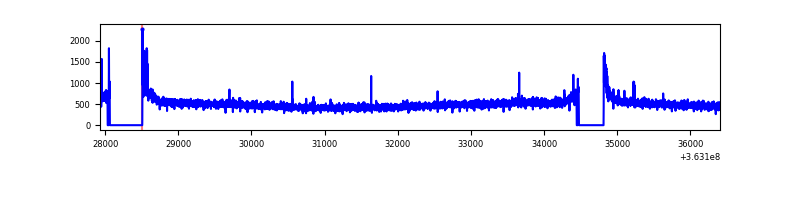 |
| D | 8473 | 7662 | 348 | 348 | 4.11% | 4.54% | 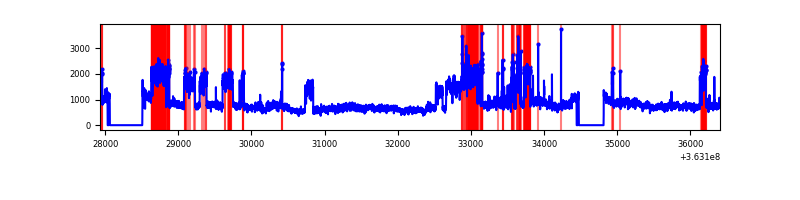 |
Top three noisy pixels from each quadrant. If the there are fewer than three noisy pixels in the level2.evt file, extra rows are filled as -1
| Pixel properties | Quadrant properties | ||||||
|---|---|---|---|---|---|---|---|
| Quadrant | DetID | PixID | Counts | Sigma | Mean | Median | Sigma |
| A | 12 | 96 | 136996 | 700.58 | 961 | 942 | 194.2 |
| A | 13 | 254 | 13859 | 66.51 | 961 | 942 | 194.2 |
| A | 3 | 137 | 10080 | 47.05 | 961 | 942 | 194.2 |
| B | 6 | 159 | 2113407 | 11549.38 | 942 | 917 | 182.9 |
| B | 4 | 80 | 736696 | 4022.64 | 942 | 917 | 182.9 |
| B | 0 | 190 | 62125 | 334.64 | 942 | 917 | 182.9 |
| C | 14 | 238 | 152151 | 693.51 | 922 | 925 | 218.1 |
| C | 0 | 10 | 74487 | 337.35 | 922 | 925 | 218.1 |
| C | 2 | 114 | 17635 | 76.63 | 922 | 925 | 218.1 |
| D | 8 | 195 | 3665638 | 16836.79 | 918 | 894 | 217.7 |
| D | 12 | 79 | 97229 | 442.59 | 918 | 894 | 217.7 |
| D | 12 | 233 | 74678 | 338.98 | 918 | 894 | 217.7 |
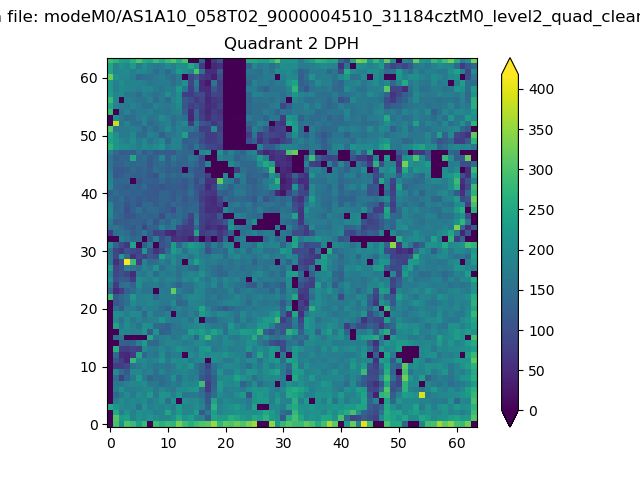
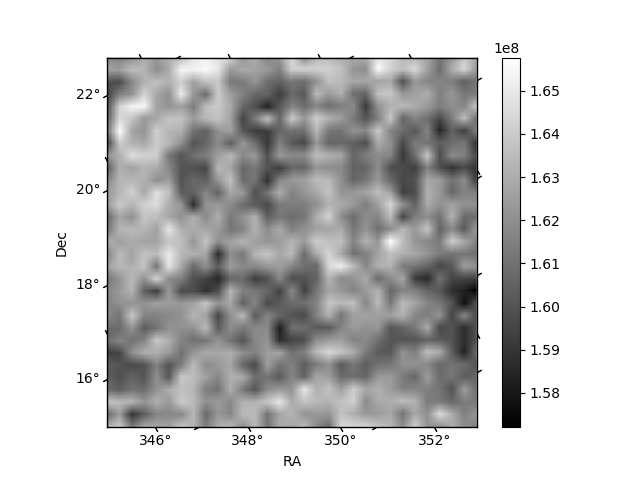
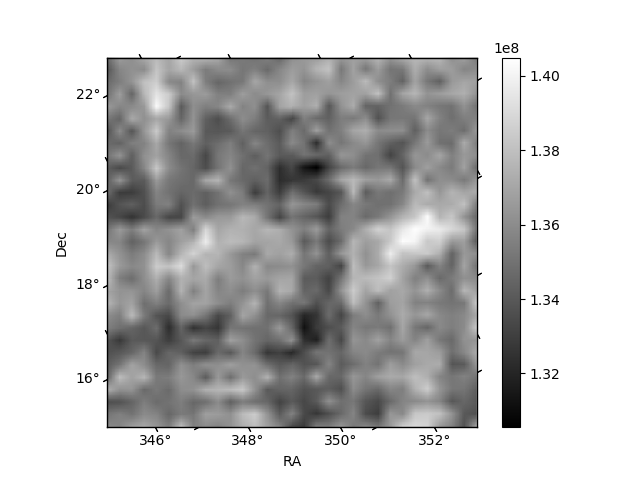
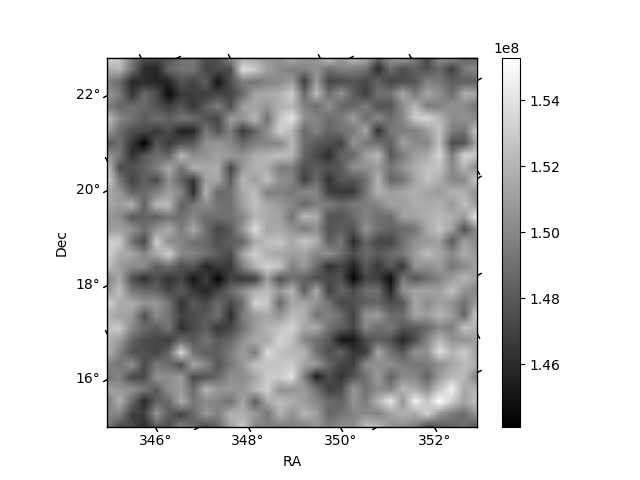
Histogram calculated using DETX and DETY for each event in the final _common_clean file
| Quadrant A | 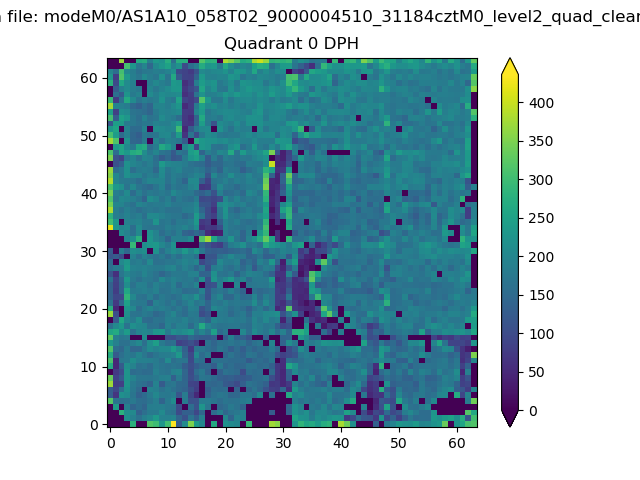 |
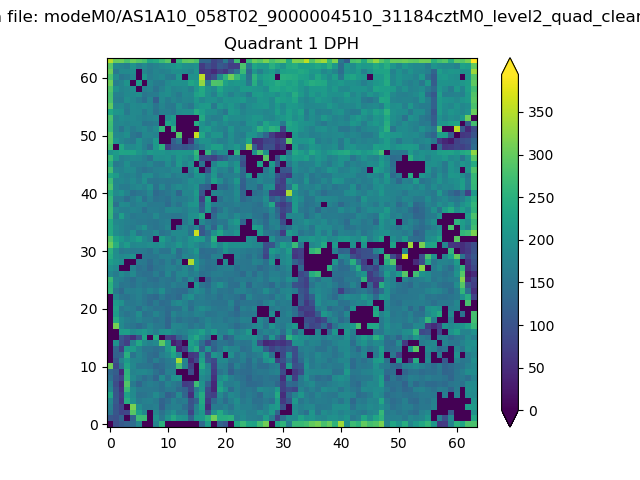 |
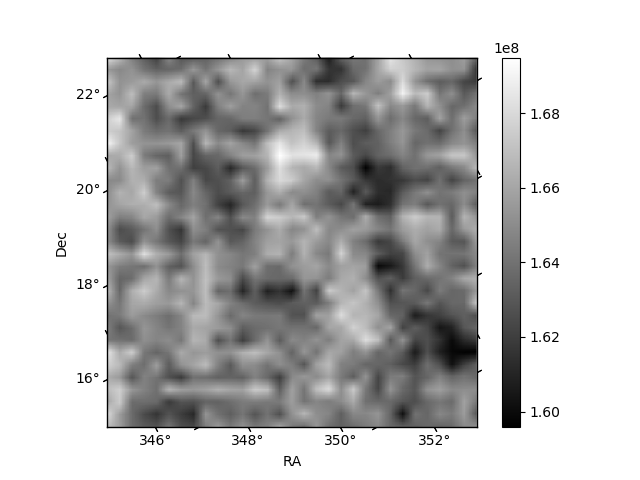
Quadrant B |
|---|---|---|---|
| Quadrant D | 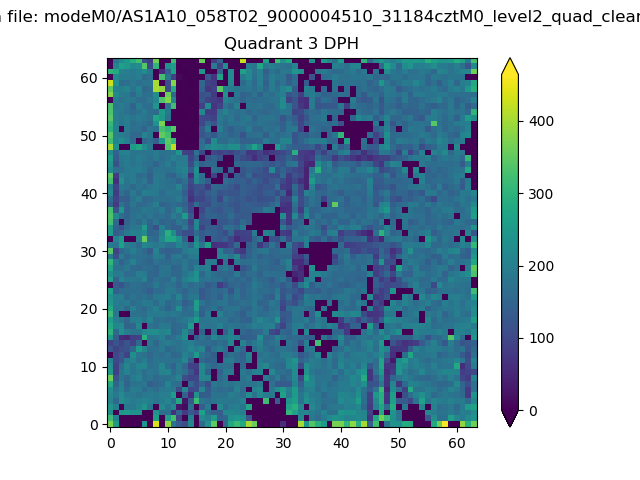 |
 |
Quadrant C |
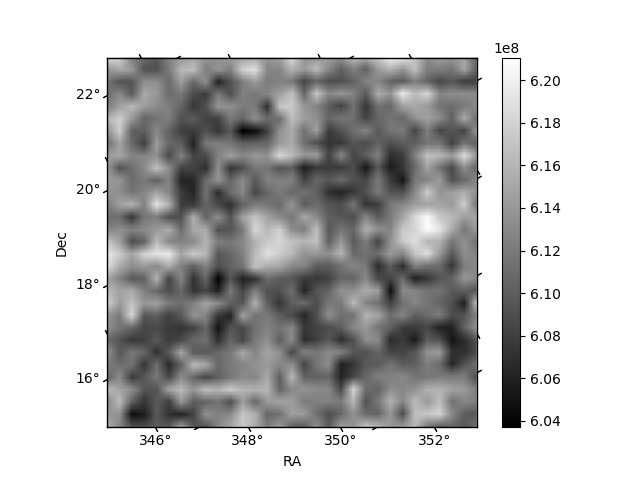
| Plot type | Count rate plots | Images |
|---|---|---|
| Comparison with Poisson distribution Blue bars denote a histogram of data divided into 1 sec bins. Red curve is a Poisson curve with rate = median count rate of data. |
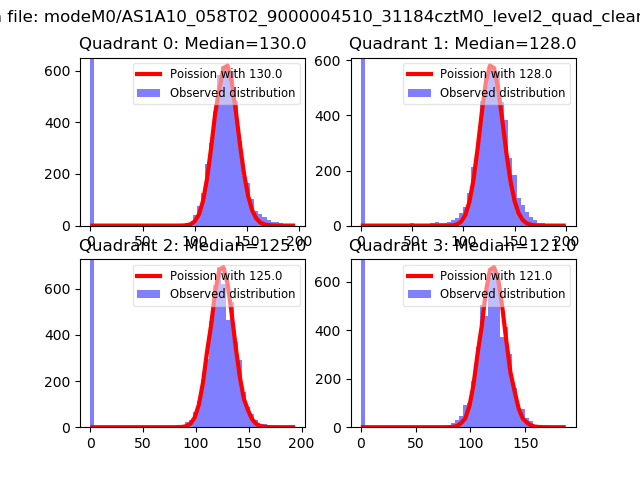 |
 |
| Quadrant-wise count rates Data is divided into 100 sec bins |
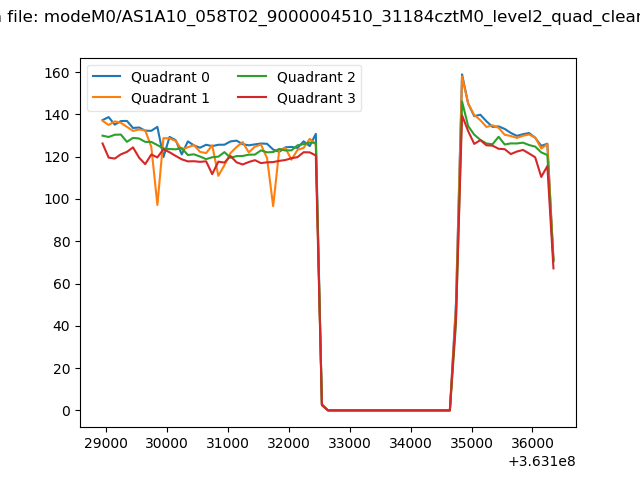 |
|
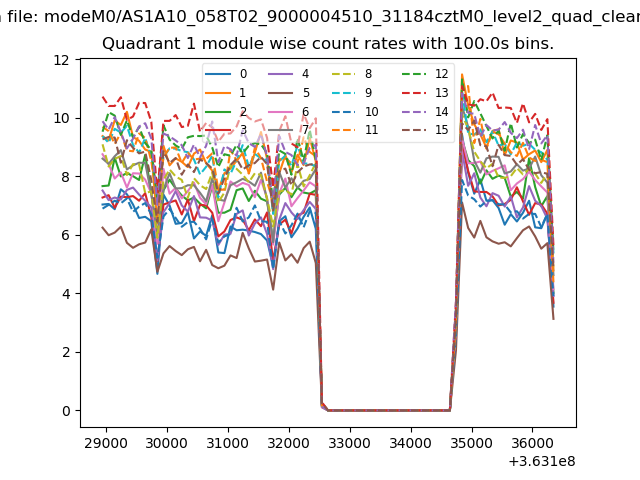
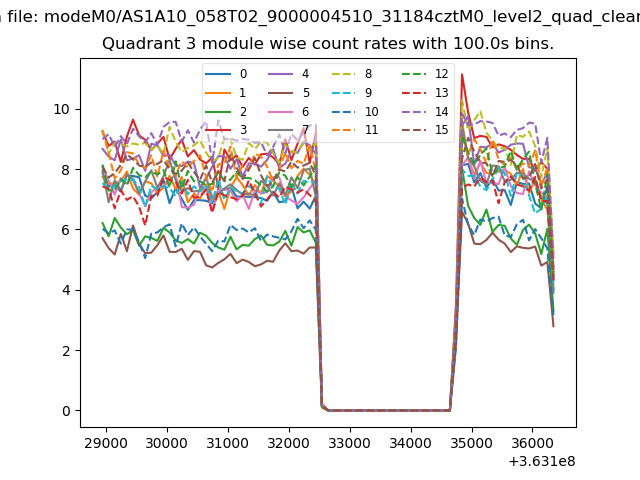
| Module-wise count rates for Quadrant A Data is divided into 100 sec bins |
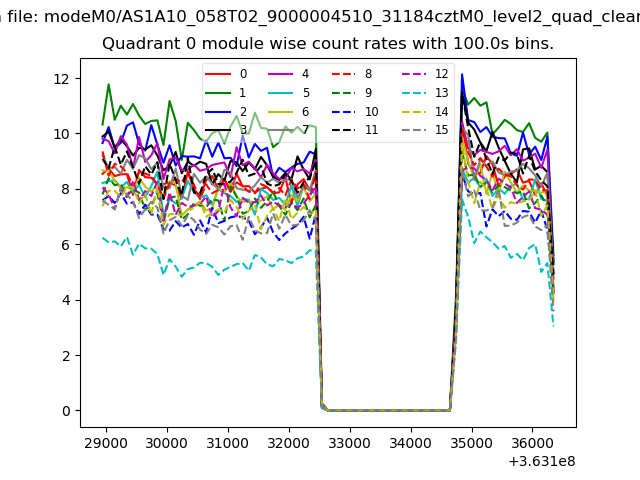 |
 |
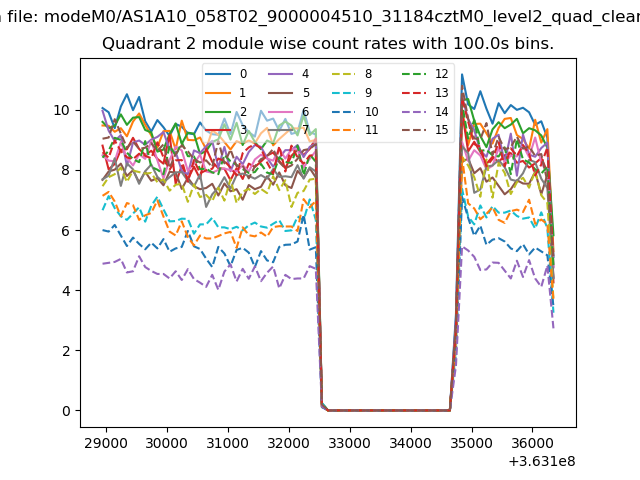
| Module-wise count rates for Quadrant B Data is divided into 100 sec bins |
 |
 |
| Module-wise count rates for Quadrant C Data is divided into 100 sec bins |
 |
 |
| Module-wise count rates for Quadrant D Data is divided into 100 sec bins |
 |
 |
| Parameter | Plot |
|---|---|
| CZT HV Monitor | 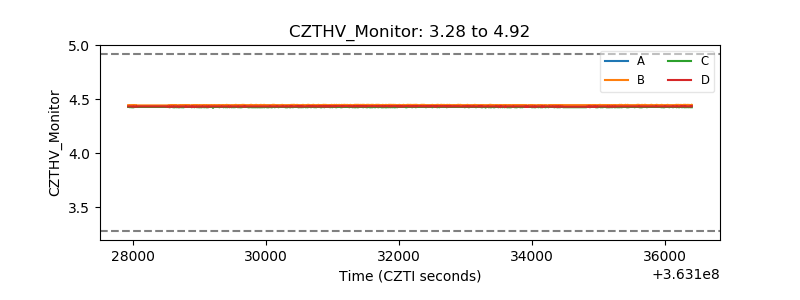 |
| D_VDD | 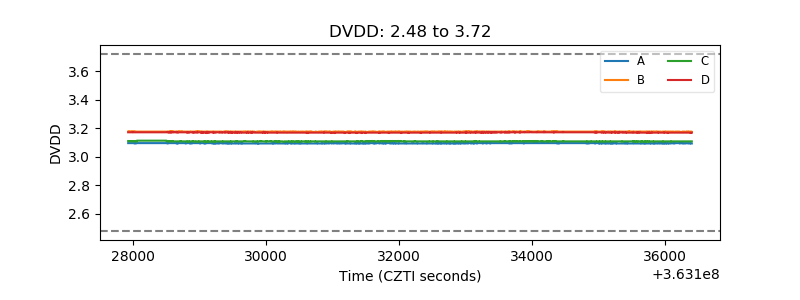 |
| Temperature 1 | 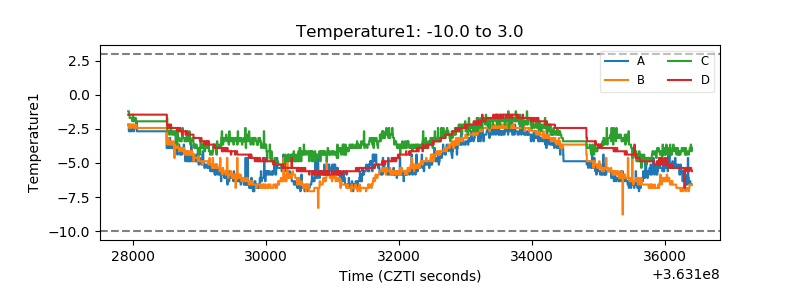 |
| Veto HV Monitor | 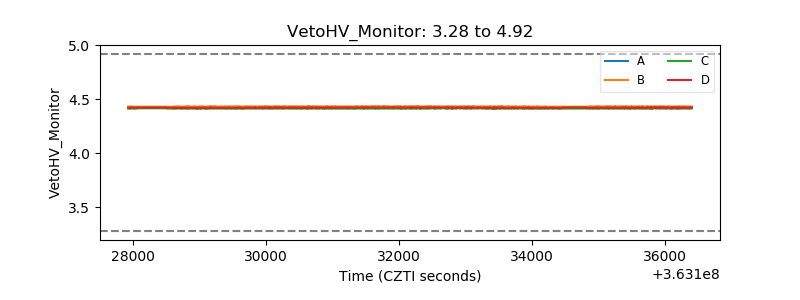 |
| Veto LLD | 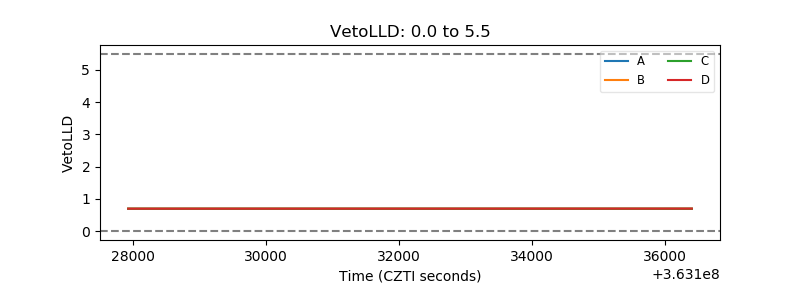 |
| Alpha Counter | 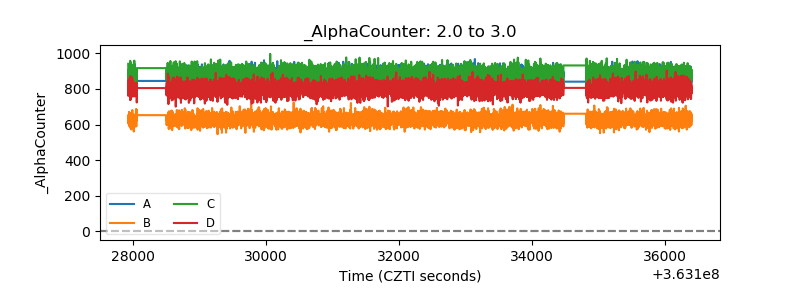 |
| _CPM_Rate | 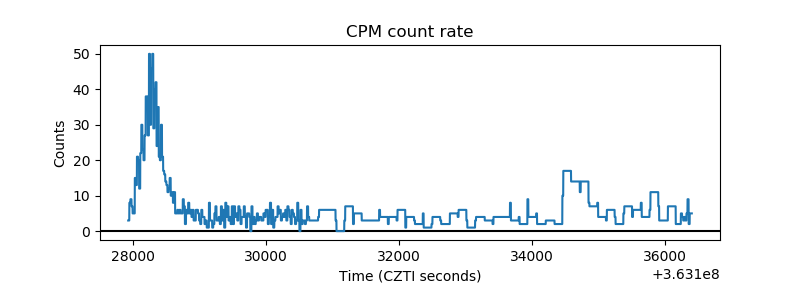 |
| CZT Counter | 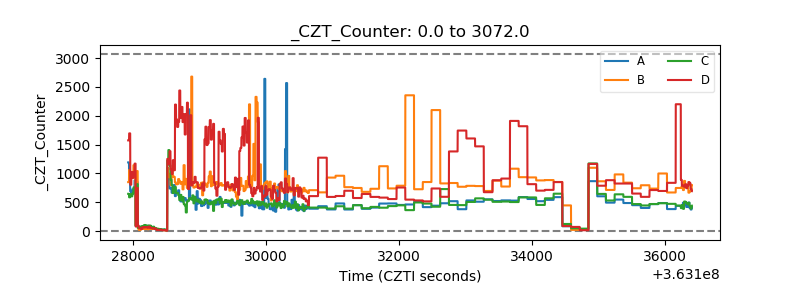 |
| +2.5 Volts monitor |  |
| +5 Volts monitor |  |
| _ROLL_ROT | 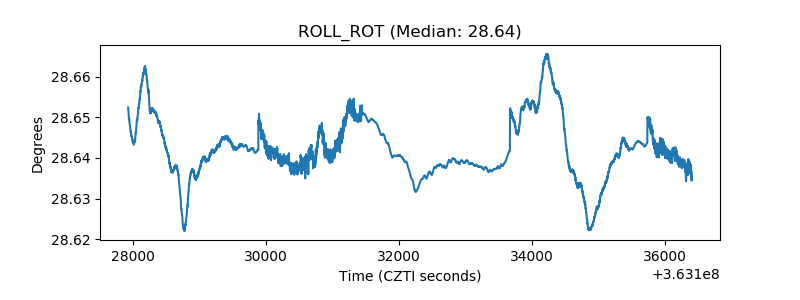 |
| _Roll_DEC | 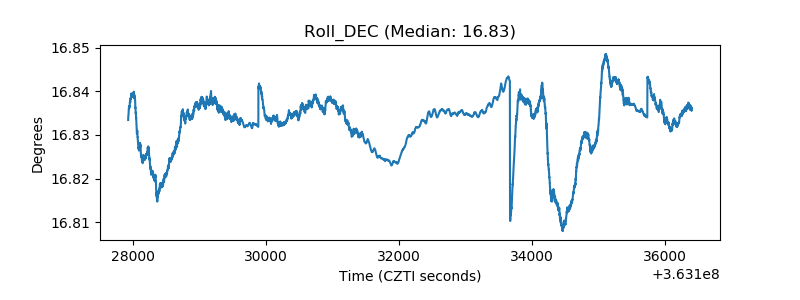 |
| _Roll_RA | 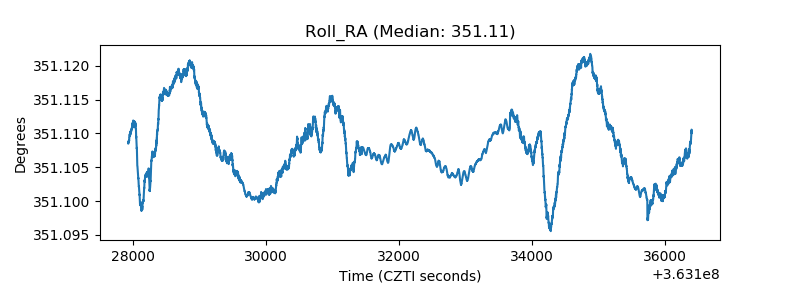 |
| Veto Counter | 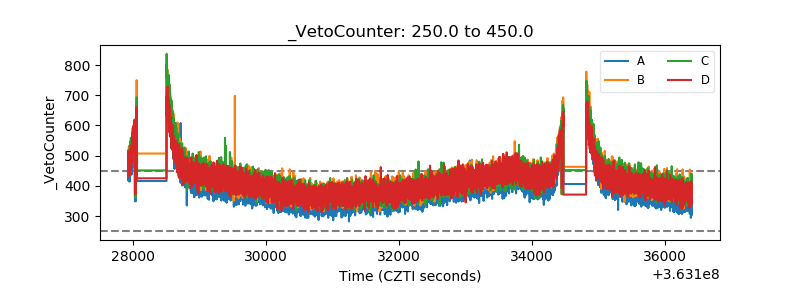 |