| Param | Original file | Final file |
|---|---|---|
| Filename | modeM0/AS1A10_058T02_9000004510_31185cztM0_level2.evt | modeM0/AS1A10_058T02_9000004510_31185cztM0_level2_quad_clean.evt |
| Size (bytes) | 695,171,520 | 105,255,360 |
| Size | 663.0 MB | 100.4 MB |
| Events in quadrant A | 3,643,815 | 690,698 |
| Events in quadrant B | 6,267,497 | 673,224 |
| Events in quadrant C | 3,870,832 | 659,153 |
| Events in quadrant D | 6,759,923 | 637,888 |
| Mode M0 | |||
|---|---|---|---|
| Quadrant | BADHDUFLAG | Total packets | Discarded packets |
| A | 0 | 15842 | 2 |
| B | 0 | 24065 | 2 |
| C | 0 | 16382 | 2 |
| D | 0 | 25600 | 2 |
| Mode SS | |||
|---|---|---|---|
| Quadrant | BADHDUFLAG | Total packets | Discarded packets |
| A | 0 | 154 | 0 |
| B | 0 | 154 | 0 |
| C | 0 | 154 | 0 |
| D | 0 | 154 | 0 |
| Mode M9 | |||
|---|---|---|---|
| Quadrant | BADHDUFLAG | Total packets | Discarded packets |
| A | 0 | 3 | 0 |
| B | 0 | 3 | 0 |
| C | 0 | 3 | 0 |
| D | 0 | 3 | 0 |
| Quadrant | Total seconds | Saturated seconds | Saturation percentage |
|---|---|---|---|
| A | 7563 | 62 | 0.819781% |
| B | 7564 | 333 | 4.402433% |
| C | 7564 | 285 | 3.767848% |
| D | 7564 | 394 | 5.208884% |
Noise dominated data is calculated using 1-second bins in cleaned event files. If a bin has >2000 counts, and if more than 50% of those come from <1% of pixels, then it is considered to be noise-dominated and hence unusable.
| Quadrant | # 1 sec bins | Bins with >0 counts | Bins with >2000 counts | High rate bins dominated by noise | Noise dominated (total time) | Noise dominated (detector-on time) | Marked lightcurve |
|---|---|---|---|---|---|---|---|
| A | 7923 | 7564 | 0 | 0 | 0.00% | 0.00% | 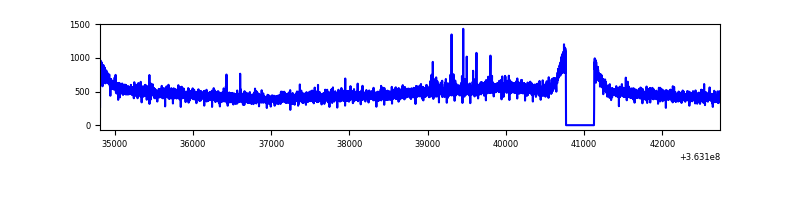 |
| B | 7924 | 7565 | 79 | 79 | 1.00% | 1.04% | 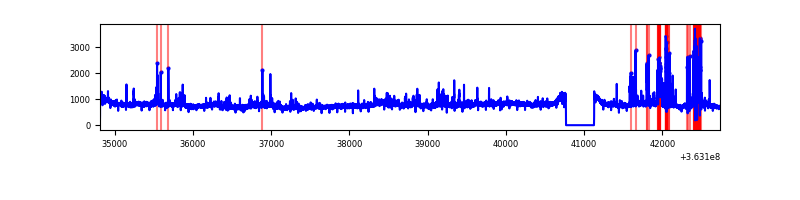 |
| C | 7924 | 7565 | 1 | 1 | 0.01% | 0.01% | 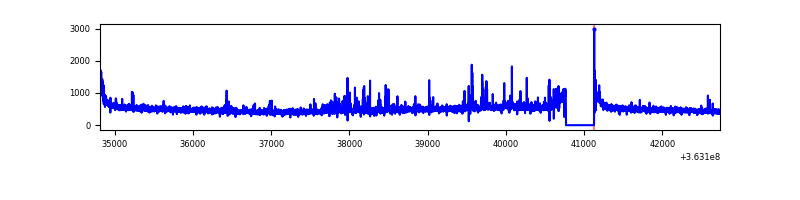 |
| D | 7924 | 7565 | 218 | 218 | 2.75% | 2.88% | 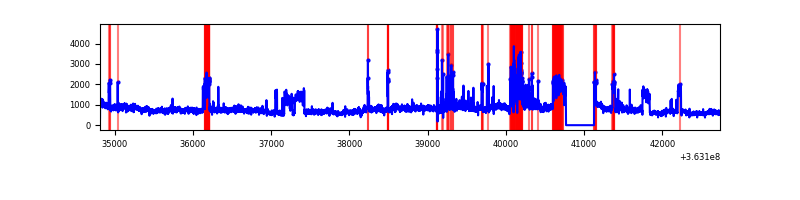 |
Top three noisy pixels from each quadrant. If the there are fewer than three noisy pixels in the level2.evt file, extra rows are filled as -1
| Pixel properties | Quadrant properties | ||||||
|---|---|---|---|---|---|---|---|
| Quadrant | DetID | PixID | Counts | Sigma | Mean | Median | Sigma |
| A | 12 | 96 | 21351 | 107.64 | 938 | 919 | 189.8 |
| A | 13 | 254 | 13360 | 65.54 | 938 | 919 | 189.8 |
| A | 3 | 137 | 9903 | 47.33 | 938 | 919 | 189.8 |
| B | 6 | 159 | 2078608 | 11633.88 | 918 | 895 | 178.6 |
| B | 4 | 80 | 325613 | 1818.22 | 918 | 895 | 178.6 |
| B | 0 | 190 | 108470 | 602.35 | 918 | 895 | 178.6 |
| C | 14 | 238 | 176789 | 828.53 | 895 | 900 | 212.3 |
| C | 0 | 10 | 135739 | 635.16 | 895 | 900 | 212.3 |
| C | 14 | 254 | 48156 | 222.6 | 895 | 900 | 212.3 |
| D | 8 | 195 | 2834019 | 12338.92 | 881 | 864 | 229.6 |
| D | 12 | 218 | 254950 | 1106.59 | 881 | 864 | 229.6 |
| D | 12 | 79 | 103853 | 448.54 | 881 | 864 | 229.6 |
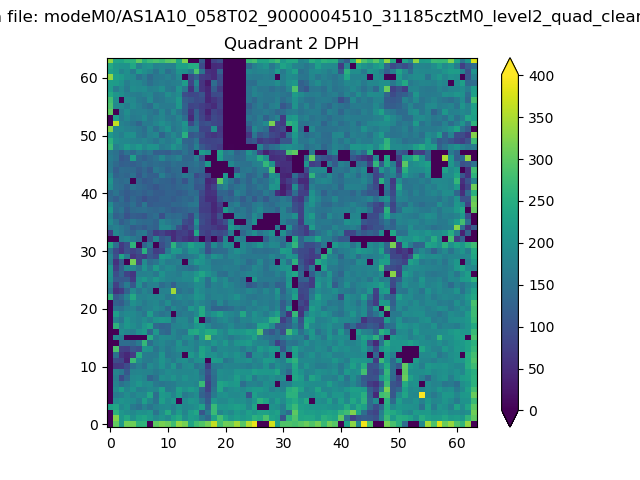
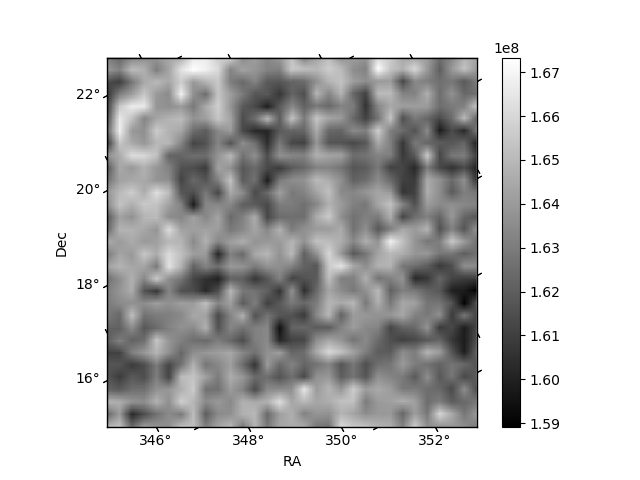
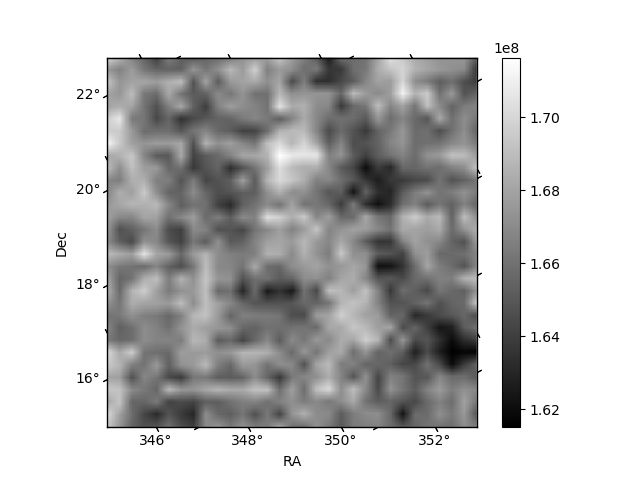
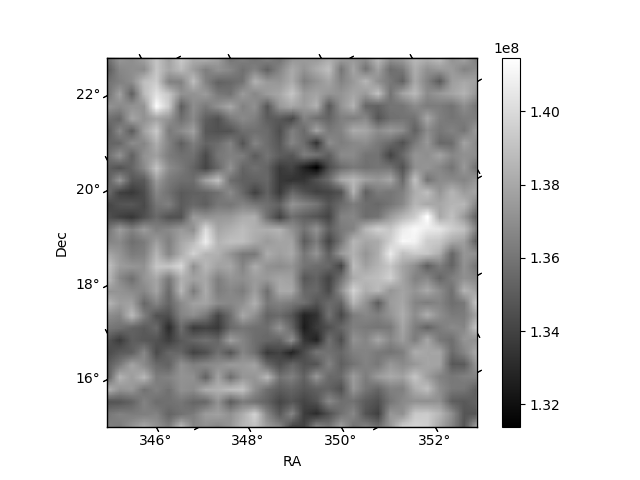
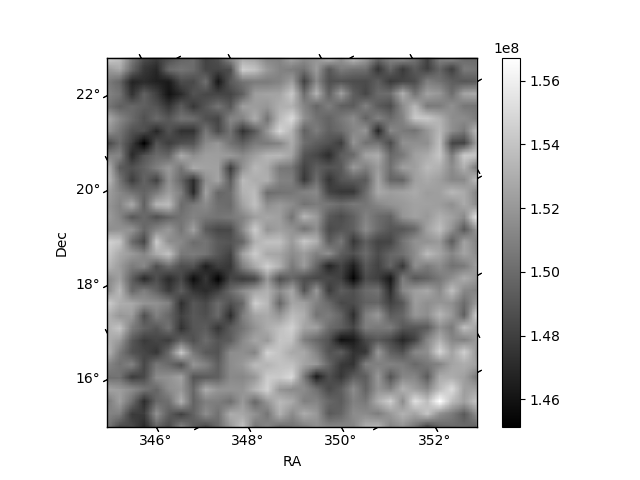
Histogram calculated using DETX and DETY for each event in the final _common_clean file
| Quadrant A |  |
 |
Quadrant B |
|---|---|---|---|
| Quadrant D |  |
 |
Quadrant C |
| Plot type | Count rate plots | Images |
|---|---|---|
| Comparison with Poisson distribution Blue bars denote a histogram of data divided into 1 sec bins. Red curve is a Poisson curve with rate = median count rate of data. |
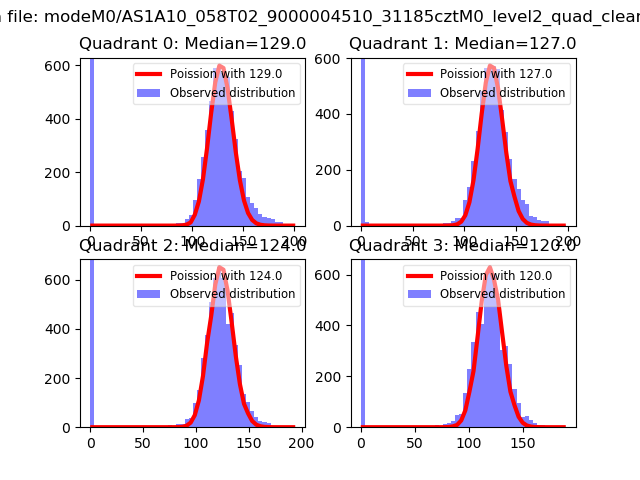 |
 |
| Quadrant-wise count rates Data is divided into 100 sec bins |
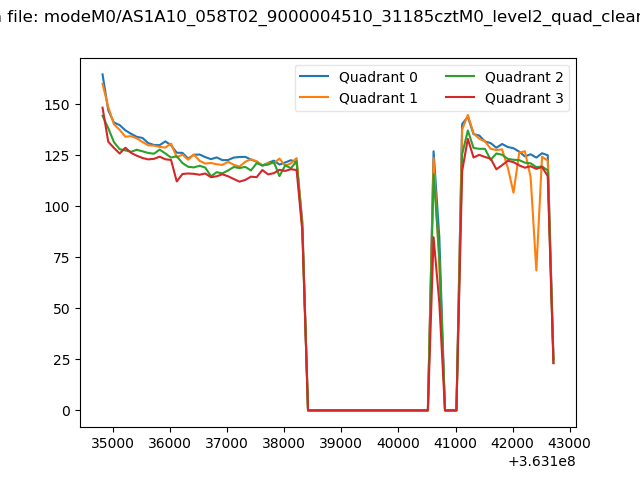 |
|
| Module-wise count rates for Quadrant A Data is divided into 100 sec bins |
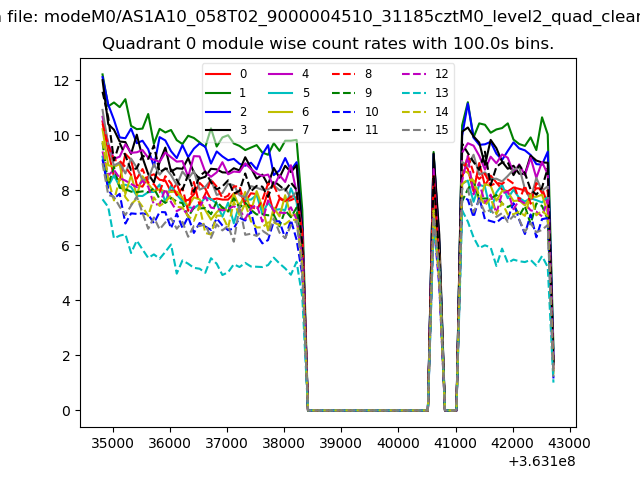 |
 |
| Module-wise count rates for Quadrant B Data is divided into 100 sec bins |
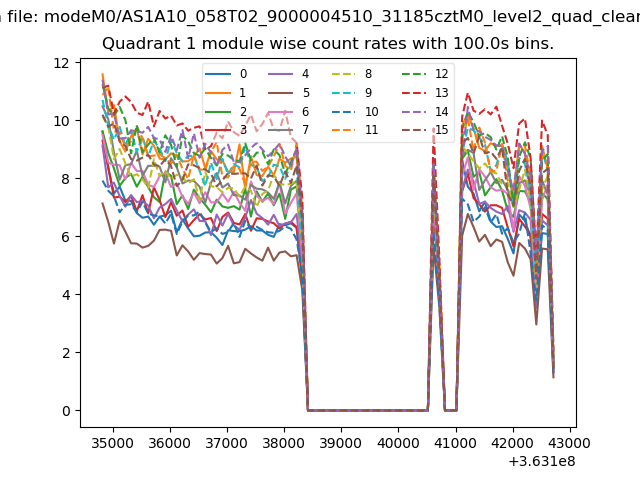 |
 |
| Module-wise count rates for Quadrant C Data is divided into 100 sec bins |
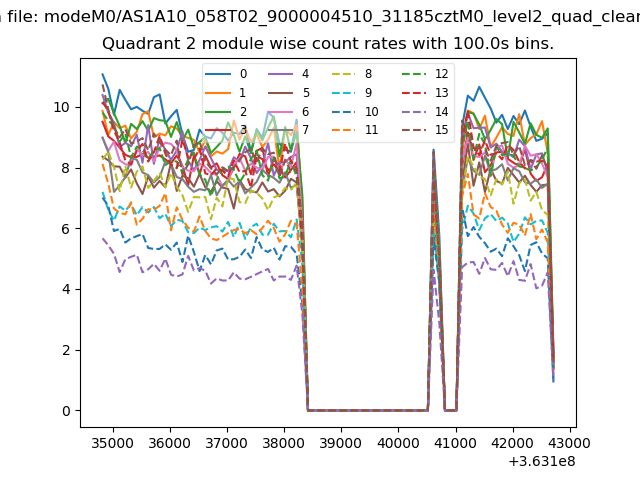 |
 |
| Module-wise count rates for Quadrant D Data is divided into 100 sec bins |
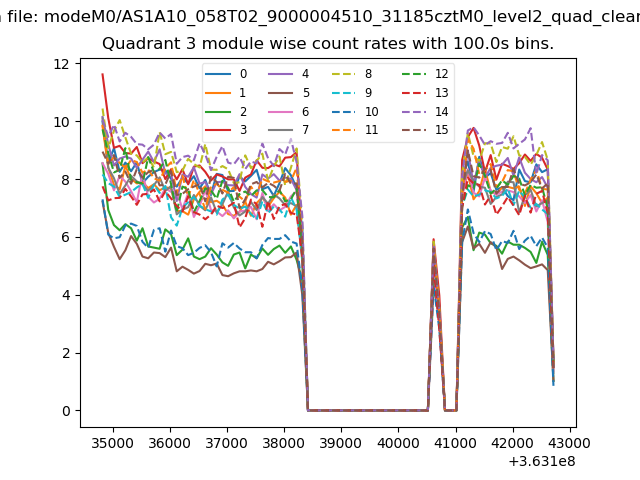 |
 |
| Parameter | Plot |
|---|---|
| CZT HV Monitor | 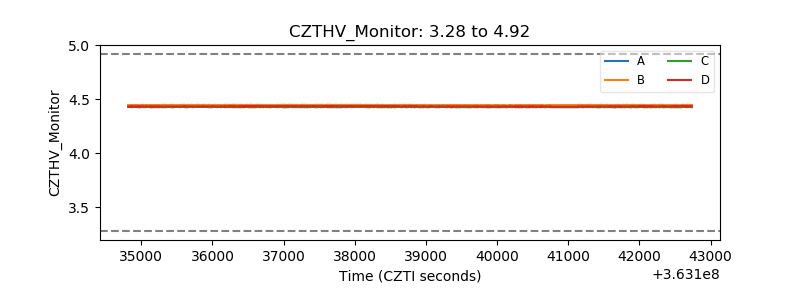 |
| D_VDD | 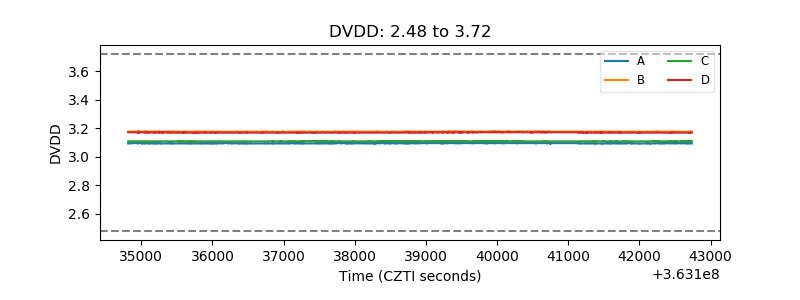 |
| Temperature 1 | 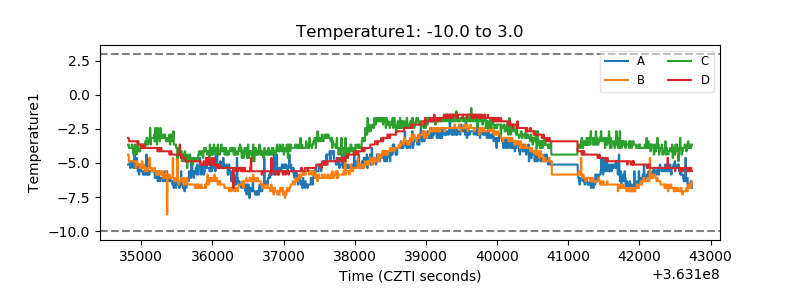 |
| Veto HV Monitor | 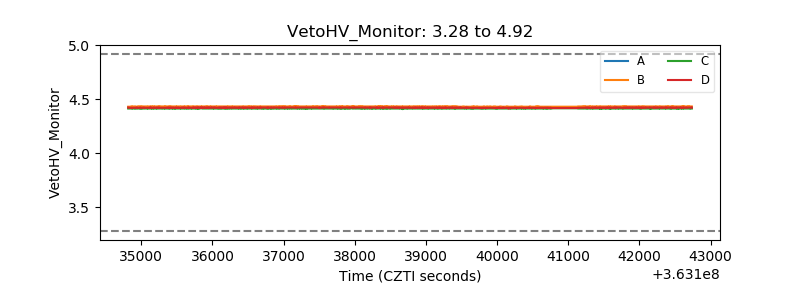 |
| Veto LLD |  |
| Alpha Counter | 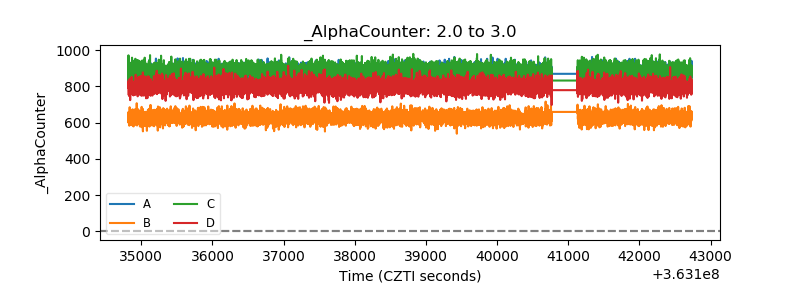 |
| _CPM_Rate | 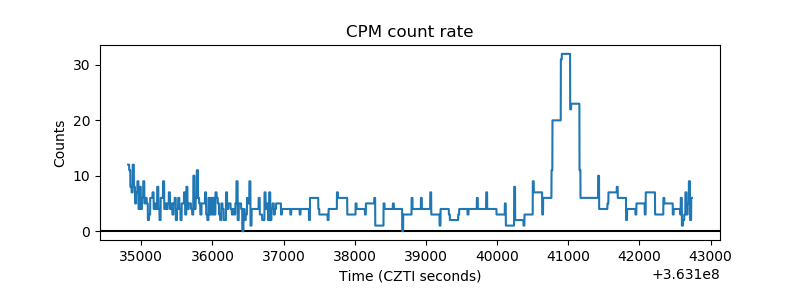 |
| CZT Counter | 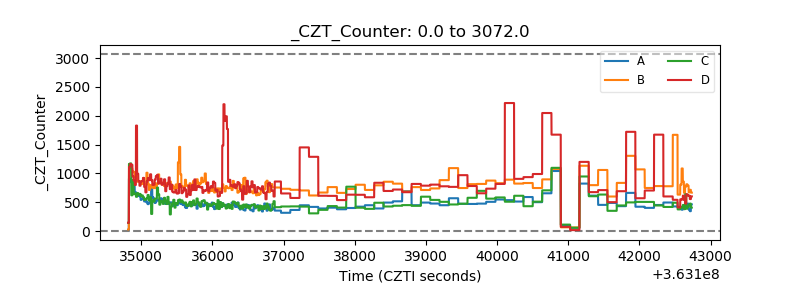 |
| +2.5 Volts monitor |  |
| +5 Volts monitor | 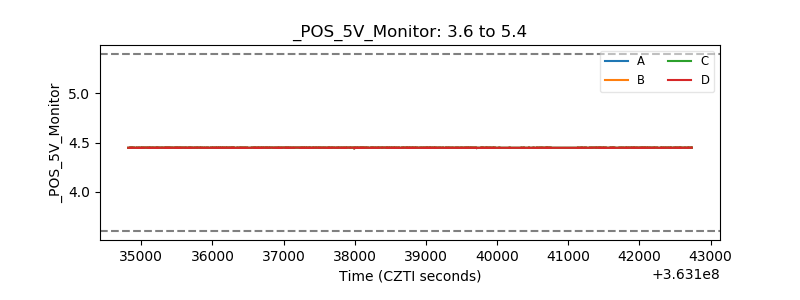 |
| _ROLL_ROT | 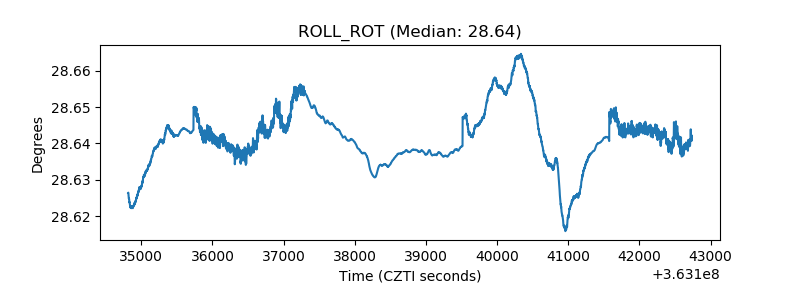 |
| _Roll_DEC | 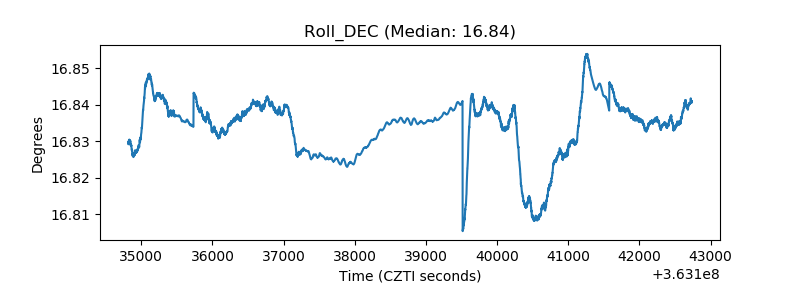 |
| _Roll_RA | 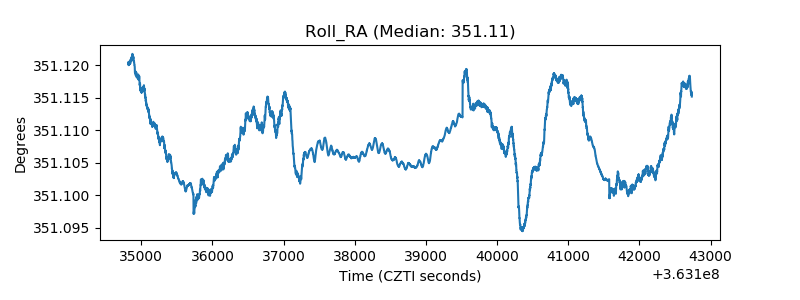 |
| Veto Counter | 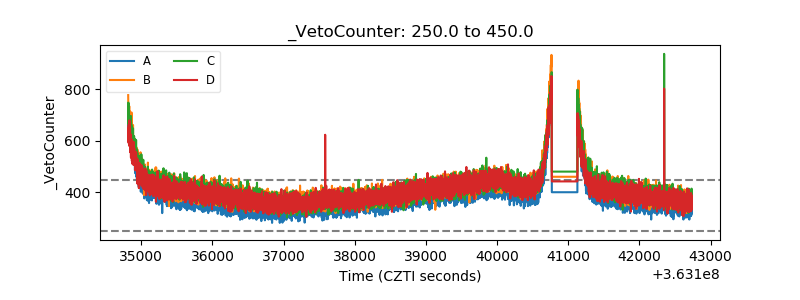 |