| Param | Original file | Final file |
|---|---|---|
| Filename | modeM0/AS1A10_058T02_9000004510_31187cztM0_level2.evt | modeM0/AS1A10_058T02_9000004510_31187cztM0_level2_quad_clean.evt |
| Size (bytes) | 1,002,712,320 | 133,727,040 |
| Size | 956.3 MB | 127.5 MB |
| Events in quadrant A | 5,417,525 | 841,104 |
| Events in quadrant B | 8,924,816 | 825,564 |
| Events in quadrant C | 5,658,788 | 808,309 |
| Events in quadrant D | 9,597,525 | 786,141 |
| Mode M0 | |||
|---|---|---|---|
| Quadrant | BADHDUFLAG | Total packets | Discarded packets |
| A | 0 | 23581 | 2 |
| B | 0 | 35380 | 2 |
| C | 0 | 24213 | 7 |
| D | 0 | 37086 | 2 |
| Mode SS | |||
|---|---|---|---|
| Quadrant | BADHDUFLAG | Total packets | Discarded packets |
| A | 0 | 232 | 0 |
| B | 0 | 232 | 0 |
| C | 0 | 232 | 0 |
| D | 0 | 232 | 0 |
| Mode M9 | |||
|---|---|---|---|
| Quadrant | BADHDUFLAG | Total packets | Discarded packets |
| A | 0 | 9 | 0 |
| B | 0 | 9 | 0 |
| C | 0 | 9 | 0 |
| D | 0 | 9 | 0 |
| Quadrant | Total seconds | Saturated seconds | Saturation percentage |
|---|---|---|---|
| A | 11397 | 76 | 0.666842% |
| B | 11398 | 367 | 3.219863% |
| C | 11397 | 303 | 2.658594% |
| D | 11397 | 405 | 3.553567% |
Noise dominated data is calculated using 1-second bins in cleaned event files. If a bin has >2000 counts, and if more than 50% of those come from <1% of pixels, then it is considered to be noise-dominated and hence unusable.
| Quadrant | # 1 sec bins | Bins with >0 counts | Bins with >2000 counts | High rate bins dominated by noise | Noise dominated (total time) | Noise dominated (detector-on time) | Marked lightcurve |
|---|---|---|---|---|---|---|---|
| A | 12302 | 11399 | 0 | 0 | 0.00% | 0.00% |  |
| B | 12303 | 11400 | 82 | 82 | 0.67% | 0.72% |  |
| C | 12302 | 11399 | 29 | 29 | 0.24% | 0.25% |  |
| D | 12302 | 11399 | 126 | 126 | 1.02% | 1.11% |  |
Top three noisy pixels from each quadrant. If the there are fewer than three noisy pixels in the level2.evt file, extra rows are filled as -1
| Pixel properties | Quadrant properties | ||||||
|---|---|---|---|---|---|---|---|
| Quadrant | DetID | PixID | Counts | Sigma | Mean | Median | Sigma |
| A | 12 | 96 | 23237 | 77.89 | 1397 | 1366 | 280.8 |
| A | 13 | 254 | 20180 | 67.0 | 1397 | 1366 | 280.8 |
| A | 3 | 137 | 14892 | 48.17 | 1397 | 1366 | 280.8 |
| B | 6 | 159 | 3044212 | 11442.78 | 1367 | 1331 | 265.9 |
| B | 4 | 80 | 280446 | 1049.61 | 1367 | 1331 | 265.9 |
| B | 0 | 230 | 90086 | 333.76 | 1367 | 1331 | 265.9 |
| C | 14 | 238 | 222122 | 699.34 | 1330 | 1336 | 315.7 |
| C | 10 | 22 | 125563 | 393.49 | 1330 | 1336 | 315.7 |
| C | 0 | 10 | 81949 | 255.34 | 1330 | 1336 | 315.7 |
| D | 8 | 195 | 4391040 | 12901.97 | 1328 | 1300 | 340.2 |
| D | 2 | 250 | 71053 | 205.01 | 1328 | 1300 | 340.2 |
| D | 12 | 218 | 52233 | 149.7 | 1328 | 1300 | 340.2 |
Histogram calculated using DETX and DETY for each event in the final _common_clean file
| Quadrant A | 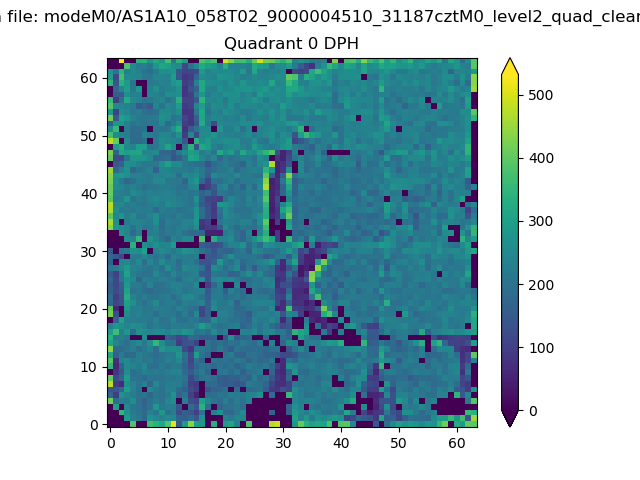 |
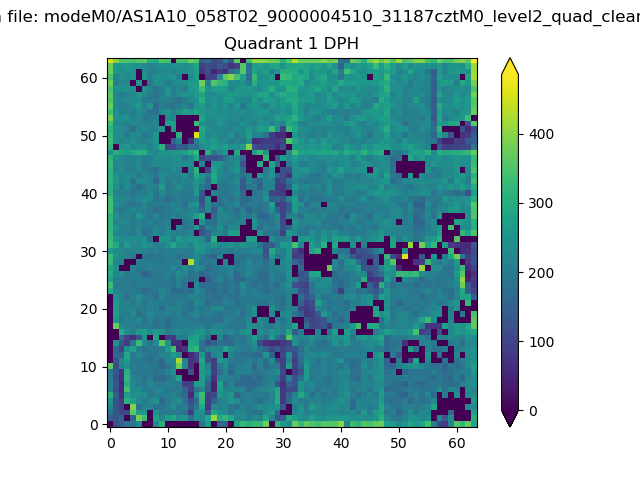 |
Quadrant B |
|---|---|---|---|
| Quadrant D |  |
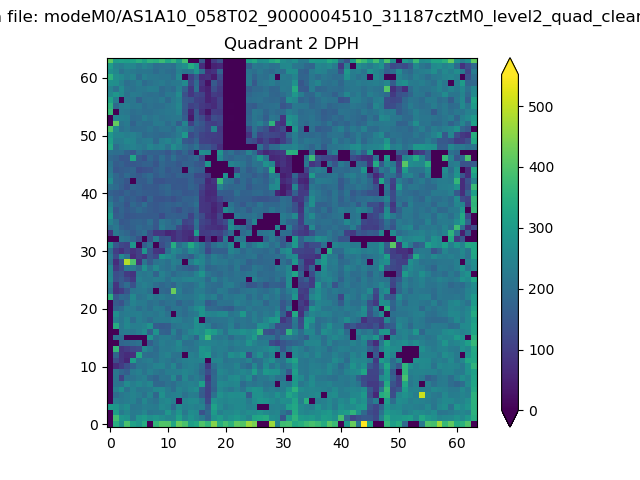 |
Quadrant C |
| Plot type | Count rate plots | Images |
|---|---|---|
| Comparison with Poisson distribution Blue bars denote a histogram of data divided into 1 sec bins. Red curve is a Poisson curve with rate = median count rate of data. |
 |
 |
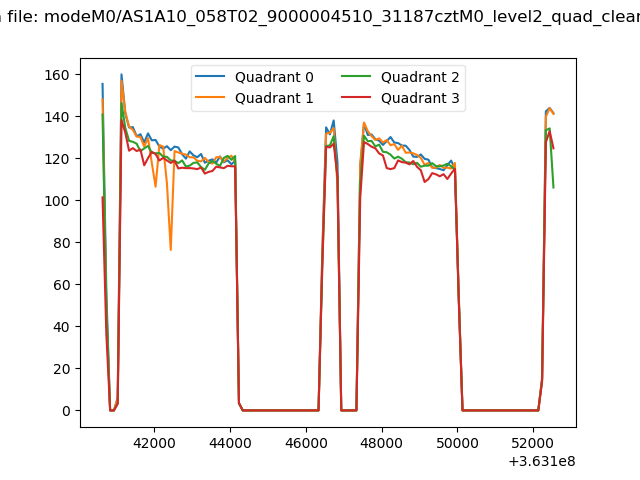
| Quadrant-wise count rates Data is divided into 100 sec bins |
 |
|
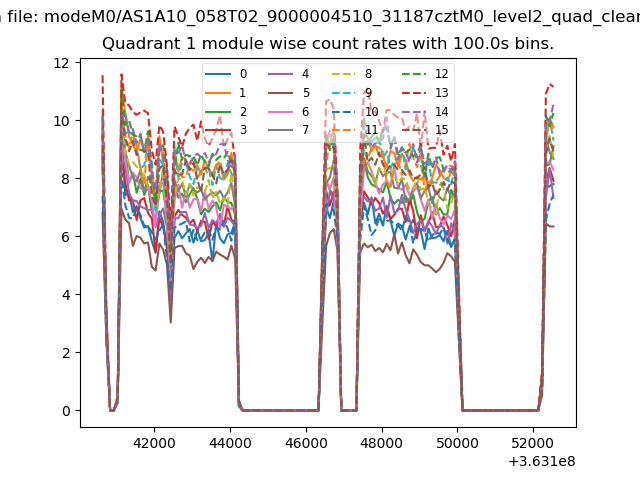
| Module-wise count rates for Quadrant A Data is divided into 100 sec bins |
 |
 |
| Module-wise count rates for Quadrant B Data is divided into 100 sec bins |
 |
 |
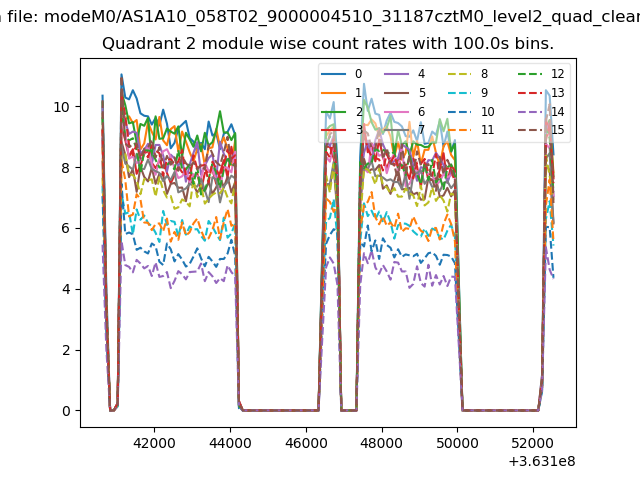
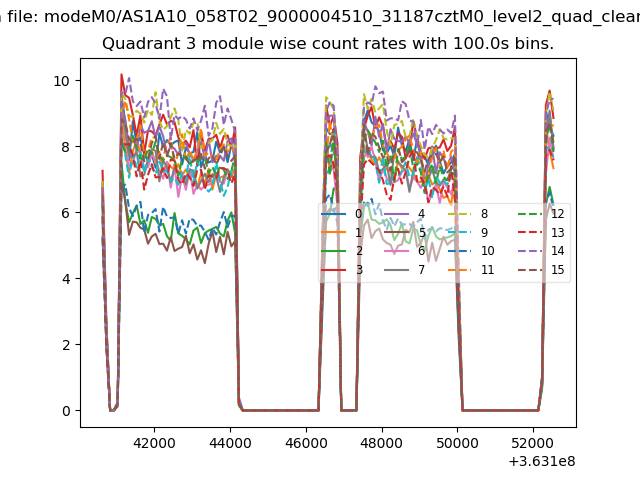
| Module-wise count rates for Quadrant C Data is divided into 100 sec bins |
 |
 |
| Module-wise count rates for Quadrant D Data is divided into 100 sec bins |
 |
 |
| Parameter | Plot |
|---|---|
| CZT HV Monitor | 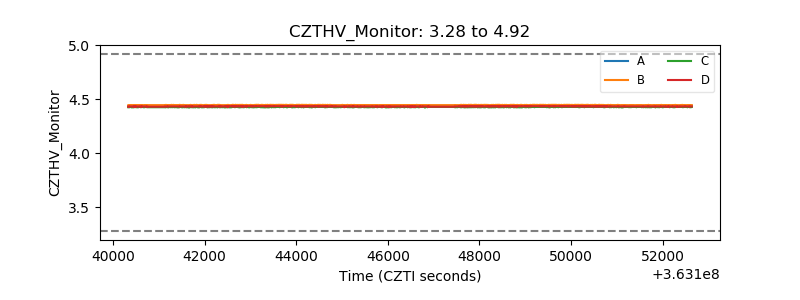 |
| D_VDD | 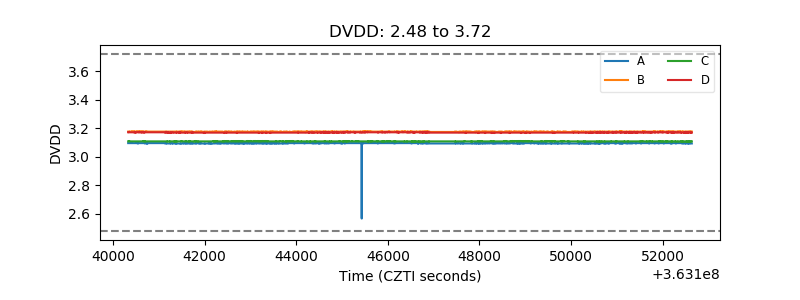 |
| Temperature 1 | 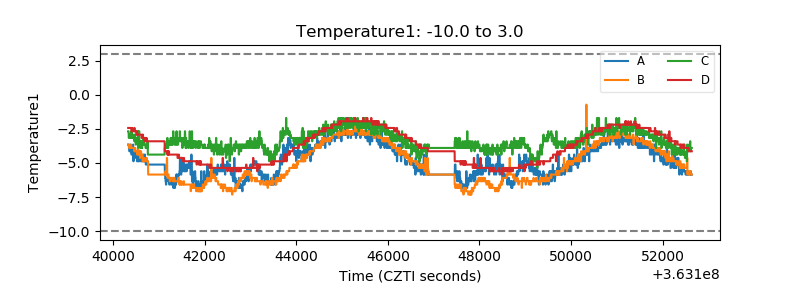 |
| Veto HV Monitor | 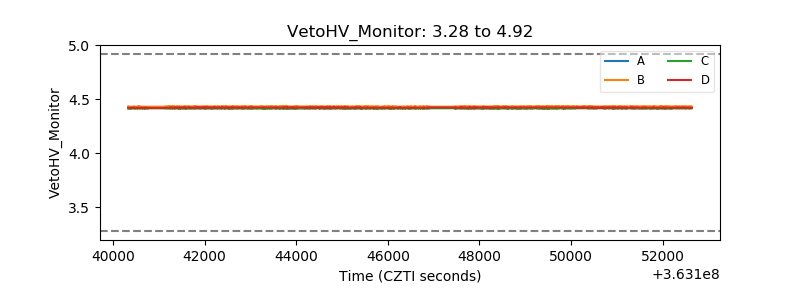 |
| Veto LLD | 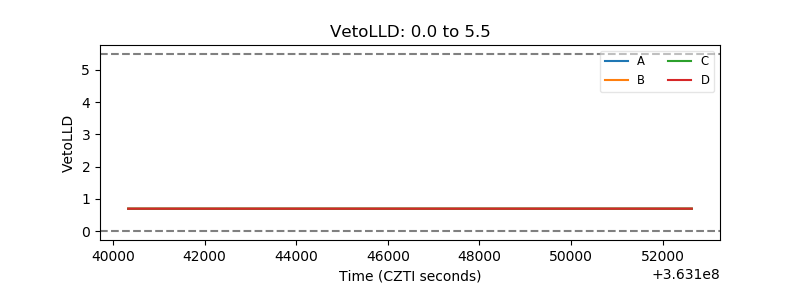 |
| Alpha Counter | 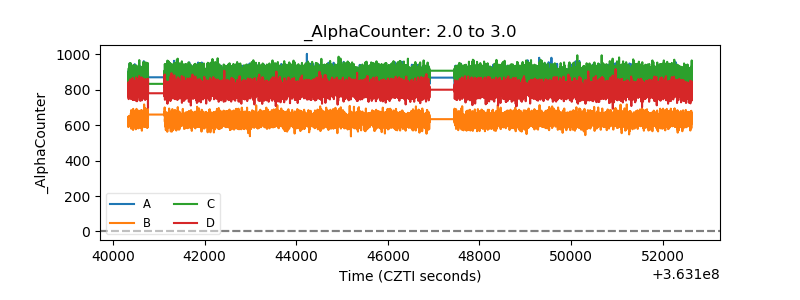 |
| _CPM_Rate | 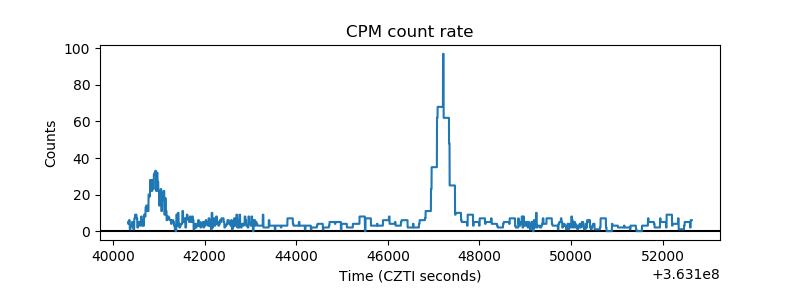 |
| CZT Counter | 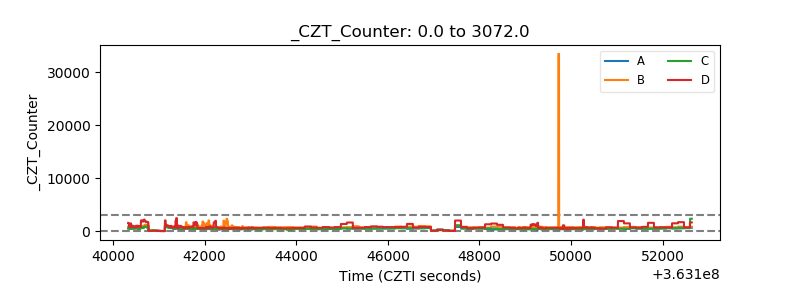 |
| +2.5 Volts monitor |  |
| +5 Volts monitor | 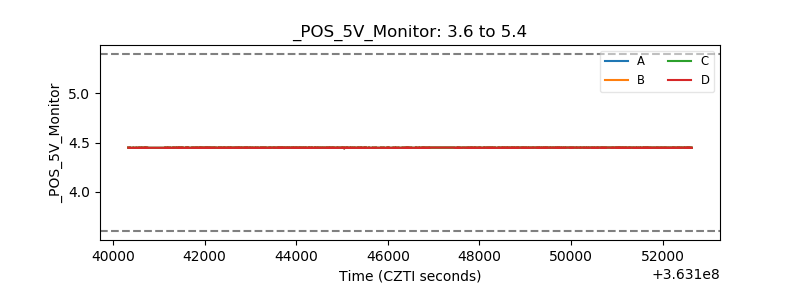 |
| _ROLL_ROT | 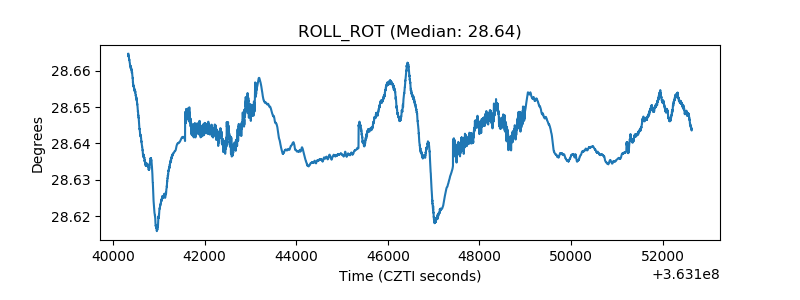 |
| _Roll_DEC | 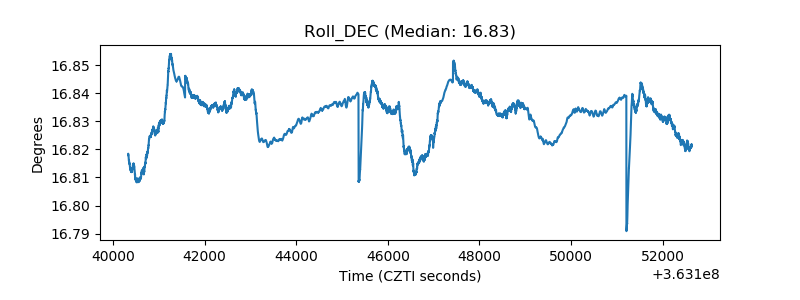 |
| _Roll_RA | 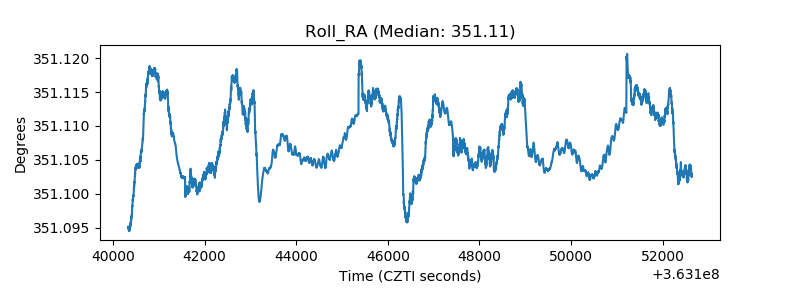 |
| Veto Counter | 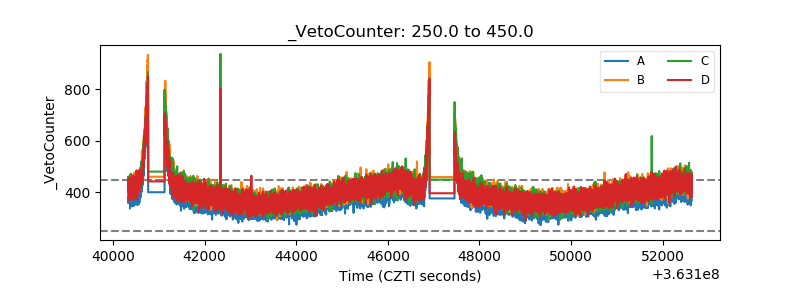 |