| Param | Original file | Final file |
|---|---|---|
| Filename | modeM0/AS1A10_058T02_9000004510_31188cztM0_level2.evt | modeM0/AS1A10_058T02_9000004510_31188cztM0_level2_quad_clean.evt |
| Size (bytes) | 686,943,360 | 109,287,360 |
| Size | 655.1 MB | 104.2 MB |
| Events in quadrant A | 3,748,237 | 713,141 |
| Events in quadrant B | 5,949,068 | 710,783 |
| Events in quadrant C | 4,207,143 | 675,248 |
| Events in quadrant D | 6,371,984 | 667,316 |
| Mode M0 | |||
|---|---|---|---|
| Quadrant | BADHDUFLAG | Total packets | Discarded packets |
| A | 0 | 16032 | 2 |
| B | 0 | 23680 | 2 |
| C | 0 | 17364 | 2 |
| D | 0 | 25178 | 2 |
| Mode SS | |||
|---|---|---|---|
| Quadrant | BADHDUFLAG | Total packets | Discarded packets |
| A | 0 | 160 | 0 |
| B | 0 | 160 | 0 |
| C | 0 | 160 | 0 |
| D | 0 | 160 | 0 |
| Mode M9 | |||
|---|---|---|---|
| Quadrant | BADHDUFLAG | Total packets | Discarded packets |
| A | 0 | 16 | 0 |
| B | 0 | 16 | 0 |
| C | 0 | 16 | 0 |
| D | 0 | 16 | 0 |
| Quadrant | Total seconds | Saturated seconds | Saturation percentage |
|---|---|---|---|
| A | 7811 | 53 | 0.678530% |
| B | 7812 | 138 | 1.766513% |
| C | 7812 | 253 | 3.238607% |
| D | 7812 | 204 | 2.611367% |
Noise dominated data is calculated using 1-second bins in cleaned event files. If a bin has >2000 counts, and if more than 50% of those come from <1% of pixels, then it is considered to be noise-dominated and hence unusable.
| Quadrant | # 1 sec bins | Bins with >0 counts | Bins with >2000 counts | High rate bins dominated by noise | Noise dominated (total time) | Noise dominated (detector-on time) | Marked lightcurve |
|---|---|---|---|---|---|---|---|
| A | 9386 | 7813 | 0 | 0 | 0.00% | 0.00% | 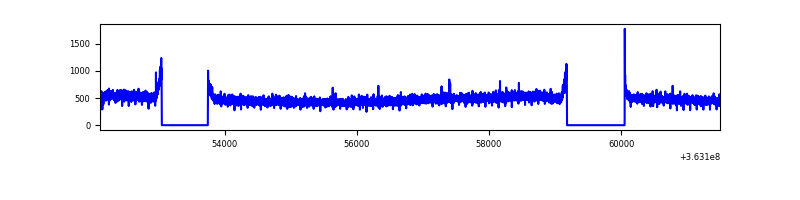 |
| B | 9387 | 7814 | 8 | 8 | 0.09% | 0.10% | 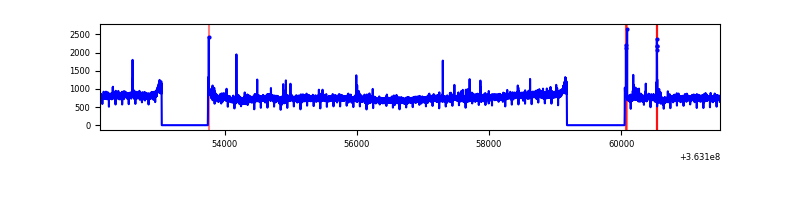 |
| C | 9387 | 7814 | 55 | 55 | 0.59% | 0.70% | 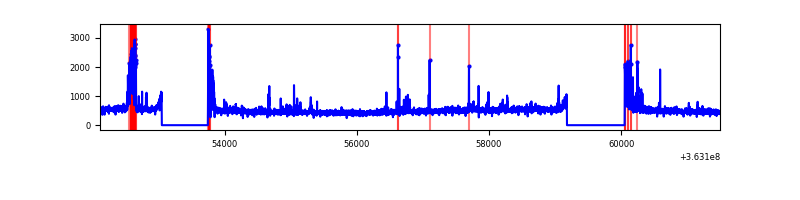 |
| D | 9387 | 7814 | 25 | 25 | 0.27% | 0.32% | 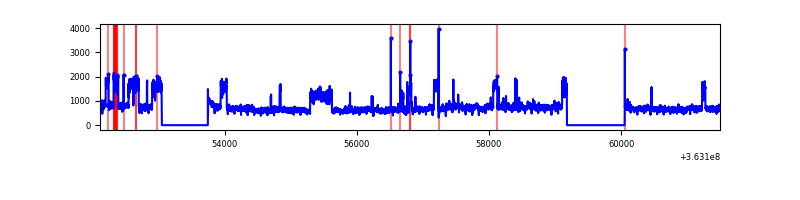 |
Top three noisy pixels from each quadrant. If the there are fewer than three noisy pixels in the level2.evt file, extra rows are filled as -1
| Pixel properties | Quadrant properties | ||||||
|---|---|---|---|---|---|---|---|
| Quadrant | DetID | PixID | Counts | Sigma | Mean | Median | Sigma |
| A | 13 | 254 | 15966 | 76.97 | 968 | 948 | 195.1 |
| A | 3 | 137 | 10329 | 48.08 | 968 | 948 | 195.1 |
| A | 0 | 226 | 7902 | 35.64 | 968 | 948 | 195.1 |
| B | 6 | 159 | 2099584 | 11384.32 | 953 | 927 | 184.3 |
| B | 10 | 247 | 40132 | 212.67 | 953 | 927 | 184.3 |
| B | 15 | 33 | 27803 | 145.79 | 953 | 927 | 184.3 |
| C | 0 | 10 | 259060 | 1183.78 | 919 | 921 | 218.1 |
| C | 10 | 22 | 173015 | 789.2 | 919 | 921 | 218.1 |
| C | 14 | 238 | 149154 | 679.77 | 919 | 921 | 218.1 |
| D | 8 | 195 | 2774422 | 12082.57 | 924 | 901 | 229.5 |
| D | 2 | 250 | 33018 | 139.91 | 924 | 901 | 229.5 |
| D | 2 | 234 | 28983 | 122.34 | 924 | 901 | 229.5 |
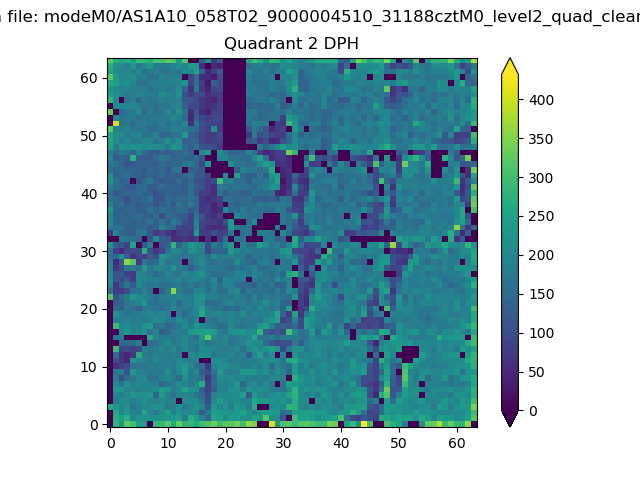
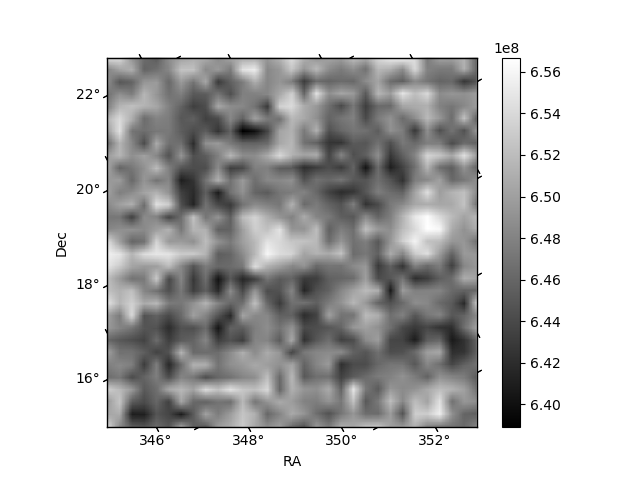
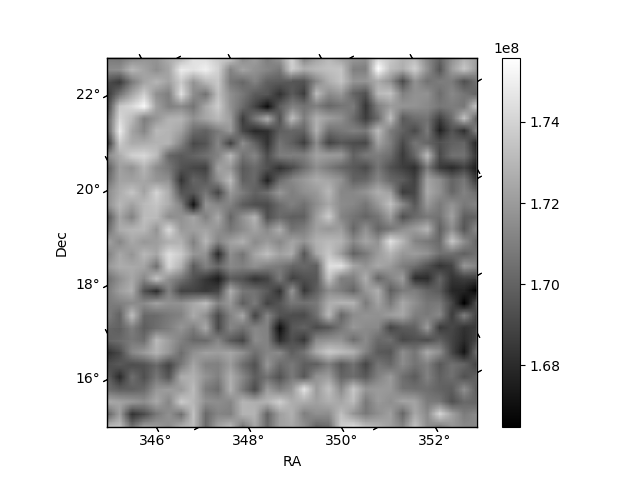
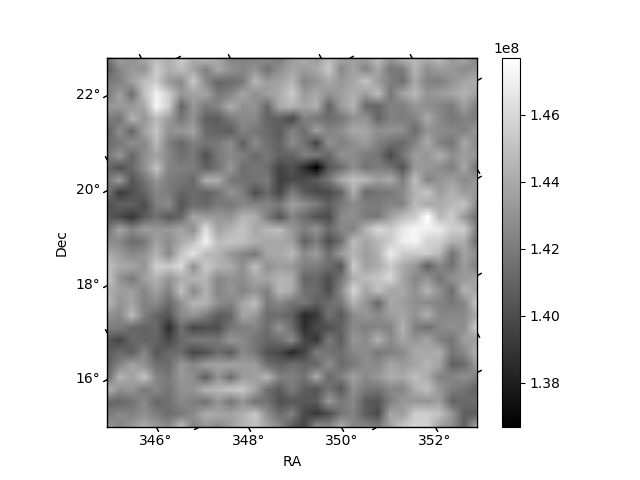
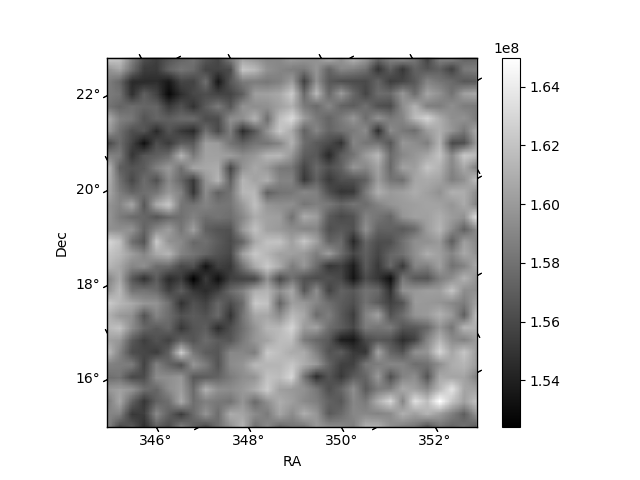
Histogram calculated using DETX and DETY for each event in the final _common_clean file
| Quadrant A | 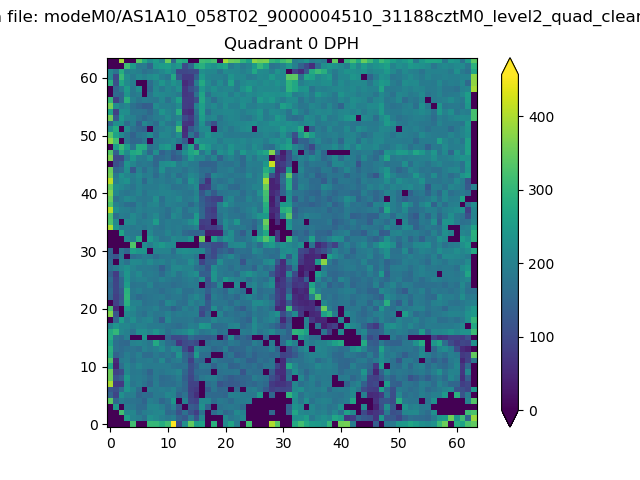 |
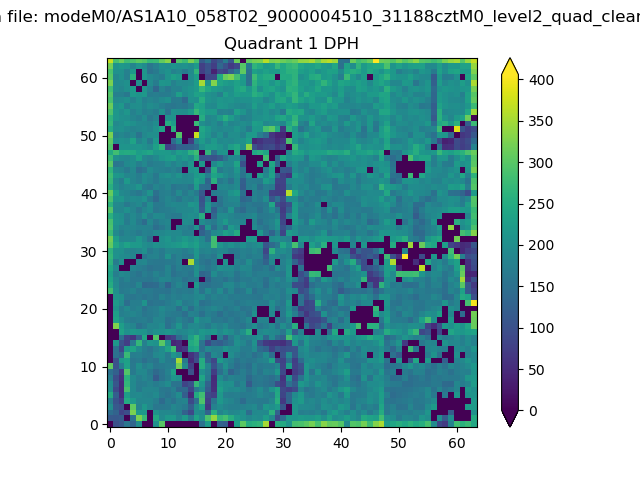 |
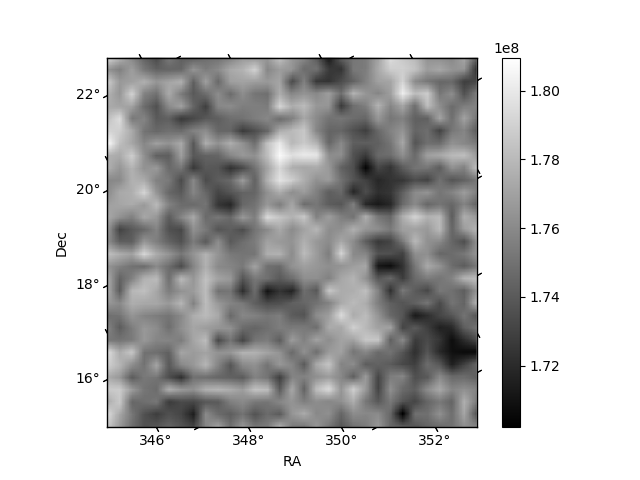
Quadrant B |
|---|---|---|---|
| Quadrant D | 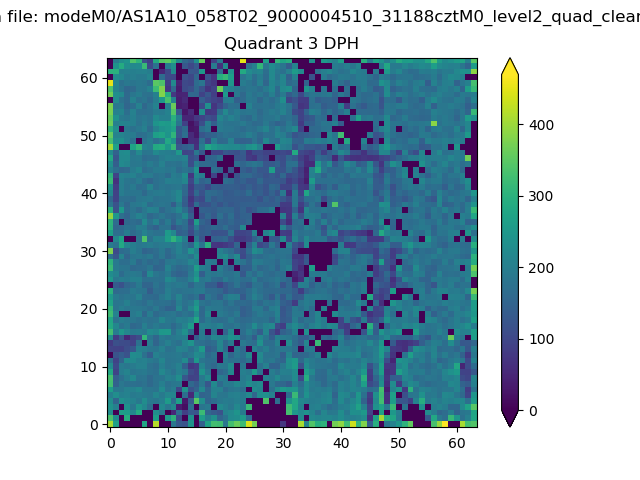 |
 |
Quadrant C |
| Plot type | Count rate plots | Images |
|---|---|---|
| Comparison with Poisson distribution Blue bars denote a histogram of data divided into 1 sec bins. Red curve is a Poisson curve with rate = median count rate of data. |
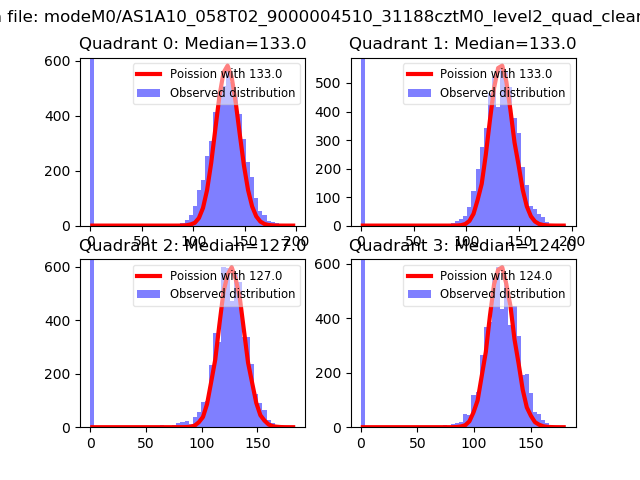 |
 |
| Quadrant-wise count rates Data is divided into 100 sec bins |
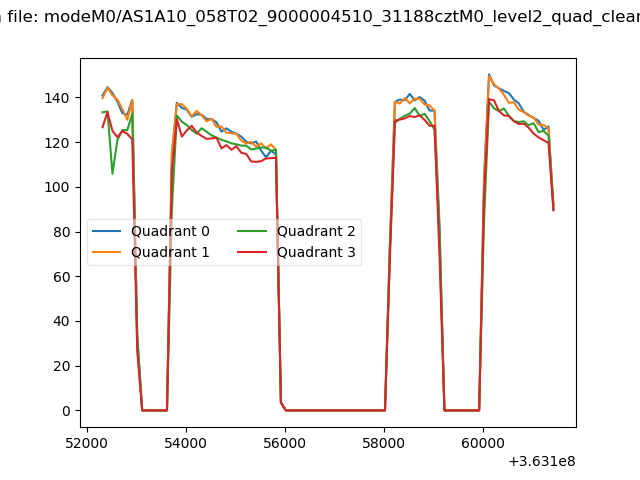 |
|
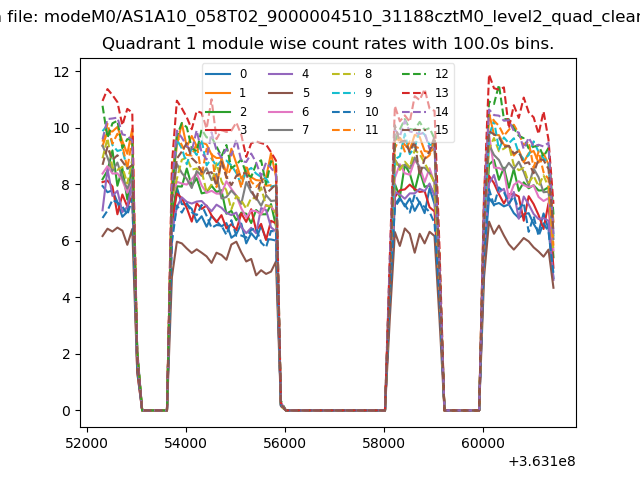
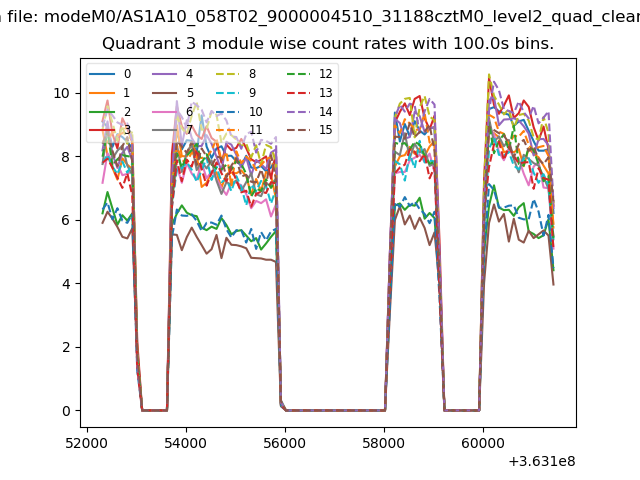
| Module-wise count rates for Quadrant A Data is divided into 100 sec bins |
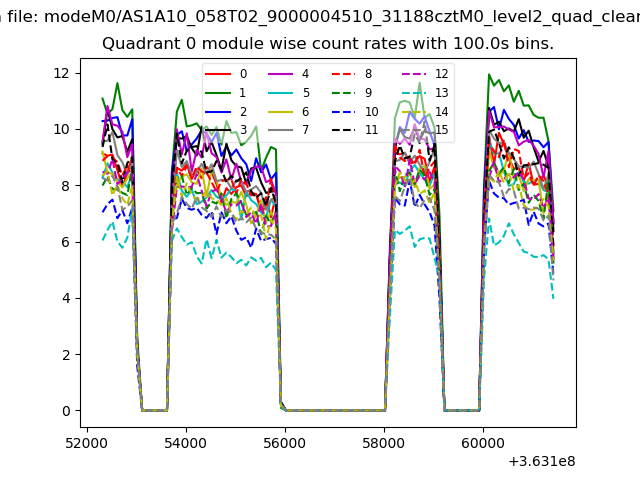 |
 |
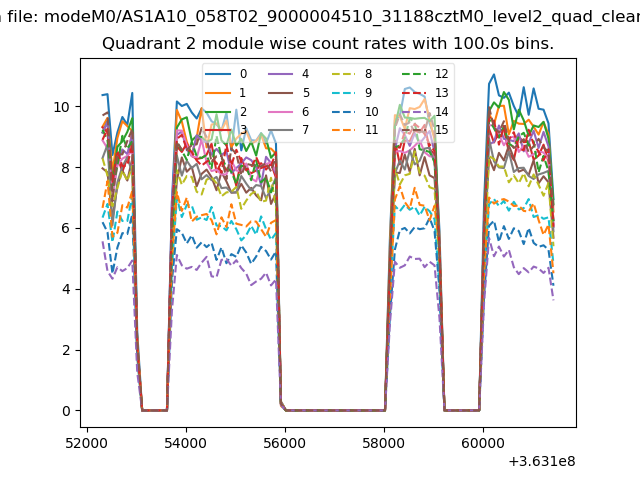
| Module-wise count rates for Quadrant B Data is divided into 100 sec bins |
 |
 |
| Module-wise count rates for Quadrant C Data is divided into 100 sec bins |
 |
 |
| Module-wise count rates for Quadrant D Data is divided into 100 sec bins |
 |
 |
| Parameter | Plot |
|---|---|
| CZT HV Monitor | 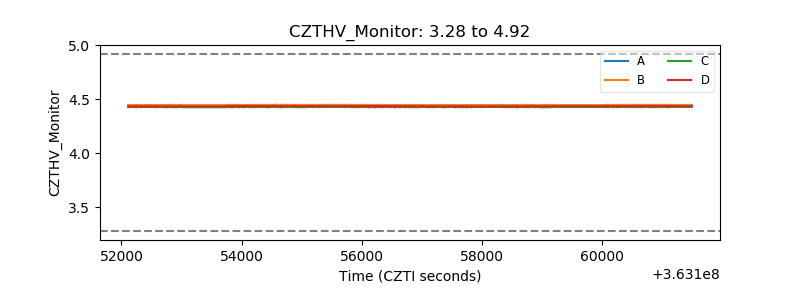 |
| D_VDD | 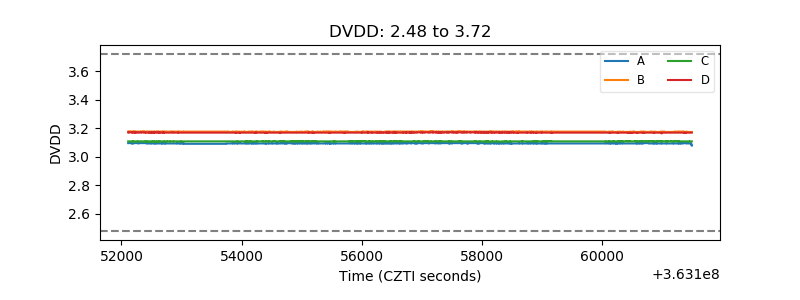 |
| Temperature 1 |  |
| Veto HV Monitor |  |
| Veto LLD | 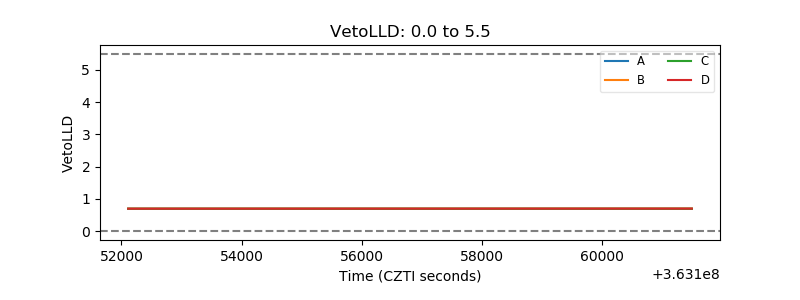 |
| Alpha Counter | 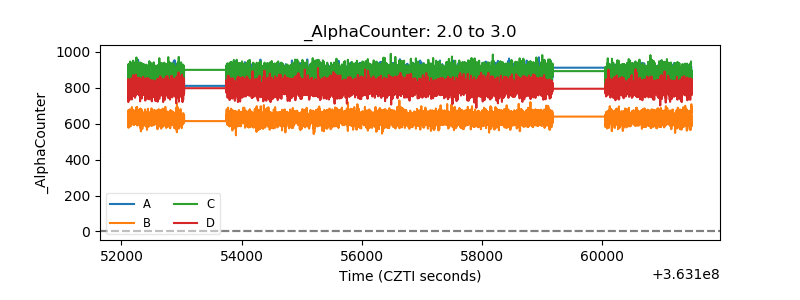 |
| _CPM_Rate | 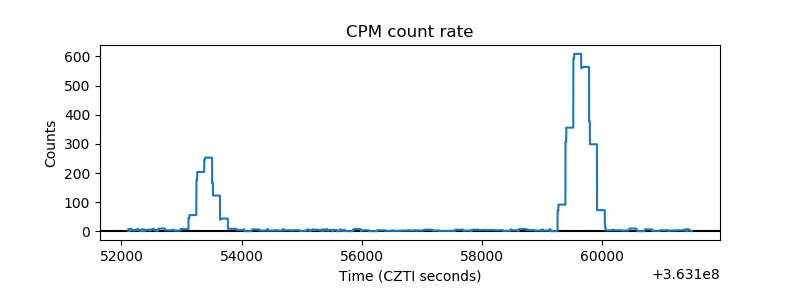 |
| CZT Counter | 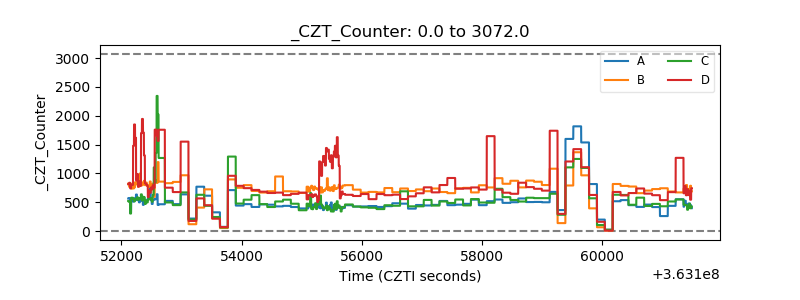 |
| +2.5 Volts monitor |  |
| +5 Volts monitor |  |
| _ROLL_ROT | 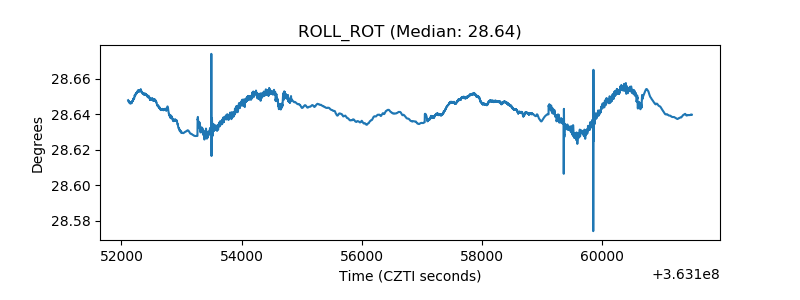 |
| _Roll_DEC | 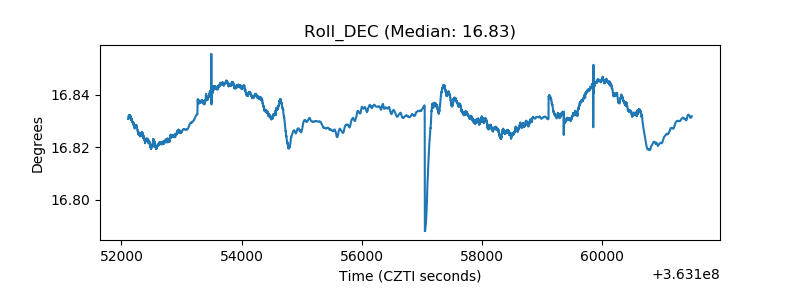 |
| _Roll_RA | 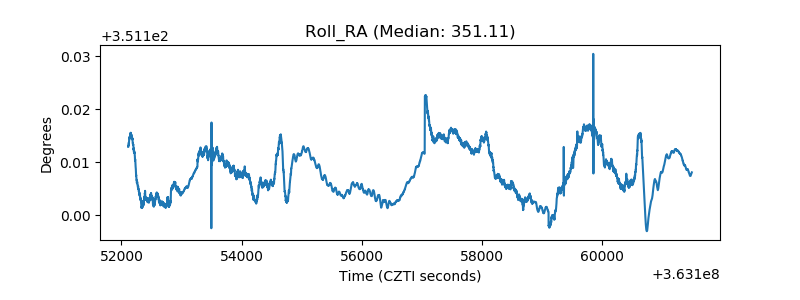 |
| Veto Counter | 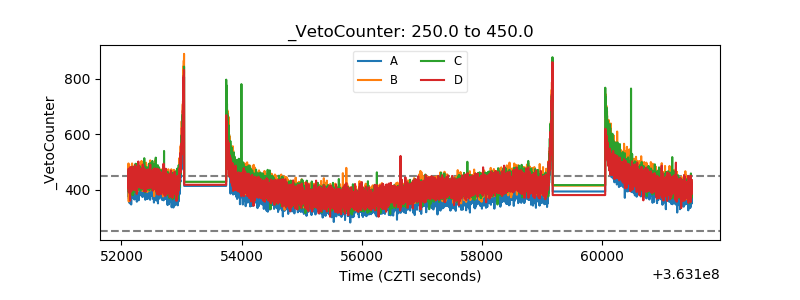 |