| Param | Original file | Final file |
|---|---|---|
| Filename | modeM0/AS1A10_058T02_9000004510_31189cztM0_level2.evt | modeM0/AS1A10_058T02_9000004510_31189cztM0_level2_quad_clean.evt |
| Size (bytes) | 552,810,240 | 78,995,520 |
| Size | 527.2 MB | 75.3 MB |
| Events in quadrant A | 2,898,762 | 506,547 |
| Events in quadrant B | 5,807,713 | 504,488 |
| Events in quadrant C | 2,993,126 | 482,621 |
| Events in quadrant D | 4,635,324 | 478,463 |
| Mode M0 | |||
|---|---|---|---|
| Quadrant | BADHDUFLAG | Total packets | Discarded packets |
| A | 0 | 12246 | 1 |
| B | 0 | 21531 | 1 |
| C | 0 | 12554 | 1 |
| D | 0 | 18609 | 1 |
| Mode SS | |||
|---|---|---|---|
| Quadrant | BADHDUFLAG | Total packets | Discarded packets |
| A | 0 | 122 | 0 |
| B | 0 | 122 | 0 |
| C | 0 | 122 | 0 |
| D | 0 | 122 | 0 |
| Mode M9 | |||
|---|---|---|---|
| Quadrant | BADHDUFLAG | Total packets | Discarded packets |
| A | 0 | 10 | 0 |
| B | 0 | 10 | 0 |
| C | 0 | 10 | 0 |
| D | 0 | 10 | 0 |
| Quadrant | Total seconds | Saturated seconds | Saturation percentage |
|---|---|---|---|
| A | 6013 | 25 | 0.415766% |
| B | 6013 | 709 | 11.791119% |
| C | 6013 | 94 | 1.563280% |
| D | 6013 | 53 | 0.881424% |
Noise dominated data is calculated using 1-second bins in cleaned event files. If a bin has >2000 counts, and if more than 50% of those come from <1% of pixels, then it is considered to be noise-dominated and hence unusable.
| Quadrant | # 1 sec bins | Bins with >0 counts | Bins with >2000 counts | High rate bins dominated by noise | Noise dominated (total time) | Noise dominated (detector-on time) | Marked lightcurve |
|---|---|---|---|---|---|---|---|
| A | 7038 | 6014 | 0 | 0 | 0.00% | 0.00% | 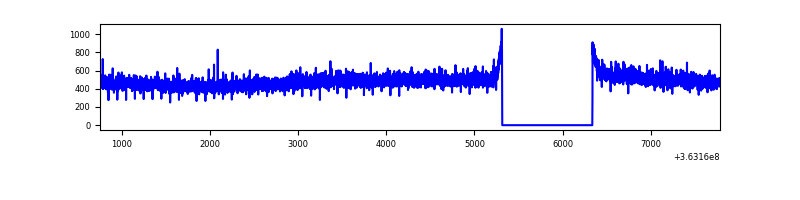 |
| B | 7038 | 6014 | 420 | 420 | 5.97% | 6.98% | 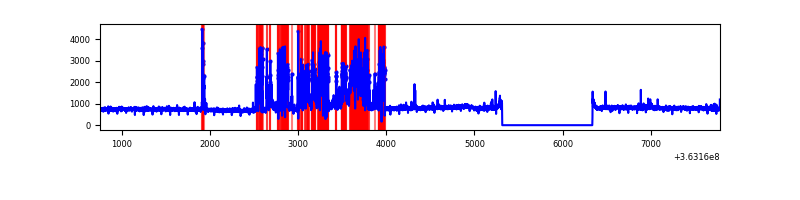 |
| C | 7038 | 6014 | 5 | 5 | 0.07% | 0.08% | 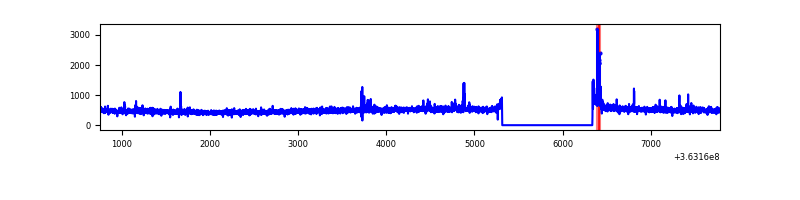 |
| D | 7038 | 6014 | 10 | 10 | 0.14% | 0.17% | 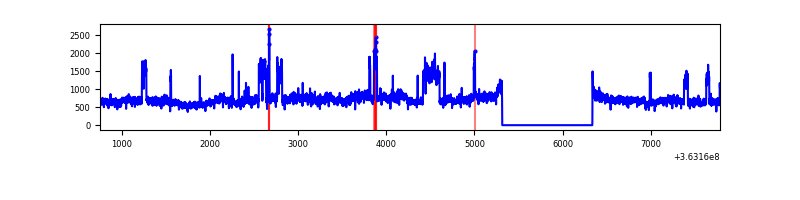 |
Top three noisy pixels from each quadrant. If the there are fewer than three noisy pixels in the level2.evt file, extra rows are filled as -1
| Pixel properties | Quadrant properties | ||||||
|---|---|---|---|---|---|---|---|
| Quadrant | DetID | PixID | Counts | Sigma | Mean | Median | Sigma |
| A | 13 | 254 | 11334 | 70.48 | 750 | 735 | 150.4 |
| A | 3 | 137 | 7644 | 45.95 | 750 | 735 | 150.4 |
| A | 0 | 226 | 6338 | 37.26 | 750 | 735 | 150.4 |
| B | 6 | 159 | 1553771 | 11396.28 | 699 | 682 | 136.3 |
| B | 4 | 80 | 1391986 | 10209.13 | 699 | 682 | 136.3 |
| B | 10 | 247 | 54324 | 393.62 | 699 | 682 | 136.3 |
| C | 14 | 238 | 124928 | 740.9 | 708 | 710 | 167.7 |
| C | 0 | 10 | 62839 | 370.57 | 708 | 710 | 167.7 |
| C | 14 | 254 | 16174 | 92.24 | 708 | 710 | 167.7 |
| D | 8 | 195 | 1859327 | 10580.4 | 718 | 701 | 175.7 |
| D | 2 | 234 | 21548 | 118.67 | 718 | 701 | 175.7 |
| D | 2 | 250 | 18633 | 102.08 | 718 | 701 | 175.7 |
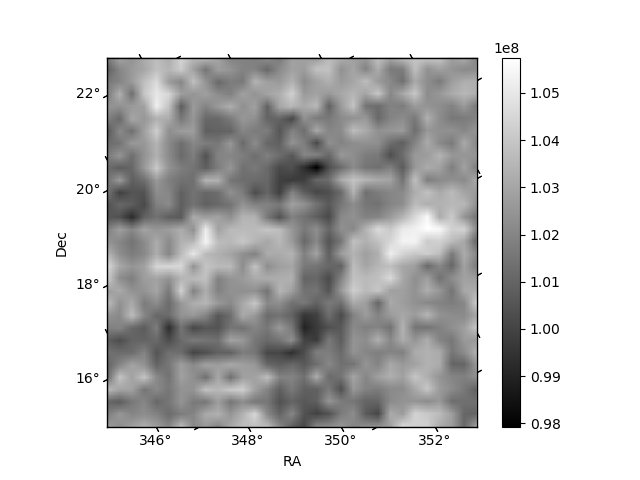
Histogram calculated using DETX and DETY for each event in the final _common_clean file
| Quadrant A | 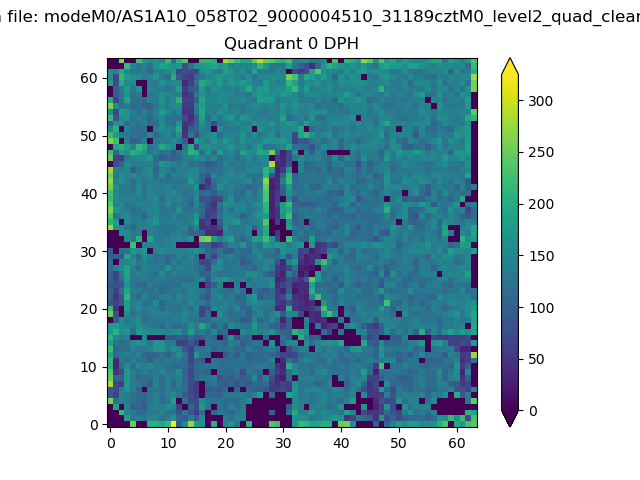 |
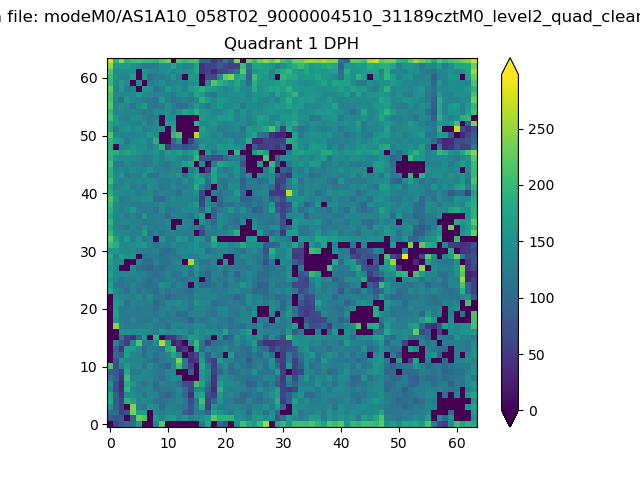 |
Quadrant B |
|---|---|---|---|
| Quadrant D |  |
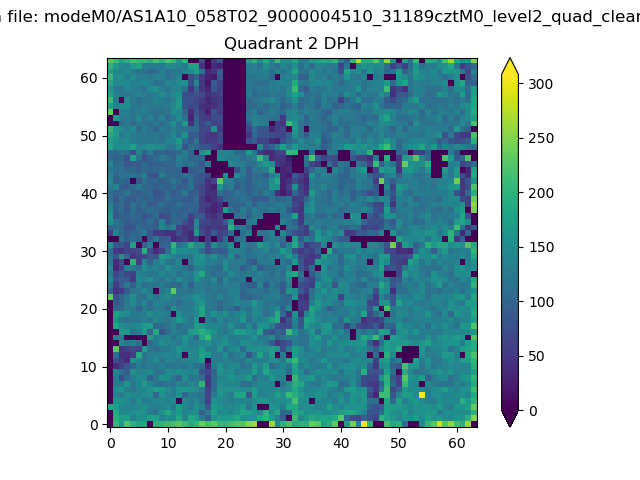 |
Quadrant C |
| Plot type | Count rate plots | Images |
|---|---|---|
| Comparison with Poisson distribution Blue bars denote a histogram of data divided into 1 sec bins. Red curve is a Poisson curve with rate = median count rate of data. |
 |
 |
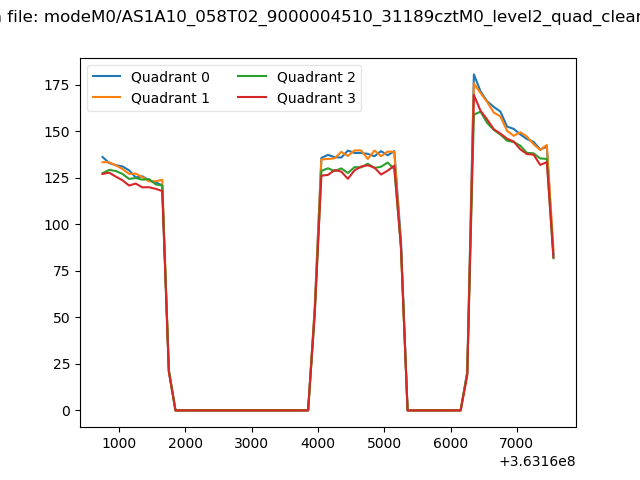
| Quadrant-wise count rates Data is divided into 100 sec bins |
 |
|
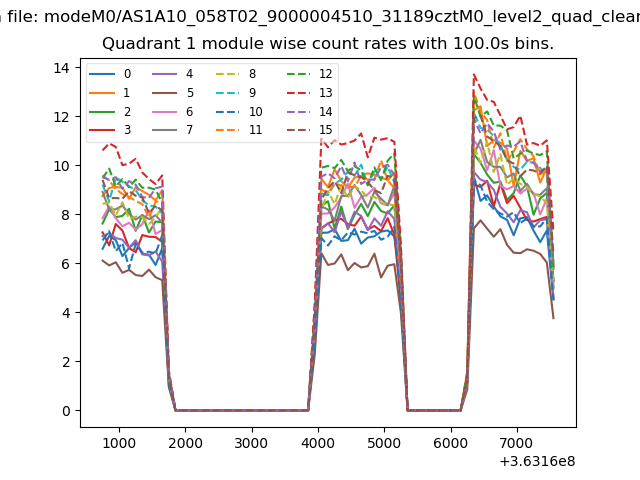
| Module-wise count rates for Quadrant A Data is divided into 100 sec bins |
 |
 |
| Module-wise count rates for Quadrant B Data is divided into 100 sec bins |
 |
 |
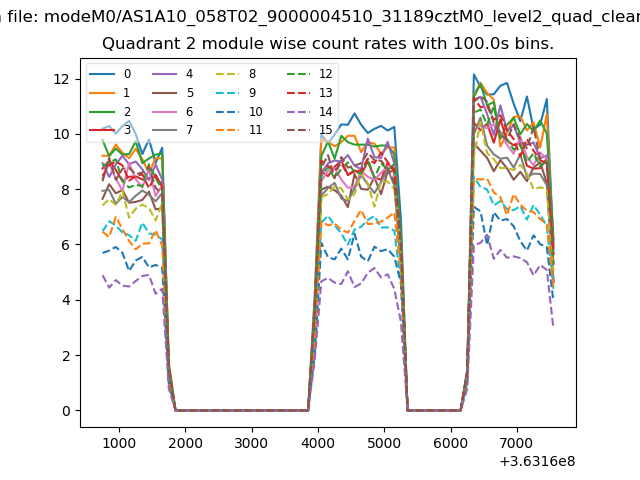
| Module-wise count rates for Quadrant C Data is divided into 100 sec bins |
 |
 |
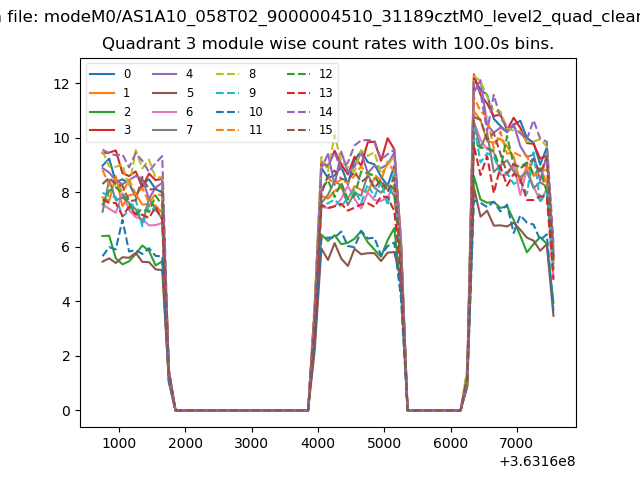
| Module-wise count rates for Quadrant D Data is divided into 100 sec bins |
 |
 |
| Parameter | Plot |
|---|---|
| CZT HV Monitor | 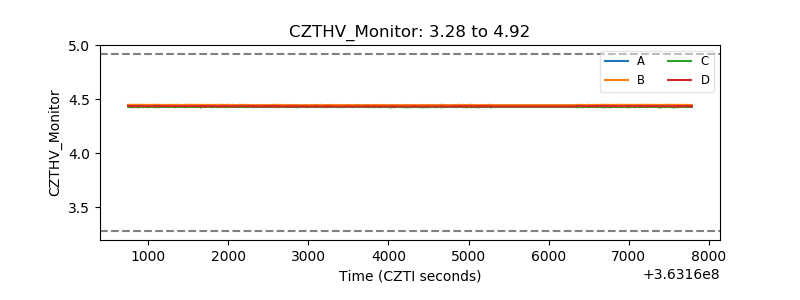 |
| D_VDD | 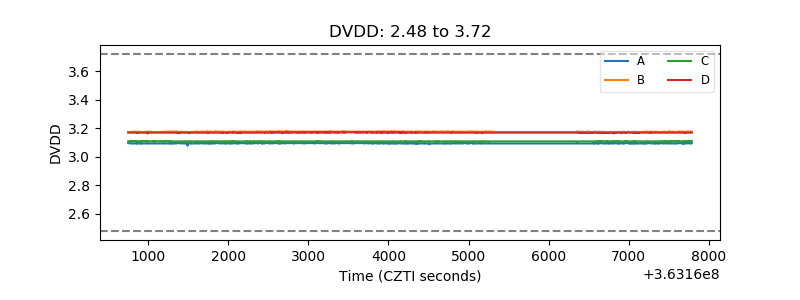 |
| Temperature 1 | 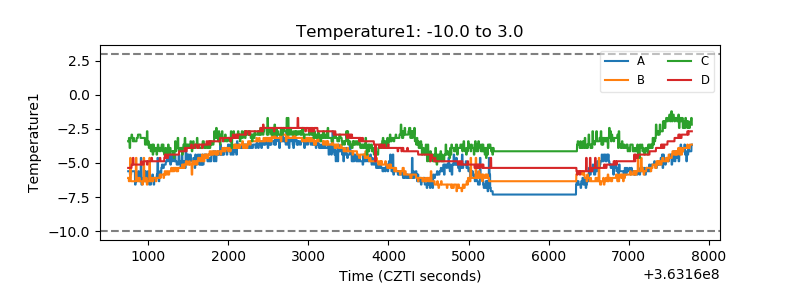 |
| Veto HV Monitor | 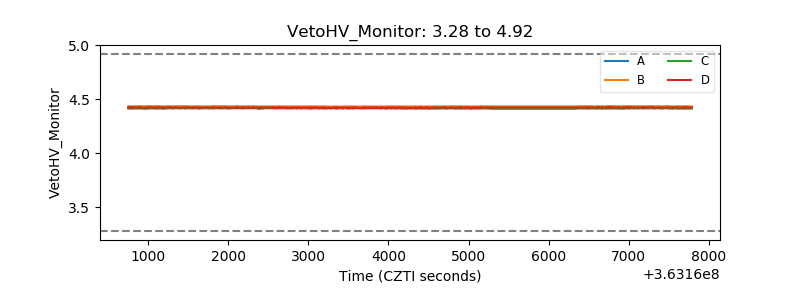 |
| Veto LLD | 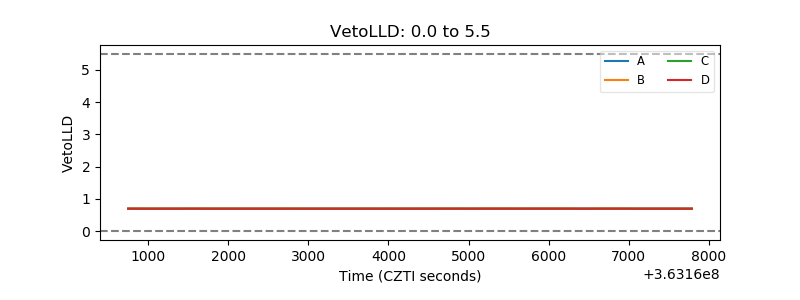 |
| Alpha Counter | 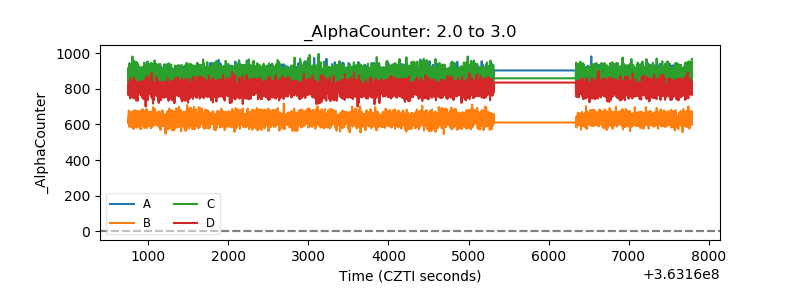 |
| _CPM_Rate | 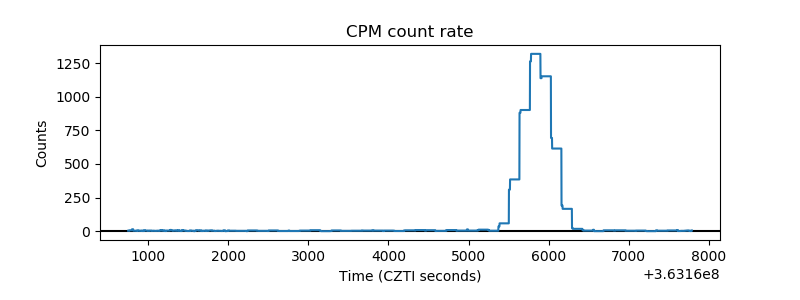 |
| CZT Counter | 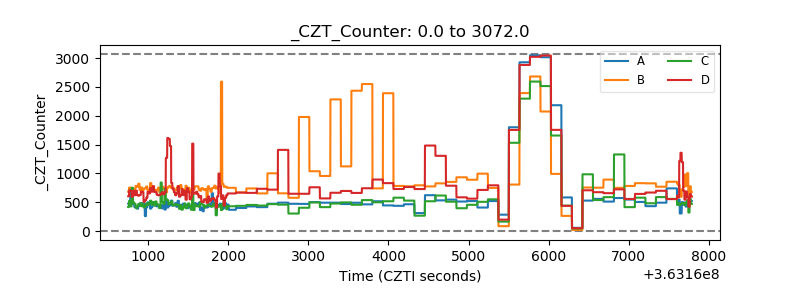 |
| +2.5 Volts monitor | 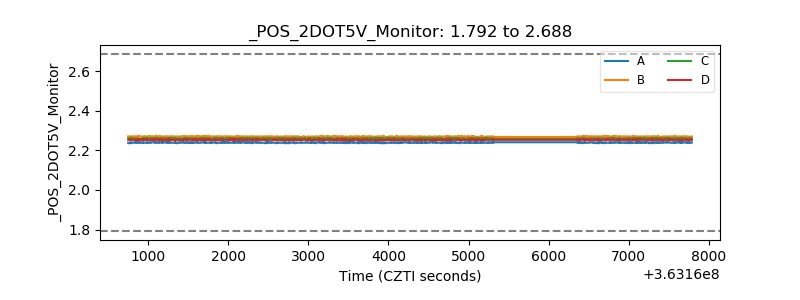 |
| +5 Volts monitor | 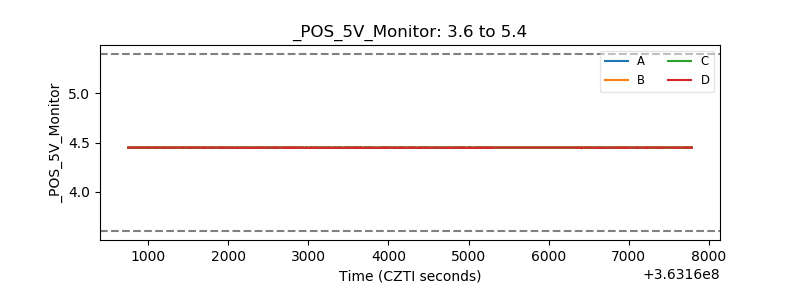 |
| _ROLL_ROT | 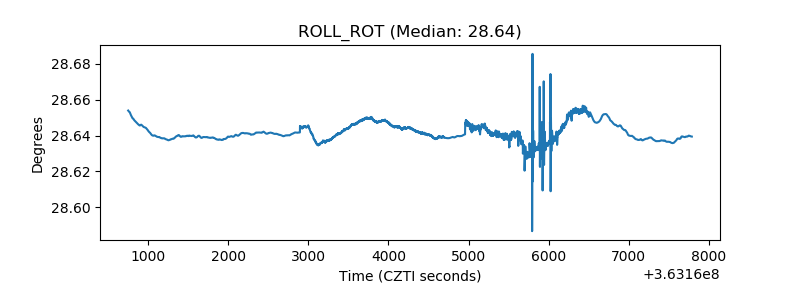 |
| _Roll_DEC | 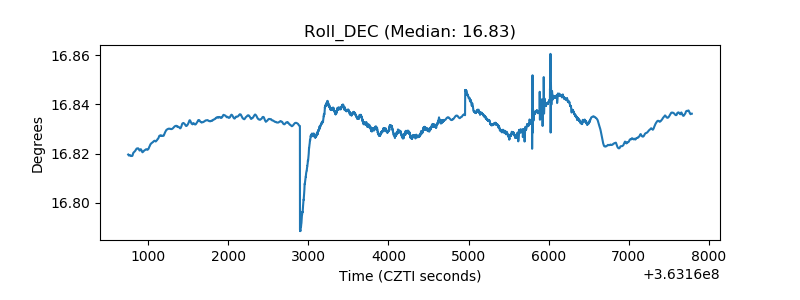 |
| _Roll_RA | 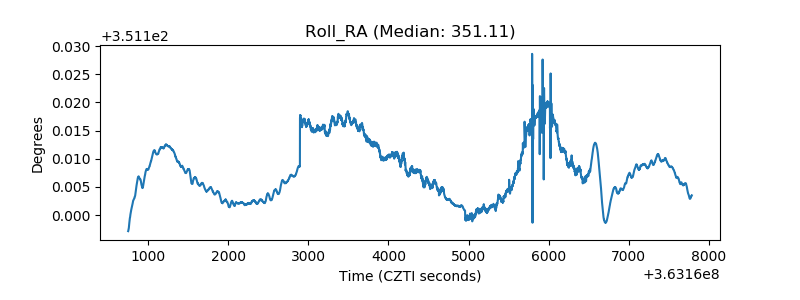 |
| Veto Counter | 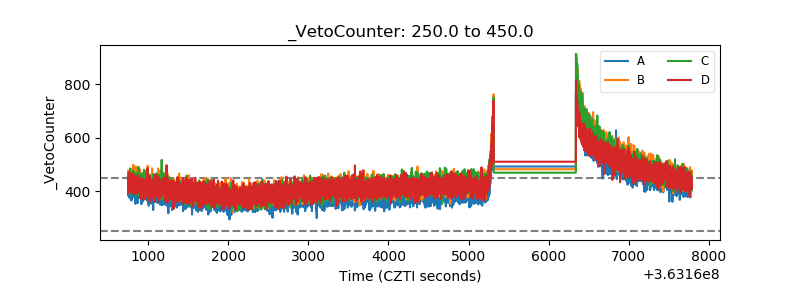 |