| Param | Original file | Final file |
|---|---|---|
| Filename | modeM0/AS1A10_058T02_9000004510_31191cztM0_level2.evt | modeM0/AS1A10_058T02_9000004510_31191cztM0_level2_quad_clean.evt |
| Size (bytes) | 385,096,320 | 46,252,800 |
| Size | 367.3 MB | 44.1 MB |
| Events in quadrant A | 2,039,983 | 286,114 |
| Events in quadrant B | 3,215,694 | 283,411 |
| Events in quadrant C | 2,159,111 | 269,932 |
| Events in quadrant D | 3,964,082 | 266,018 |
| Mode M0 | |||
|---|---|---|---|
| Quadrant | BADHDUFLAG | Total packets | Discarded packets |
| A | 0 | 8456 | 0 |
| B | 0 | 12611 | 0 |
| C | 0 | 8814 | 0 |
| D | 0 | 14948 | 0 |
| Mode SS | |||
|---|---|---|---|
| Quadrant | BADHDUFLAG | Total packets | Discarded packets |
| A | 0 | 84 | 0 |
| B | 0 | 84 | 0 |
| C | 0 | 84 | 0 |
| D | 0 | 84 | 0 |
| Quadrant | Total seconds | Saturated seconds | Saturation percentage |
|---|---|---|---|
| A | 4180 | 3 | 0.071770% |
| B | 4181 | 16 | 0.382684% |
| C | 4181 | 21 | 0.502272% |
| D | 4181 | 114 | 2.726620% |
Noise dominated data is calculated using 1-second bins in cleaned event files. If a bin has >2000 counts, and if more than 50% of those come from <1% of pixels, then it is considered to be noise-dominated and hence unusable.
| Quadrant | # 1 sec bins | Bins with >0 counts | Bins with >2000 counts | High rate bins dominated by noise | Noise dominated (total time) | Noise dominated (detector-on time) | Marked lightcurve |
|---|---|---|---|---|---|---|---|
| A | 4180 | 4180 | 0 | 0 | 0.00% | 0.00% | 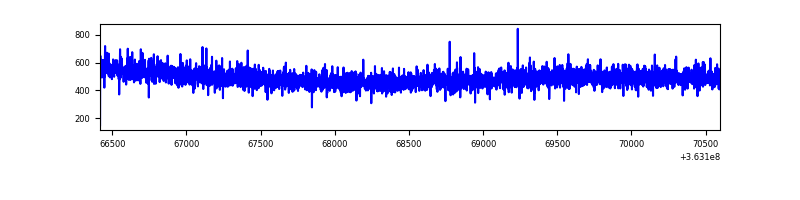 |
| B | 4181 | 4181 | 1 | 1 | 0.02% | 0.02% | 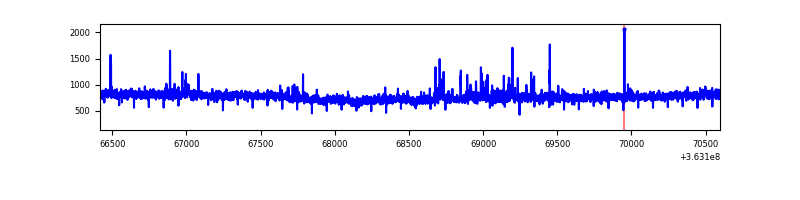 |
| C | 4181 | 4181 | 1 | 1 | 0.02% | 0.02% |  |
| D | 4181 | 4181 | 77 | 77 | 1.84% | 1.84% | 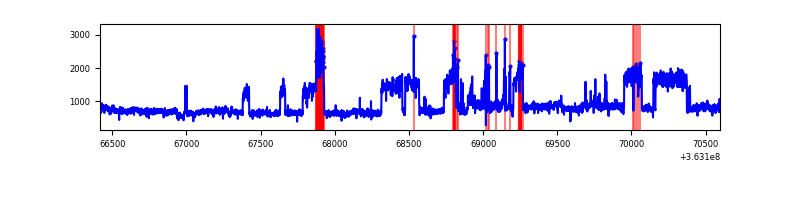 |
Top three noisy pixels from each quadrant. If the there are fewer than three noisy pixels in the level2.evt file, extra rows are filled as -1
| Pixel properties | Quadrant properties | ||||||
|---|---|---|---|---|---|---|---|
| Quadrant | DetID | PixID | Counts | Sigma | Mean | Median | Sigma |
| A | 13 | 254 | 8349 | 74.22 | 528 | 518 | 105.5 |
| A | 3 | 137 | 5113 | 43.55 | 528 | 518 | 105.5 |
| A | 0 | 226 | 4474 | 37.49 | 528 | 518 | 105.5 |
| B | 6 | 159 | 1101751 | 11074.11 | 516 | 504 | 99.4 |
| B | 0 | 230 | 43192 | 429.27 | 516 | 504 | 99.4 |
| B | 4 | 80 | 12285 | 118.47 | 516 | 504 | 99.4 |
| C | 0 | 10 | 130783 | 1109.32 | 495 | 498 | 117.4 |
| C | 14 | 238 | 81222 | 687.33 | 495 | 498 | 117.4 |
| C | 2 | 114 | 9286 | 74.83 | 495 | 498 | 117.4 |
| D | 8 | 195 | 1953666 | 15572.38 | 501 | 490 | 125.4 |
| D | 2 | 250 | 36091 | 283.84 | 501 | 490 | 125.4 |
| D | 12 | 233 | 34791 | 273.48 | 501 | 490 | 125.4 |
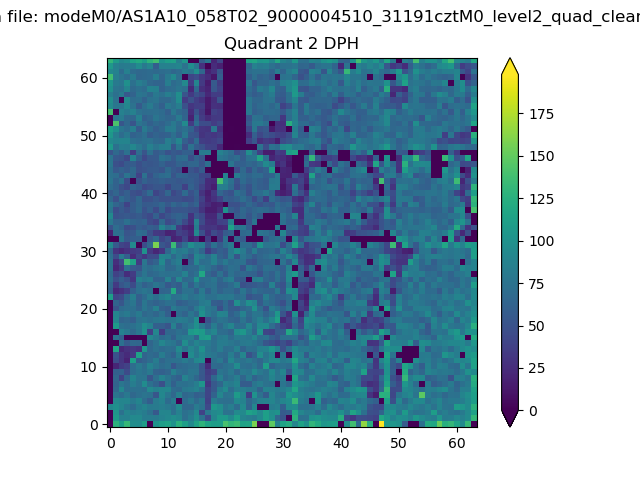
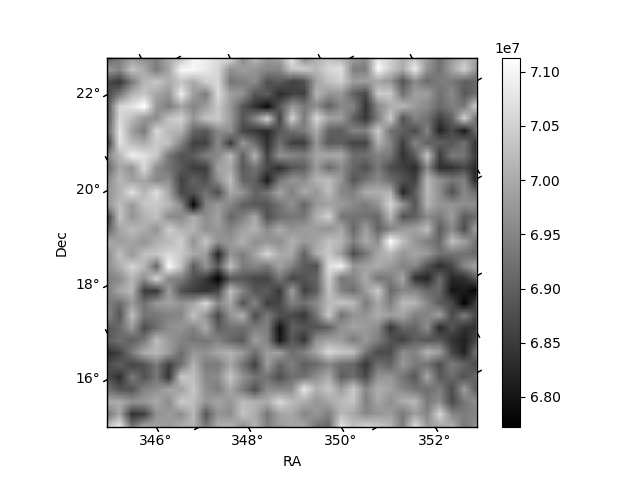
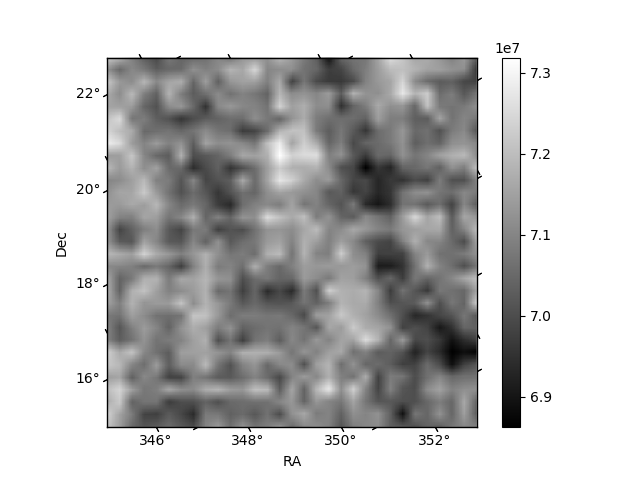
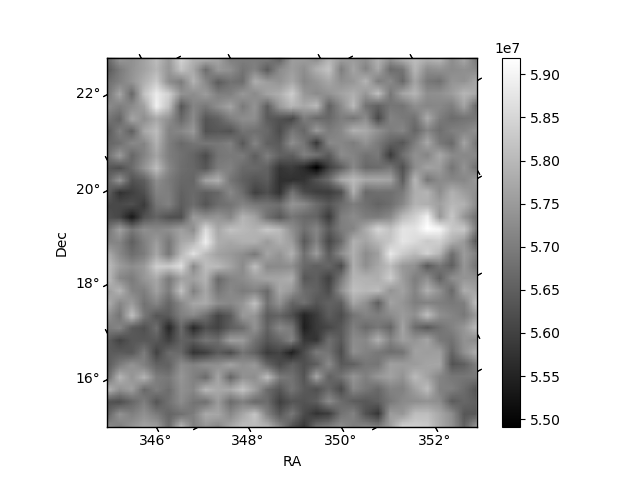
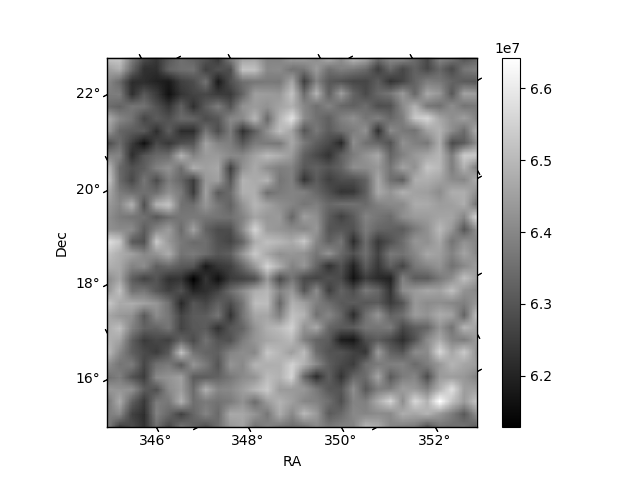
Histogram calculated using DETX and DETY for each event in the final _common_clean file
| Quadrant A | 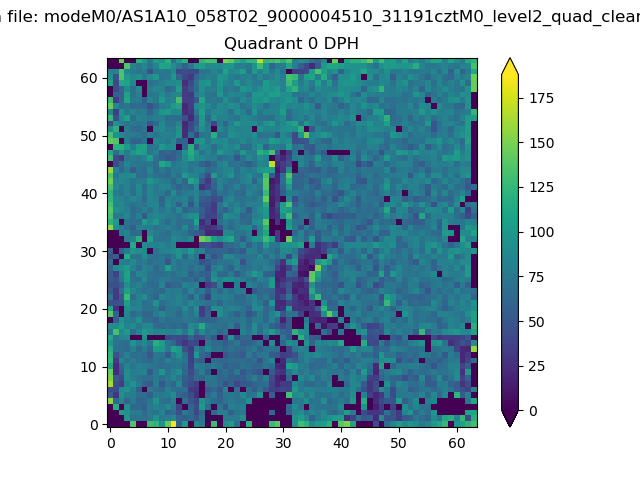 |
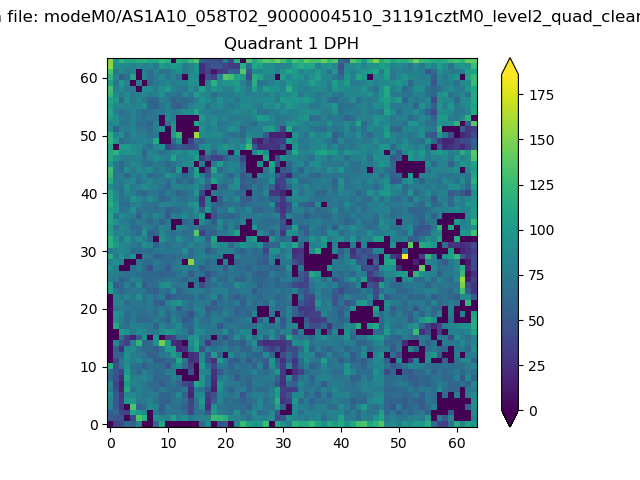 |
Quadrant B |
|---|---|---|---|
| Quadrant D | 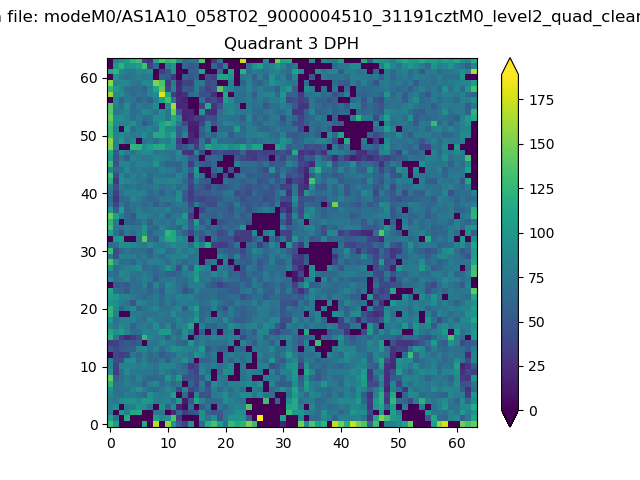 |
 |
Quadrant C |
| Plot type | Count rate plots | Images |
|---|---|---|
| Comparison with Poisson distribution Blue bars denote a histogram of data divided into 1 sec bins. Red curve is a Poisson curve with rate = median count rate of data. |
 |
 |
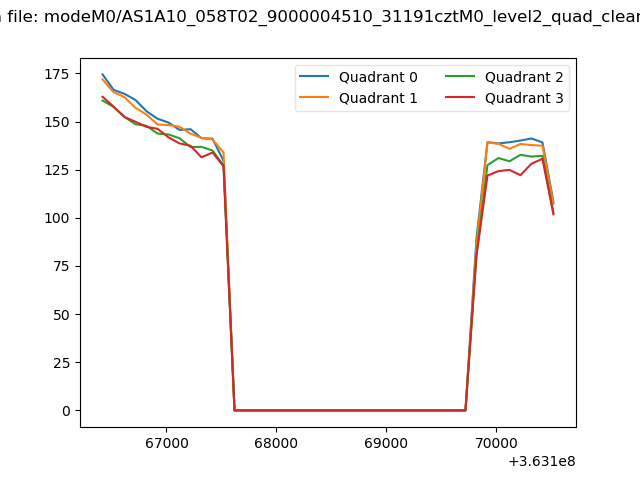
| Quadrant-wise count rates Data is divided into 100 sec bins |
 |
|
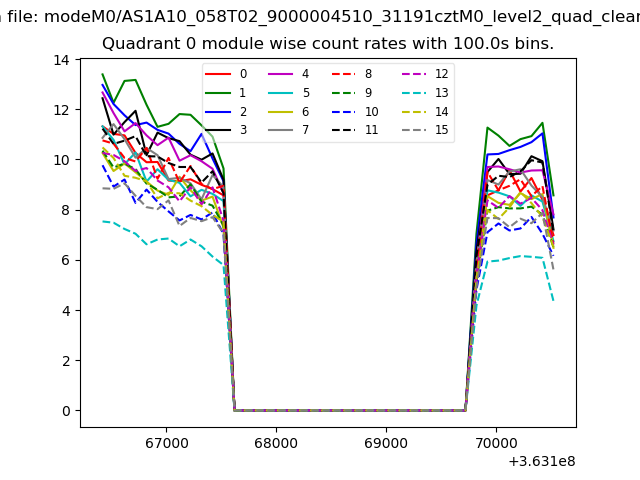
| Module-wise count rates for Quadrant A Data is divided into 100 sec bins |
 |
 |
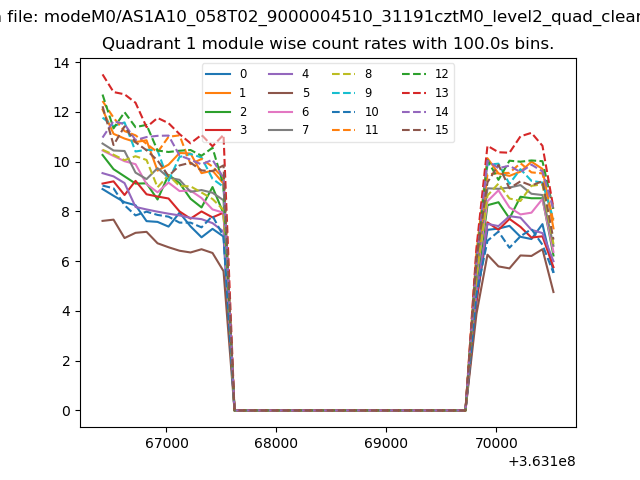
| Module-wise count rates for Quadrant B Data is divided into 100 sec bins |
 |
 |
| Module-wise count rates for Quadrant C Data is divided into 100 sec bins |
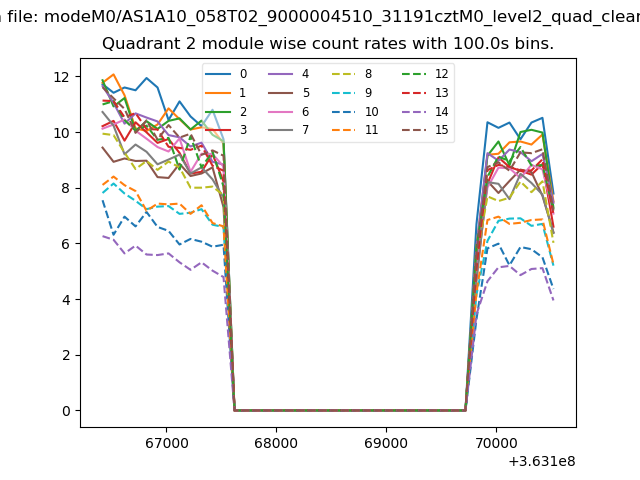 |
 |
| Module-wise count rates for Quadrant D Data is divided into 100 sec bins |
 |
 |
| Parameter | Plot |
|---|---|
| CZT HV Monitor | 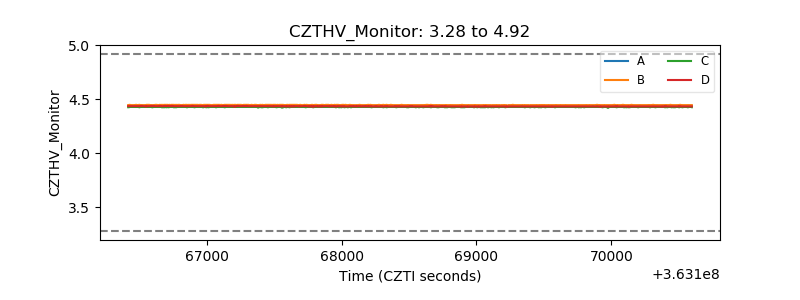 |
| D_VDD | 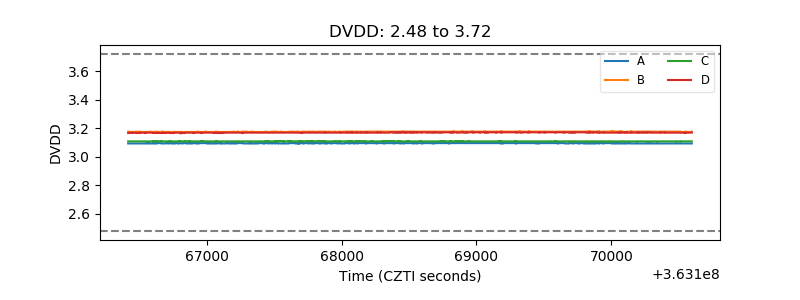 |
| Temperature 1 | 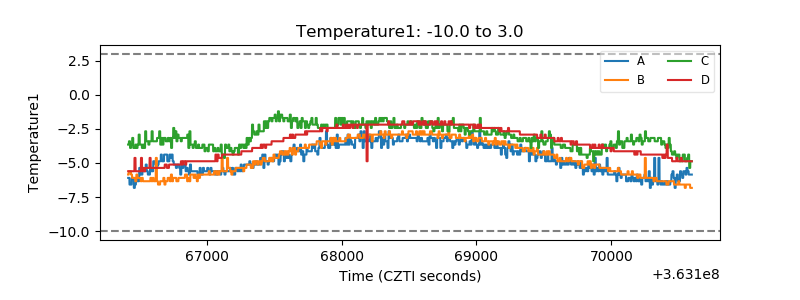 |
| Veto HV Monitor | 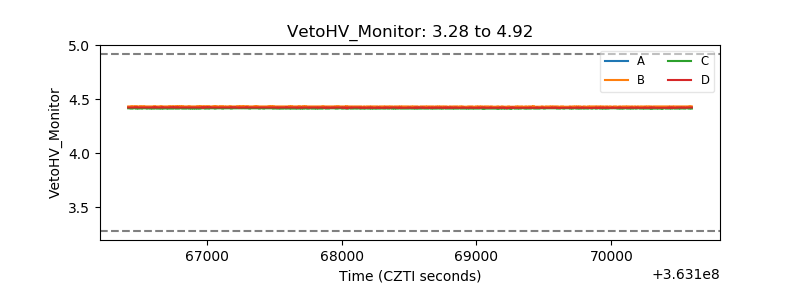 |
| Veto LLD | 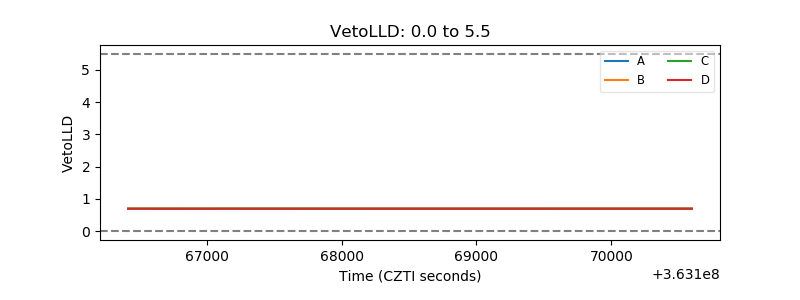 |
| Alpha Counter | 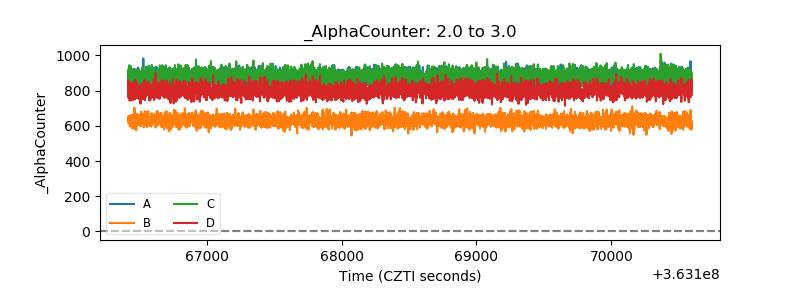 |
| _CPM_Rate | 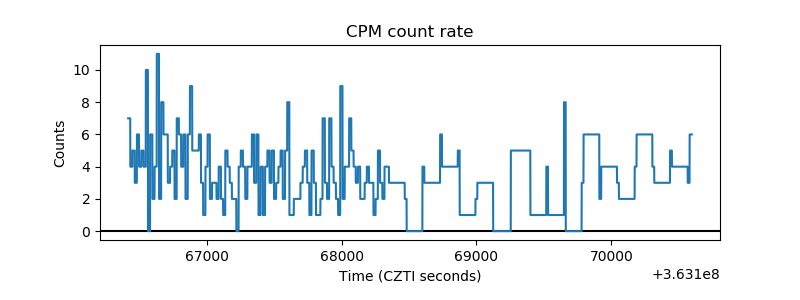 |
| CZT Counter | 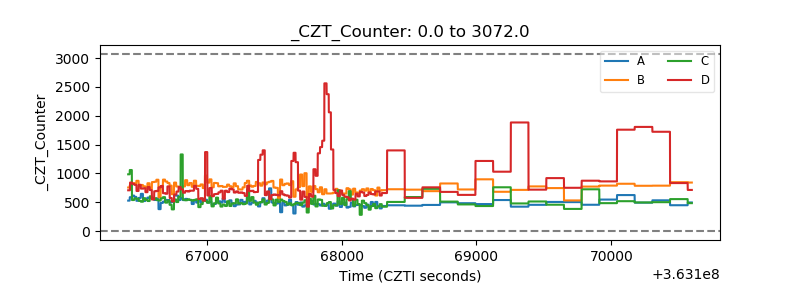 |
| +2.5 Volts monitor | 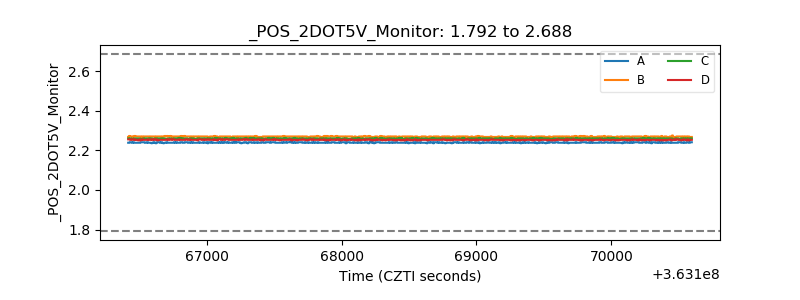 |
| +5 Volts monitor |  |
| _ROLL_ROT | 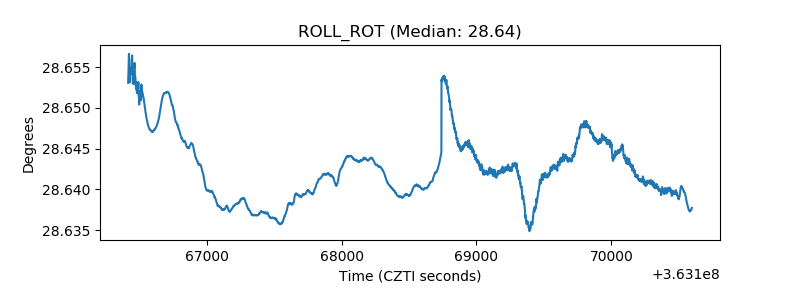 |
| _Roll_DEC | 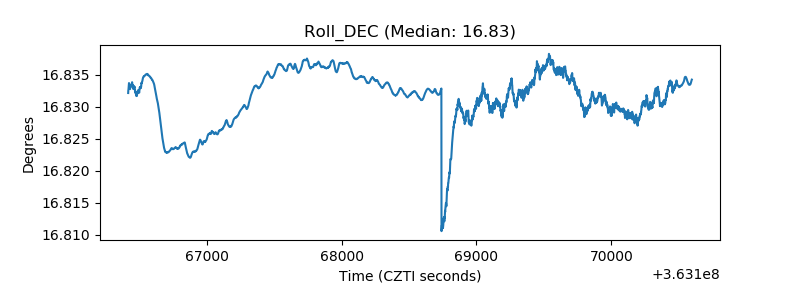 |
| _Roll_RA | 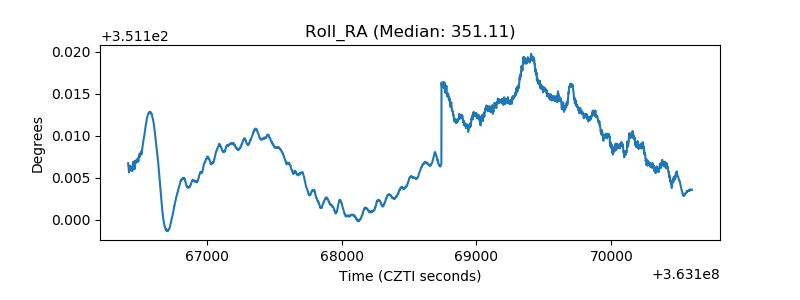 |
| Veto Counter | 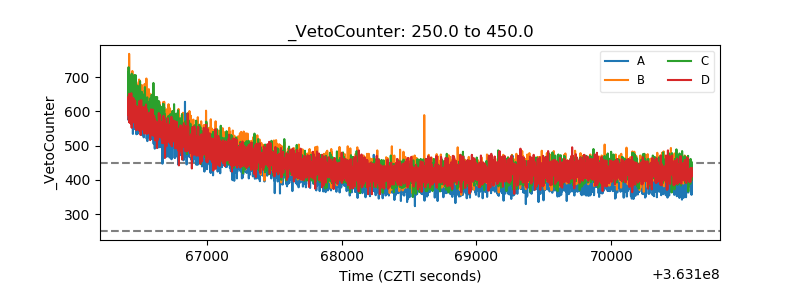 |