| Param | Original file | Final file |
|---|---|---|
| Filename | modeM0/AS1C06_001T01_9000004508cztM0_level2.fits | modeM0/AS1C06_001T01_9000004508cztM0_level2_quad_clean.evt |
| Size (bytes) | 253,278,720 | 172,537,920 |
| Size | 241.5 MB | 164.5 MB |
| Events in quadrant A | 1,616,956 | 963,122 |
| Events in quadrant B | 1,514,826 | 949,644 |
| Events in quadrant C | 1,568,424 | 899,349 |
| Events in quadrant D | 1,368,798 | 809,671 |
| Mode SS | |||
|---|---|---|---|
| Quadrant | BADHDUFLAG | Total packets | Discarded packets |
| A | 0 | 476 | 0 |
| B | 0 | 476 | 0 |
| C | 0 | 476 | 0 |
| D | 0 | 476 | 0 |
| Mode M9 | |||
|---|---|---|---|
| Quadrant | BADHDUFLAG | Total packets | Discarded packets |
| A | 0 | 56 | 0 |
| B | 0 | 56 | 0 |
| C | 0 | 56 | 0 |
| D | 0 | 56 | 0 |
| Mode M0 | |||
|---|---|---|---|
| Quadrant | BADHDUFLAG | Total packets | Discarded packets |
| A | 0 | 50671 | 0 |
| B | 0 | 71718 | 0 |
| C | 0 | 52309 | 0 |
| D | 0 | 76919 | 0 |
| Quadrant | Total seconds | Saturated seconds | Saturation percentage |
|---|---|---|---|
| A | 23269 | 317 | 1.362328% |
| B | 23269 | 651 | 2.797714% |
| C | 23269 | 748 | 3.214577% |
| D | 23269 | 1109 | 4.765998% |
Noise dominated data is calculated using 1-second bins in cleaned event files. If a bin has >2000 counts, and if more than 50% of those come from <1% of pixels, then it is considered to be noise-dominated and hence unusable.
| Quadrant | # 1 sec bins | Bins with >0 counts | Bins with >2000 counts | High rate bins dominated by noise | Noise dominated (total time) | Noise dominated (detector-on time) | Marked lightcurve |
|---|---|---|---|---|---|---|---|
| A | 28889 | 23269 | 0 | 0 | 0.00% | 0.00% |  |
| B | 28889 | 23269 | 0 | 0 | 0.00% | 0.00% |  |
| C | 28889 | 23269 | 0 | 0 | 0.00% | 0.00% |  |
| D | 28889 | 23268 | 0 | 0 | 0.00% | 0.00% |  |
Top three noisy pixels from each quadrant. If the there are fewer than three noisy pixels in the level2.evt file, extra rows are filled as -1
| Pixel properties | Quadrant properties | ||||||
|---|---|---|---|---|---|---|---|
| Quadrant | DetID | PixID | Counts | Sigma | Mean | Median | Sigma |
| A | 0 | 29 | 1545 | 11.11 | 421 | 398 | 103.2 |
| A | 7 | 110 | 1275 | 8.49 | 421 | 398 | 103.2 |
| A | 0 | 30 | 1219 | 7.95 | 421 | 398 | 103.2 |
| B | 2 | 9 | 1196 | 9.85 | 400 | 383 | 82.6 |
| B | 2 | 8 | 1032 | 7.86 | 400 | 383 | 82.6 |
| B | 5 | 128 | 1013 | 7.63 | 400 | 383 | 82.6 |
| C | 3 | 202 | 1197 | 7.66 | 414 | 391 | 105.2 |
| C | 3 | 203 | 1132 | 7.04 | 414 | 391 | 105.2 |
| C | 12 | 241 | 1102 | 6.76 | 414 | 391 | 105.2 |
| D | 4 | 246 | 1009 | 6.26 | 390 | 357 | 104.2 |
| D | 15 | 46 | 999 | 6.16 | 390 | 357 | 104.2 |
| D | 7 | 3 | 973 | 5.91 | 390 | 357 | 104.2 |
Histogram calculated using DETX and DETY for each event in the final _common_clean file
| Quadrant A | 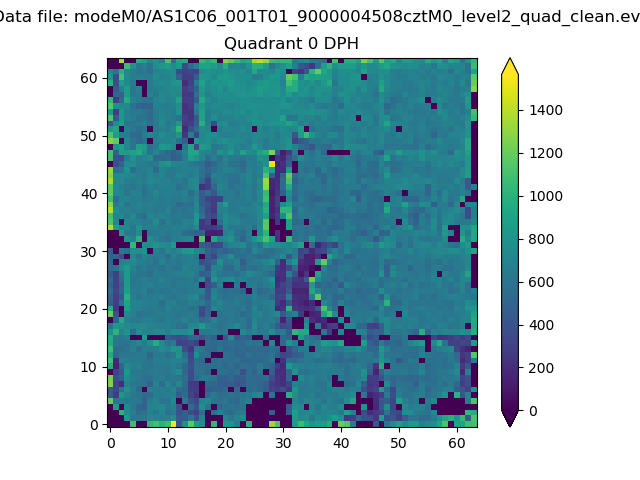 |
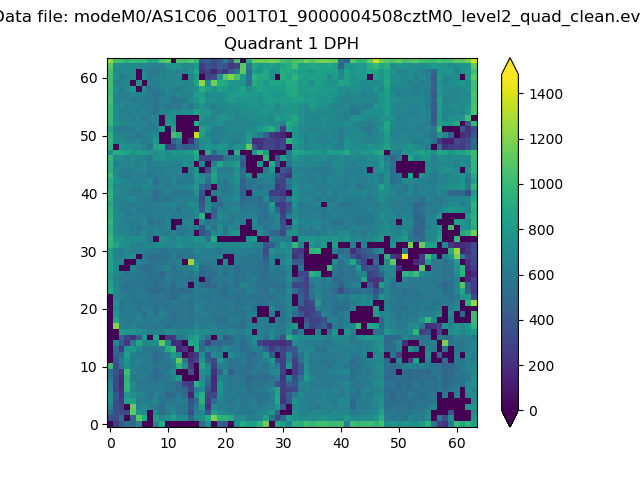 |
Quadrant B |
|---|---|---|---|
| Quadrant D |  |
 |
Quadrant C |
| Plot type | Count rate plots | Images |
|---|---|---|
| Comparison with Poisson distribution Blue bars denote a histogram of data divided into 1 sec bins. Red curve is a Poisson curve with rate = median count rate of data. |
 |
 |
| Quadrant-wise count rates Data is divided into 100 sec bins |
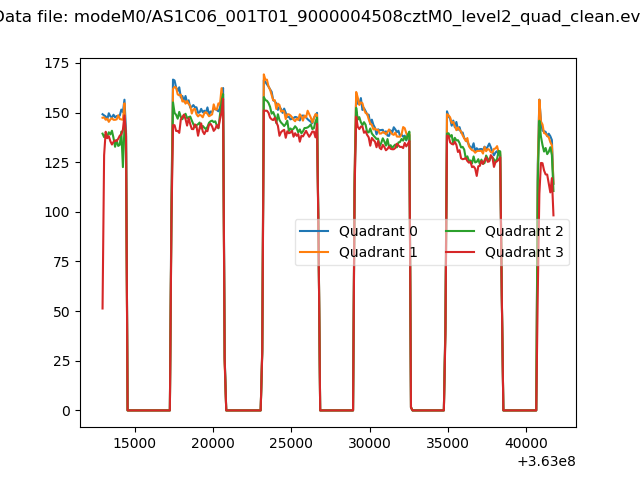 |
|
| Module-wise count rates for Quadrant A Data is divided into 100 sec bins |
 |
 |
| Module-wise count rates for Quadrant B Data is divided into 100 sec bins |
 |
 |
| Module-wise count rates for Quadrant C Data is divided into 100 sec bins |
 |
 |
| Module-wise count rates for Quadrant D Data is divided into 100 sec bins |
 |
 |
| Parameter | Plot |
|---|---|
| CZT HV Monitor |  |
| D_VDD |  |
| Temperature 1 |  |
| Veto HV Monitor |  |
| Veto LLD |  |
| Alpha Counter |  |
| _CPM_Rate |  |
| CZT Counter |  |
| +2.5 Volts monitor |  |
| +5 Volts monitor |  |
| _ROLL_ROT | 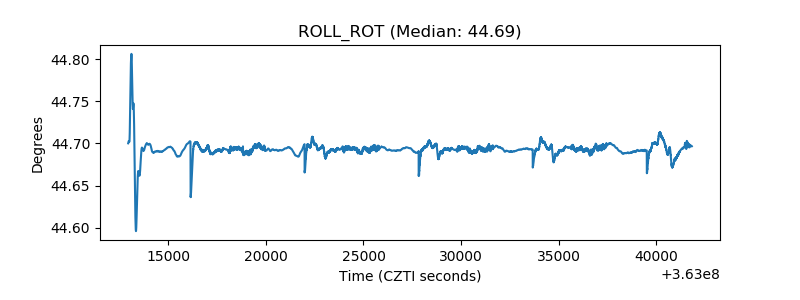 |
| _Roll_DEC |  |
| _Roll_RA |  |
| Veto Counter |  |