| Param | Original file | Final file |
|---|---|---|
| Filename | modeM0/AS1C06_001T01_9000004508_31164cztM0_level2.evt | modeM0/AS1C06_001T01_9000004508_31164cztM0_level2_quad_clean.evt |
| Size (bytes) | 297,924,480 | 36,573,120 |
| Size | 284.1 MB | 34.9 MB |
| Events in quadrant A | 1,656,073 | 238,516 |
| Events in quadrant B | 2,501,521 | 234,517 |
| Events in quadrant C | 1,764,362 | 219,315 |
| Events in quadrant D | 2,905,624 | 210,500 |
| Mode SS | |||
|---|---|---|---|
| Quadrant | BADHDUFLAG | Total packets | Discarded packets |
| A | 0 | 60 | 0 |
| B | 0 | 60 | 0 |
| C | 0 | 60 | 0 |
| D | 0 | 60 | 0 |
| Mode M9 | |||
|---|---|---|---|
| Quadrant | BADHDUFLAG | Total packets | Discarded packets |
| A | 0 | 13 | 0 |
| B | 0 | 13 | 0 |
| C | 0 | 13 | 0 |
| D | 0 | 13 | 0 |
| Mode M0 | |||
|---|---|---|---|
| Quadrant | BADHDUFLAG | Total packets | Discarded packets |
| A | 0 | 6889 | 1 |
| B | 0 | 9286 | 3 |
| C | 0 | 7239 | 1 |
| D | 0 | 10665 | 1 |
| Quadrant | Total seconds | Saturated seconds | Saturation percentage |
|---|---|---|---|
| A | 2858 | 59 | 2.064381% |
| B | 2857 | 119 | 4.165208% |
| C | 2857 | 188 | 6.580329% |
| D | 2857 | 268 | 9.380469% |
Noise dominated data is calculated using 1-second bins in cleaned event files. If a bin has >2000 counts, and if more than 50% of those come from <1% of pixels, then it is considered to be noise-dominated and hence unusable.
| Quadrant | # 1 sec bins | Bins with >0 counts | Bins with >2000 counts | High rate bins dominated by noise | Noise dominated (total time) | Noise dominated (detector-on time) | Marked lightcurve |
|---|---|---|---|---|---|---|---|
| A | 4168 | 2859 | 0 | 0 | 0.00% | 0.00% |  |
| B | 4167 | 2858 | 1 | 1 | 0.02% | 0.03% |  |
| C | 4167 | 2858 | 1 | 1 | 0.02% | 0.03% |  |
| D | 4167 | 2858 | 183 | 183 | 4.39% | 6.40% |  |
Top three noisy pixels from each quadrant. If the there are fewer than three noisy pixels in the level2.evt file, extra rows are filled as -1
| Pixel properties | Quadrant properties | ||||||
|---|---|---|---|---|---|---|---|
| Quadrant | DetID | PixID | Counts | Sigma | Mean | Median | Sigma |
| A | 11 | 47 | 11392 | 128.84 | 426 | 419 | 85.2 |
| A | 13 | 254 | 5188 | 56.0 | 426 | 419 | 85.2 |
| A | 3 | 137 | 3859 | 40.39 | 426 | 419 | 85.2 |
| B | 6 | 159 | 770645 | 9546.82 | 416 | 407 | 80.7 |
| B | 15 | 33 | 82517 | 1017.72 | 416 | 407 | 80.7 |
| B | 0 | 190 | 16751 | 202.57 | 416 | 407 | 80.7 |
| C | 14 | 238 | 107151 | 1134.87 | 398 | 401 | 94.1 |
| C | 14 | 254 | 59941 | 632.98 | 398 | 401 | 94.1 |
| C | 0 | 10 | 23302 | 243.46 | 398 | 401 | 94.1 |
| D | 8 | 195 | 875262 | 9377.54 | 396 | 387 | 93.3 |
| D | 13 | 174 | 304564 | 3260.38 | 396 | 387 | 93.3 |
| D | 12 | 218 | 173312 | 1853.53 | 396 | 387 | 93.3 |
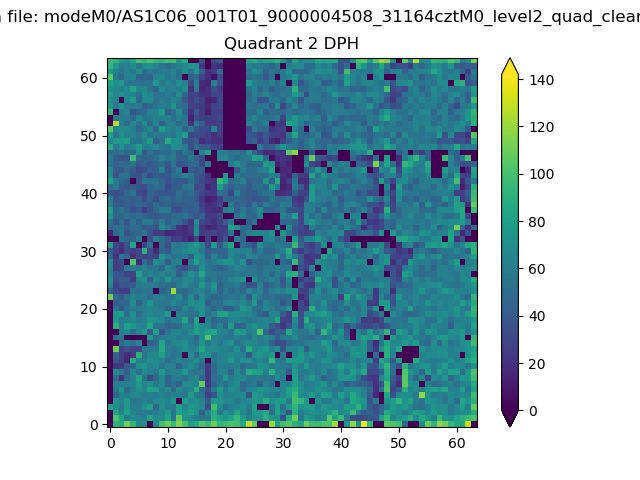
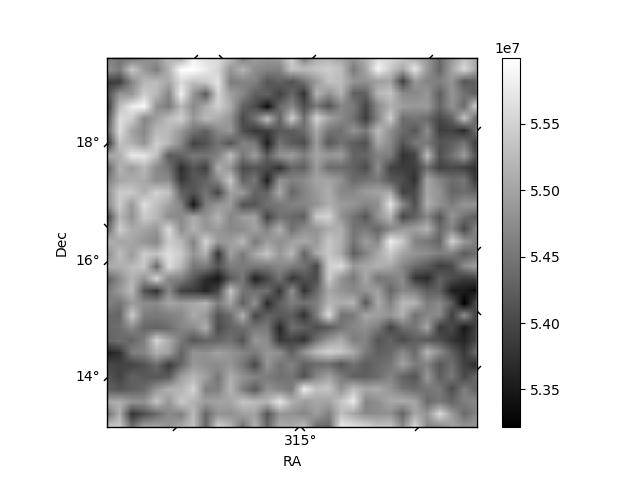
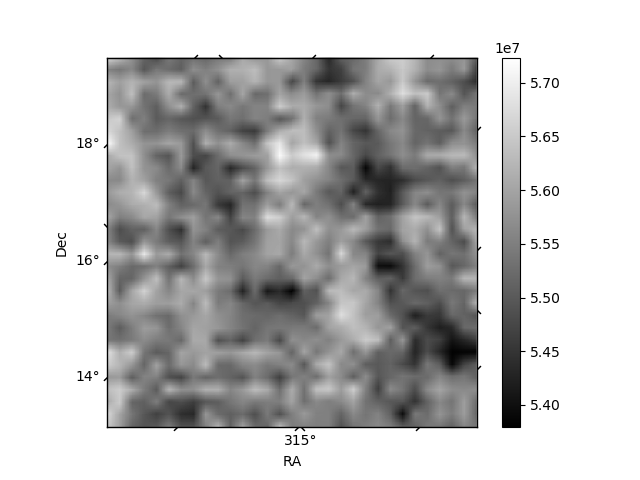
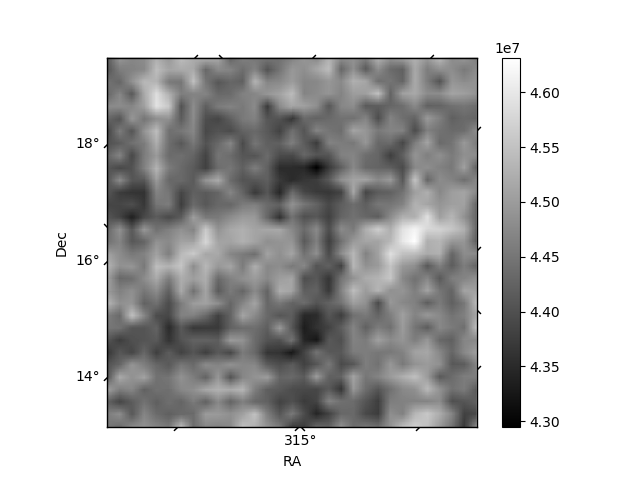
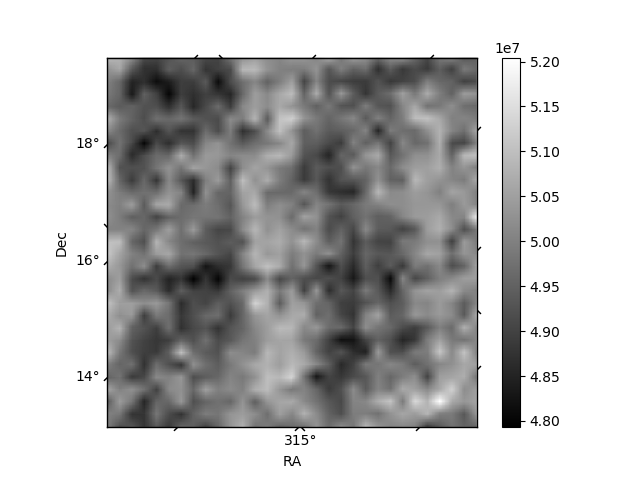
Histogram calculated using DETX and DETY for each event in the final _common_clean file
| Quadrant A | 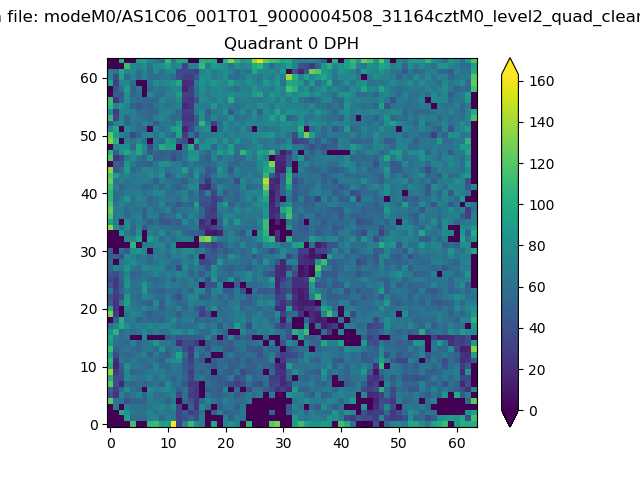 |
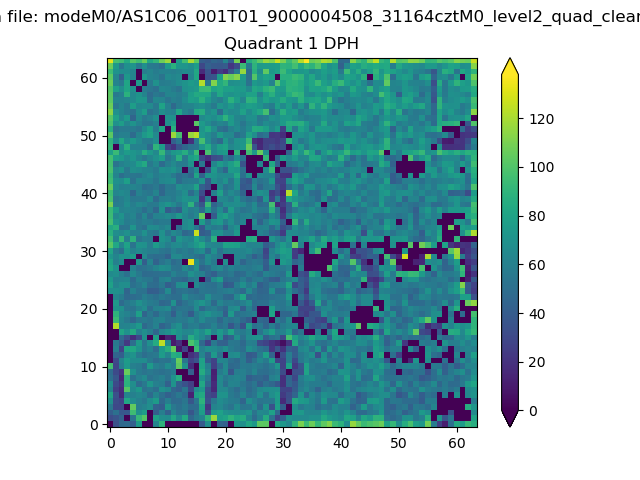 |
Quadrant B |
|---|---|---|---|
| Quadrant D | 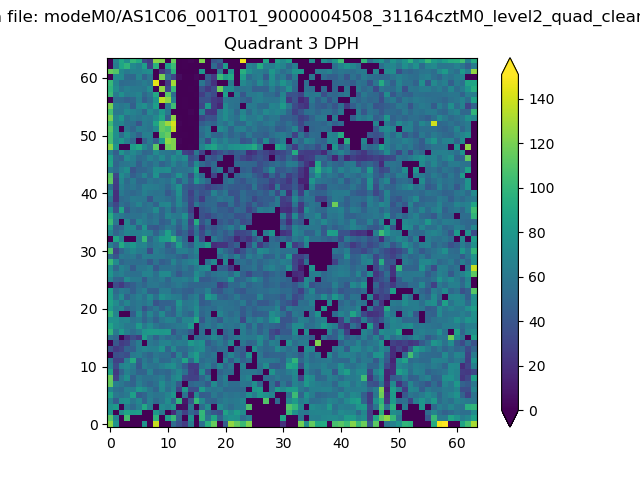 |
 |
Quadrant C |
| Plot type | Count rate plots | Images |
|---|---|---|
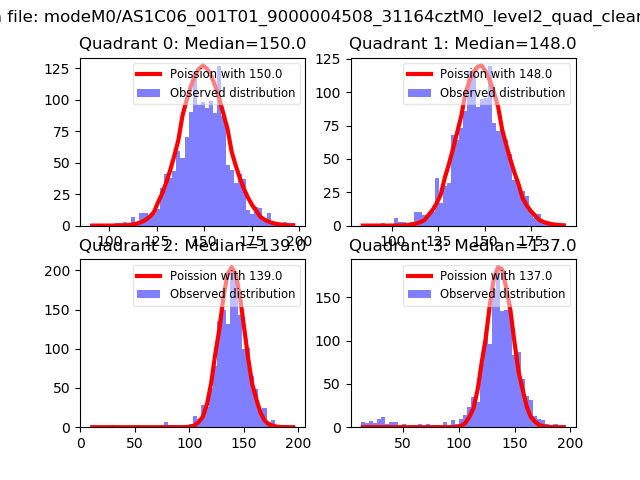
| Comparison with Poisson distribution Blue bars denote a histogram of data divided into 1 sec bins. Red curve is a Poisson curve with rate = median count rate of data. |
 |
 |
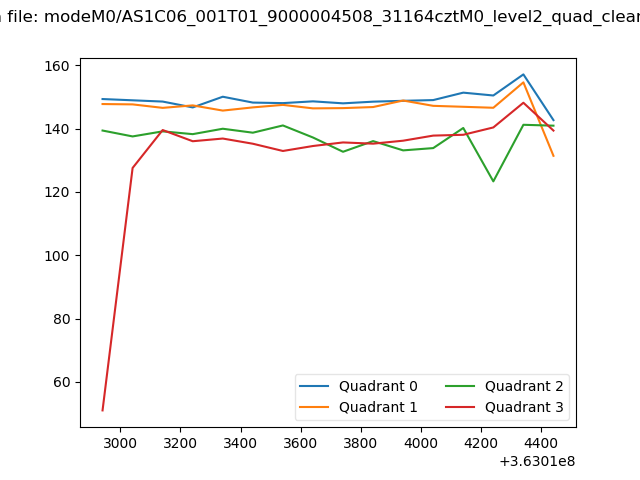
| Quadrant-wise count rates Data is divided into 100 sec bins |
 |
|
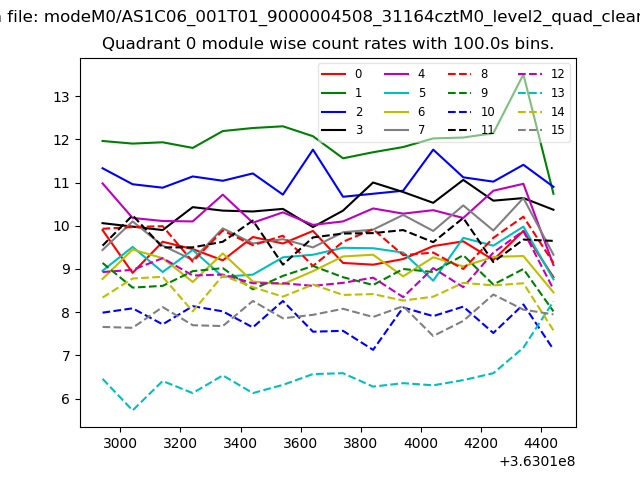
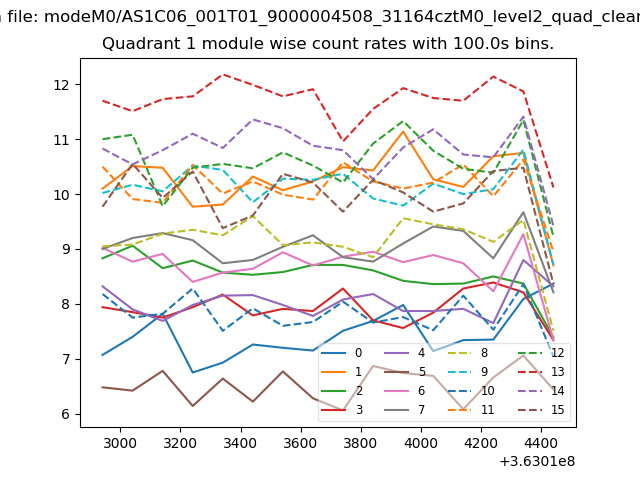
| Module-wise count rates for Quadrant A Data is divided into 100 sec bins |
 |
 |
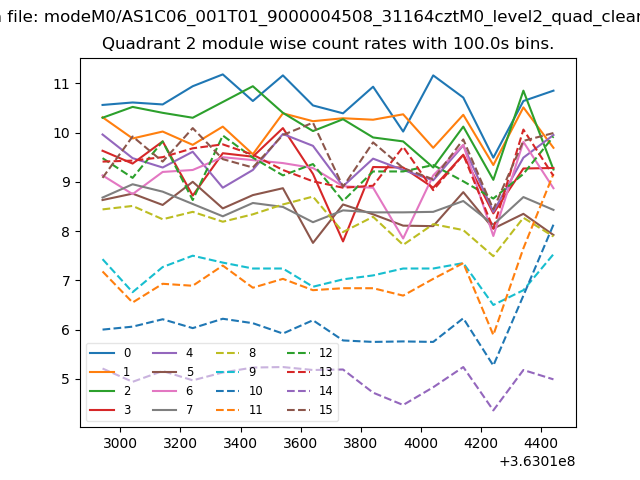
| Module-wise count rates for Quadrant B Data is divided into 100 sec bins |
 |
 |
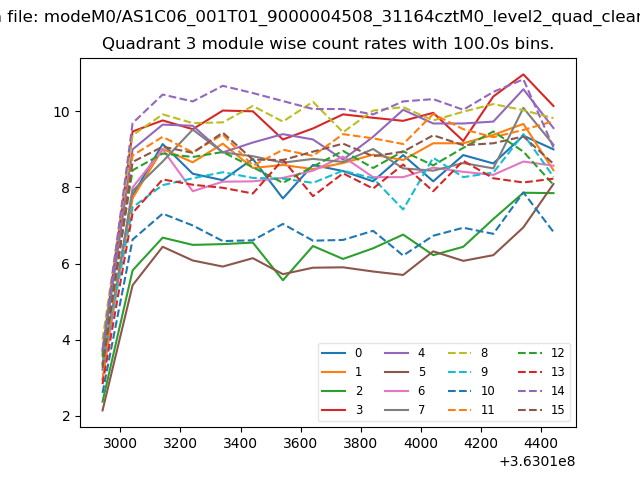
| Module-wise count rates for Quadrant C Data is divided into 100 sec bins |
 |
 |
| Module-wise count rates for Quadrant D Data is divided into 100 sec bins |
 |
 |
| Parameter | Plot |
|---|---|
| CZT HV Monitor | 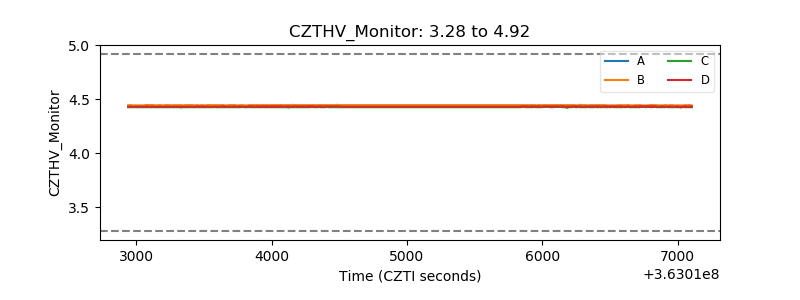 |
| D_VDD | 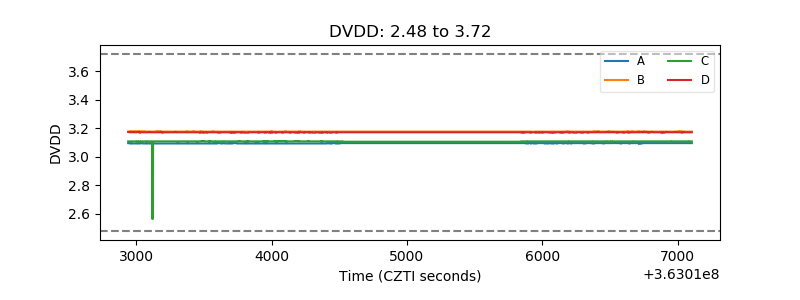 |
| Temperature 1 | 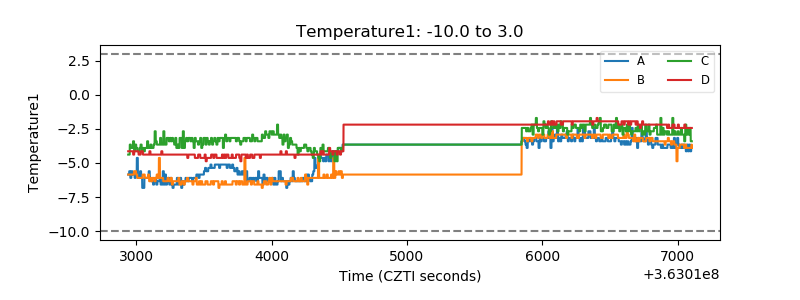 |
| Veto HV Monitor | 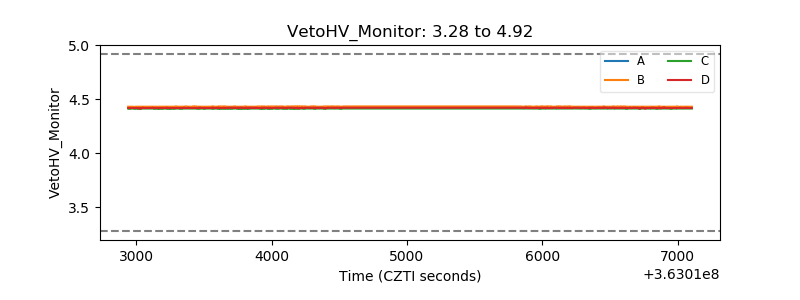 |
| Veto LLD | 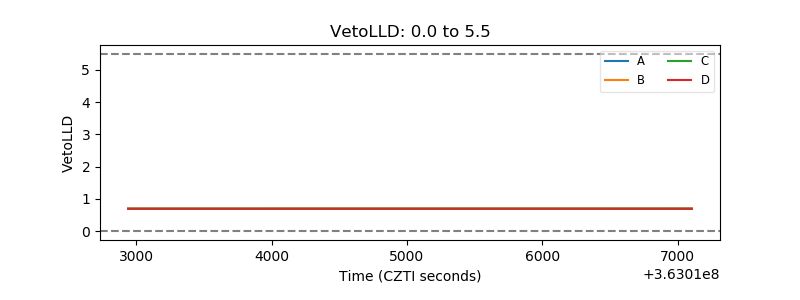 |
| Alpha Counter |  |
| _CPM_Rate |  |
| CZT Counter | 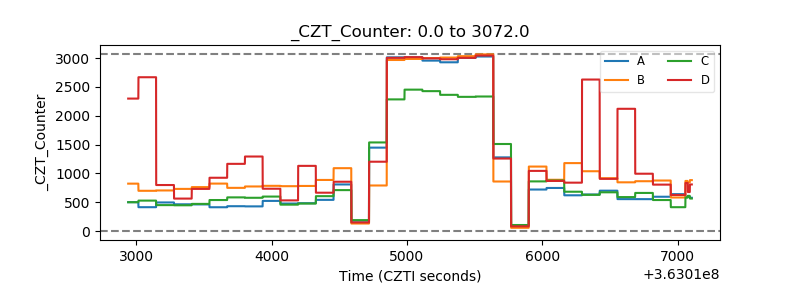 |
| +2.5 Volts monitor |  |
| +5 Volts monitor |  |
| _ROLL_ROT | 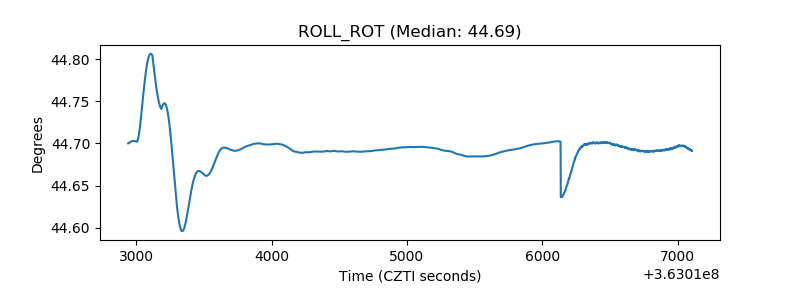 |
| _Roll_DEC | 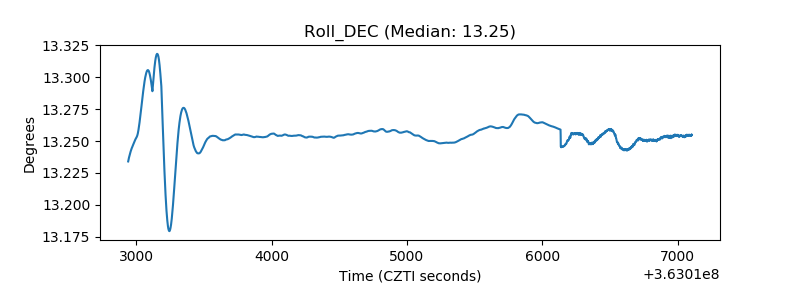 |
| _Roll_RA |  |
| Veto Counter | 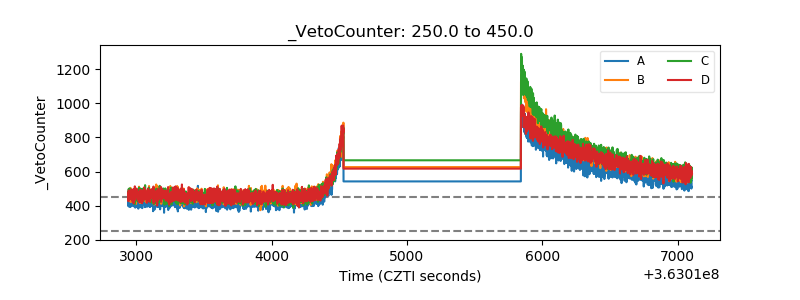 |