| Param | Original file | Final file |
|---|---|---|
| Filename | modeM0/AS1C06_001T01_9000004508_31167cztM0_level2.evt | modeM0/AS1C06_001T01_9000004508_31167cztM0_level2_quad_clean.evt |
| Size (bytes) | 571,521,600 | 99,725,760 |
| Size | 545.0 MB | 95.1 MB |
| Events in quadrant A | 3,361,622 | 658,327 |
| Events in quadrant B | 5,253,762 | 657,156 |
| Events in quadrant C | 3,556,988 | 631,242 |
| Events in quadrant D | 4,694,532 | 618,451 |
| Mode SS | |||
|---|---|---|---|
| Quadrant | BADHDUFLAG | Total packets | Discarded packets |
| A | 0 | 132 | 0 |
| B | 0 | 132 | 0 |
| C | 0 | 132 | 0 |
| D | 0 | 132 | 0 |
| Mode M9 | |||
|---|---|---|---|
| Quadrant | BADHDUFLAG | Total packets | Discarded packets |
| A | 0 | 12 | 0 |
| B | 0 | 13 | 0 |
| C | 0 | 13 | 0 |
| D | 0 | 13 | 0 |
| Mode M0 | |||
|---|---|---|---|
| Quadrant | BADHDUFLAG | Total packets | Discarded packets |
| A | 0 | 13978 | 2 |
| B | 0 | 19852 | 2 |
| C | 0 | 14455 | 2 |
| D | 0 | 18597 | 2 |
| Quadrant | Total seconds | Saturated seconds | Saturation percentage |
|---|---|---|---|
| A | 6527 | 74 | 1.133752% |
| B | 6527 | 157 | 2.405393% |
| C | 6527 | 220 | 3.370614% |
| D | 6527 | 115 | 1.761912% |
Noise dominated data is calculated using 1-second bins in cleaned event files. If a bin has >2000 counts, and if more than 50% of those come from <1% of pixels, then it is considered to be noise-dominated and hence unusable.
| Quadrant | # 1 sec bins | Bins with >0 counts | Bins with >2000 counts | High rate bins dominated by noise | Noise dominated (total time) | Noise dominated (detector-on time) | Marked lightcurve |
|---|---|---|---|---|---|---|---|
| A | 7567 | 6528 | 1 | 1 | 0.01% | 0.02% | 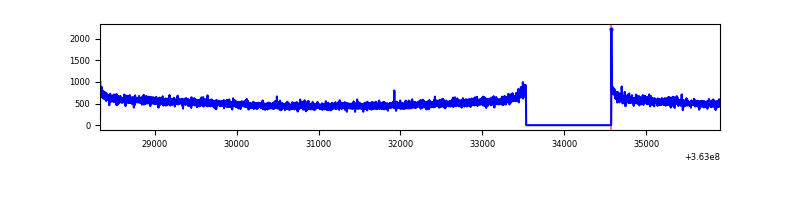 |
| B | 7567 | 6528 | 0 | 0 | 0.00% | 0.00% | 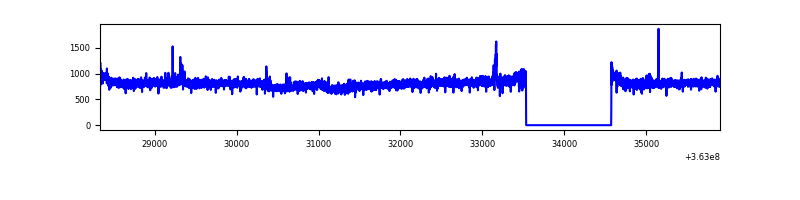 |
| C | 7567 | 6528 | 14 | 14 | 0.19% | 0.21% | 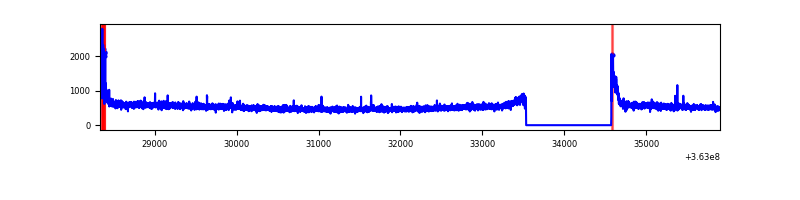 |
| D | 7567 | 6528 | 19 | 19 | 0.25% | 0.29% | 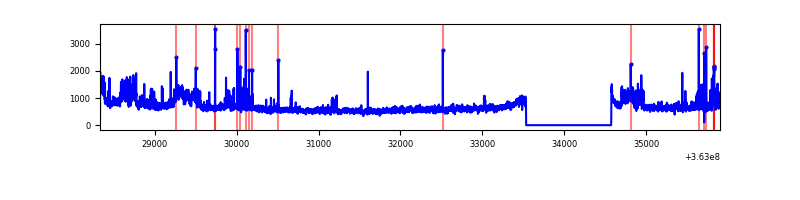 |
Top three noisy pixels from each quadrant. If the there are fewer than three noisy pixels in the level2.evt file, extra rows are filled as -1
| Pixel properties | Quadrant properties | ||||||
|---|---|---|---|---|---|---|---|
| Quadrant | DetID | PixID | Counts | Sigma | Mean | Median | Sigma |
| A | 8 | 255 | 14608 | 80.57 | 863 | 848 | 170.8 |
| A | 13 | 254 | 11230 | 60.79 | 863 | 848 | 170.8 |
| A | 11 | 47 | 11016 | 59.54 | 863 | 848 | 170.8 |
| B | 6 | 159 | 1858017 | 11361.35 | 854 | 833 | 163.5 |
| B | 0 | 190 | 35542 | 212.33 | 854 | 833 | 163.5 |
| B | 12 | 111 | 19790 | 115.97 | 854 | 833 | 163.5 |
| C | 14 | 238 | 137713 | 704.66 | 831 | 839 | 194.2 |
| C | 0 | 10 | 130825 | 669.2 | 831 | 839 | 194.2 |
| C | 3 | 233 | 23027 | 114.23 | 831 | 839 | 194.2 |
| D | 8 | 195 | 1331133 | 5989.16 | 834 | 823 | 222.1 |
| D | 2 | 250 | 69539 | 309.36 | 834 | 823 | 222.1 |
| D | 12 | 79 | 67555 | 300.43 | 834 | 823 | 222.1 |
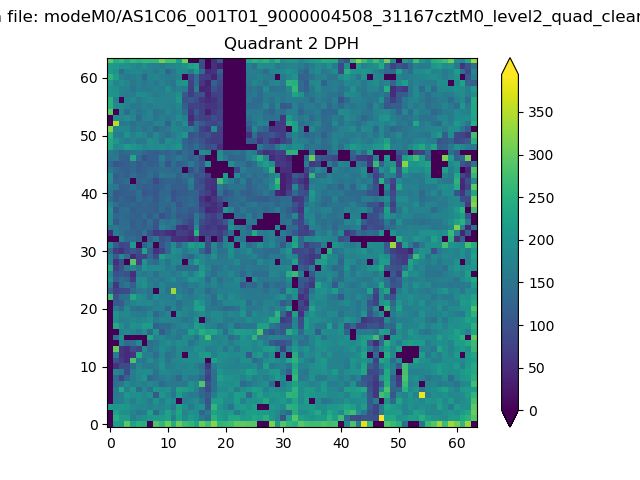
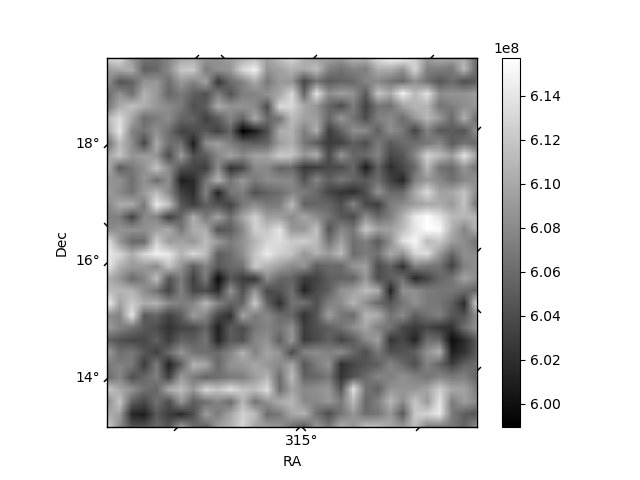
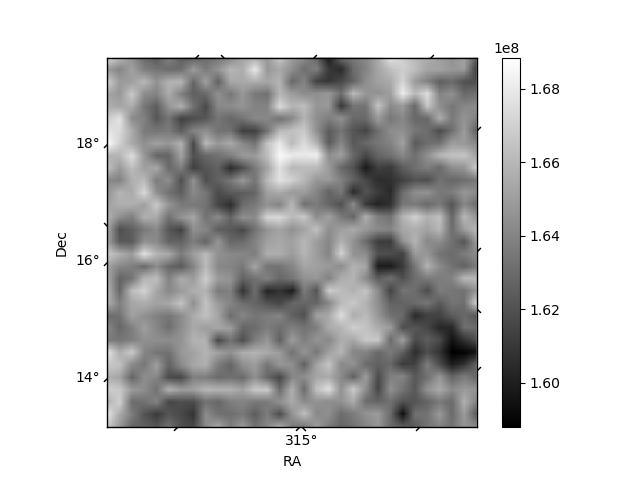
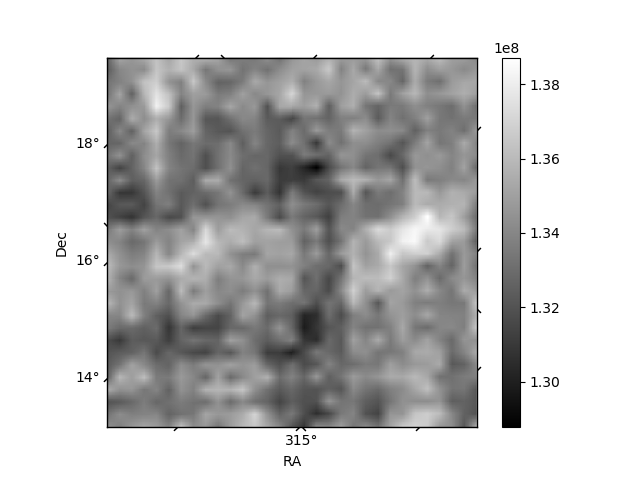
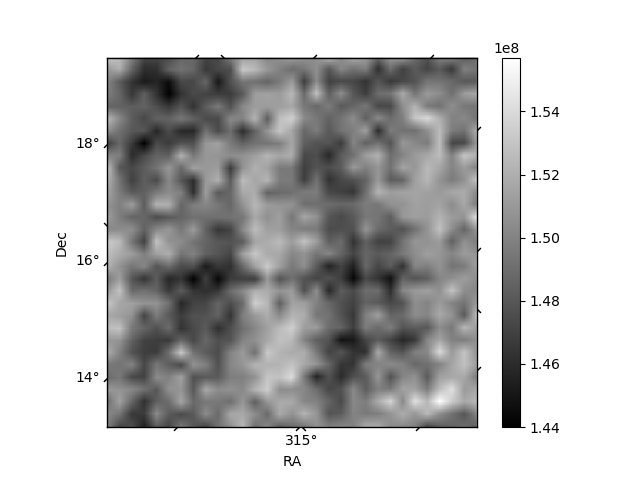
Histogram calculated using DETX and DETY for each event in the final _common_clean file
| Quadrant A | 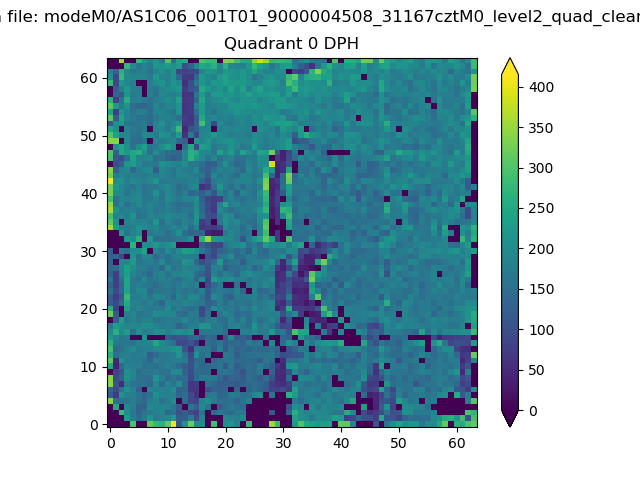 |
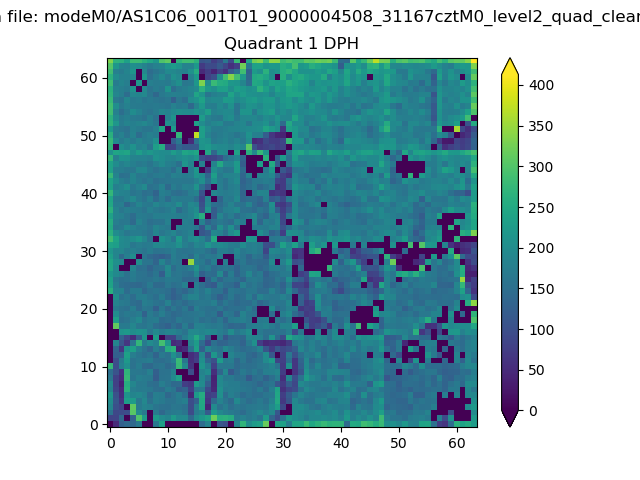 |
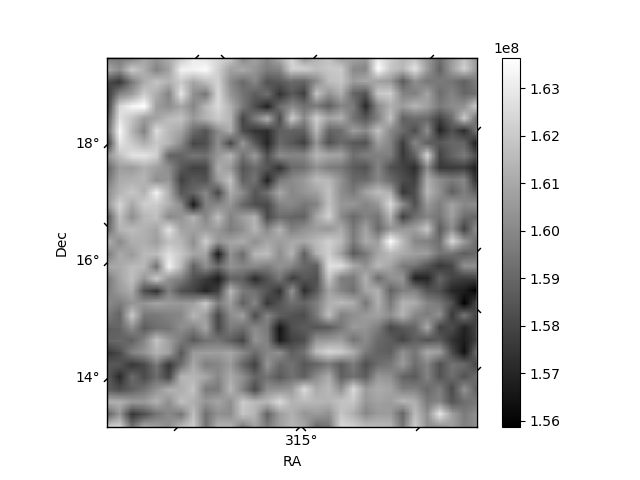
Quadrant B |
|---|---|---|---|
| Quadrant D | 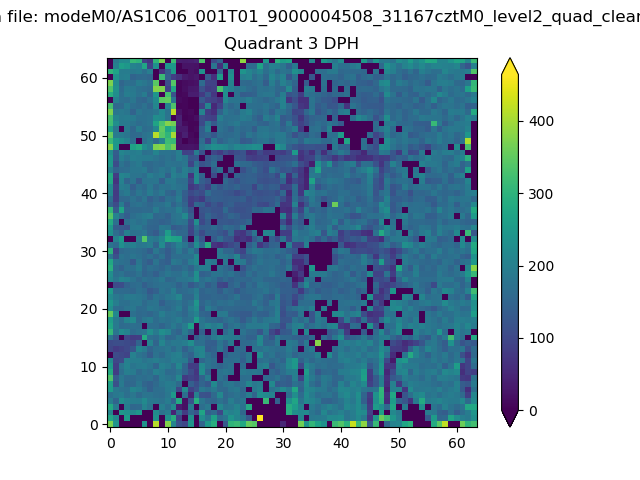 |
 |
Quadrant C |
| Plot type | Count rate plots | Images |
|---|---|---|
| Comparison with Poisson distribution Blue bars denote a histogram of data divided into 1 sec bins. Red curve is a Poisson curve with rate = median count rate of data. |
 |
 |
| Quadrant-wise count rates Data is divided into 100 sec bins |
 |
|
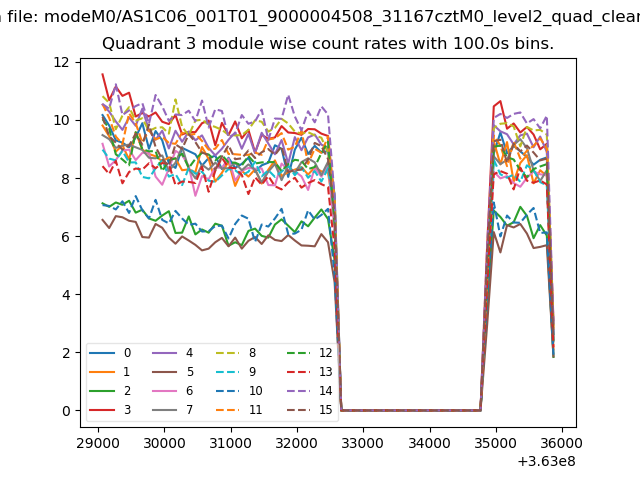
| Module-wise count rates for Quadrant A Data is divided into 100 sec bins |
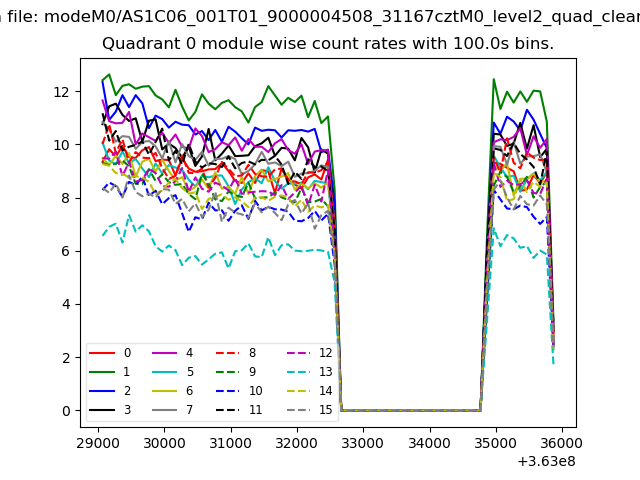 |
 |
| Module-wise count rates for Quadrant B Data is divided into 100 sec bins |
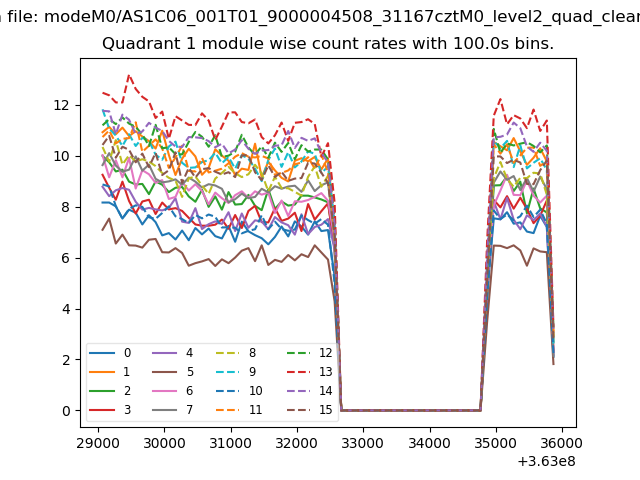 |
 |
| Module-wise count rates for Quadrant C Data is divided into 100 sec bins |
 |
 |
| Module-wise count rates for Quadrant D Data is divided into 100 sec bins |
 |
 |
| Parameter | Plot |
|---|---|
| CZT HV Monitor | 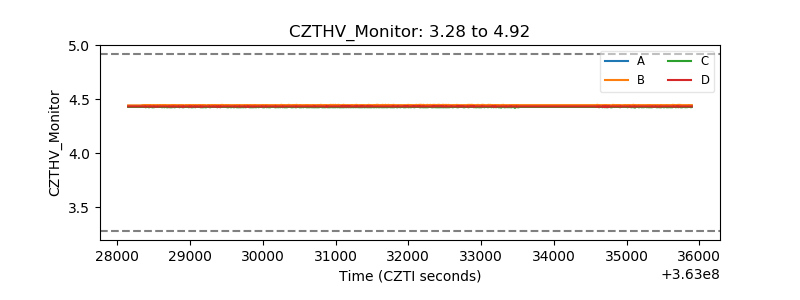 |
| D_VDD | 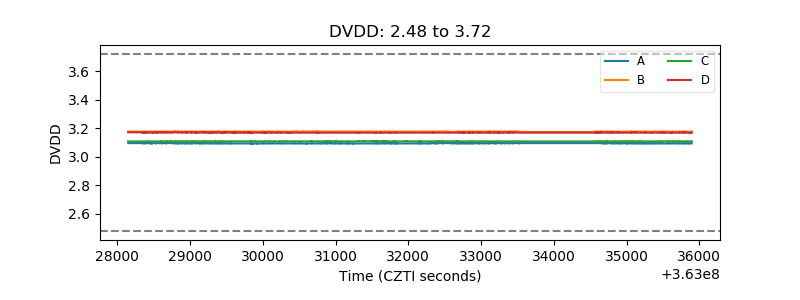 |
| Temperature 1 | 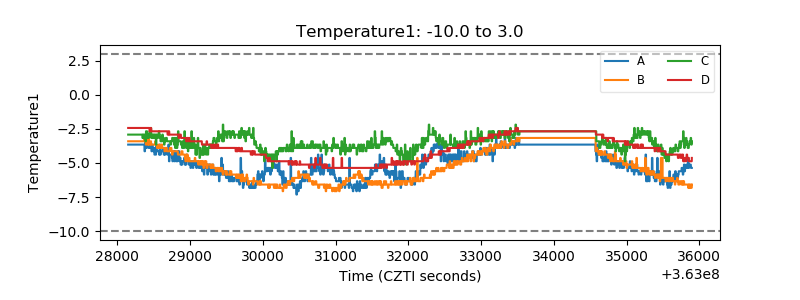 |
| Veto HV Monitor | 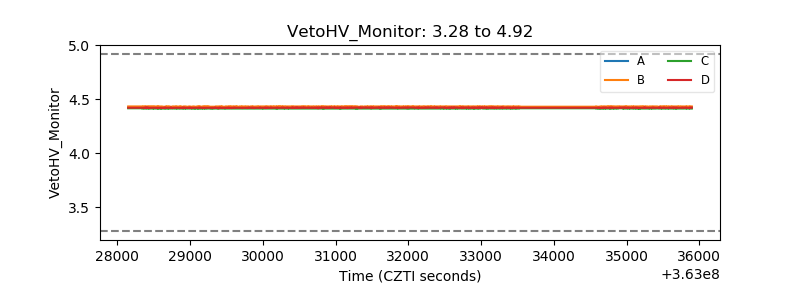 |
| Veto LLD | 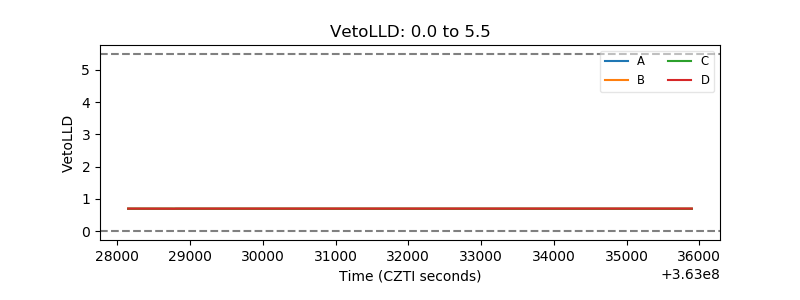 |
| Alpha Counter |  |
| _CPM_Rate | 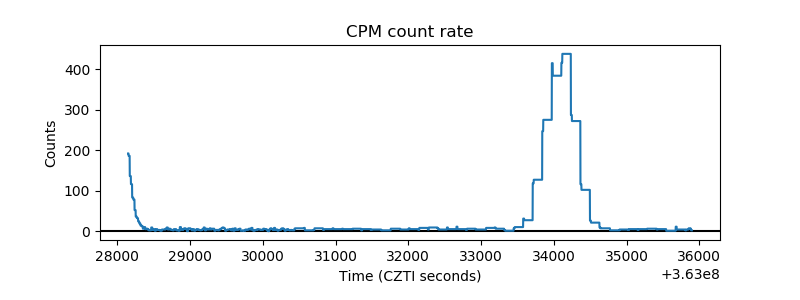 |
| CZT Counter |  |
| +2.5 Volts monitor |  |
| +5 Volts monitor |  |
| _ROLL_ROT | 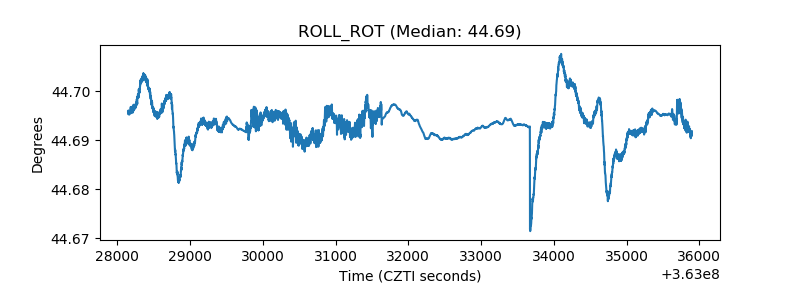 |
| _Roll_DEC | 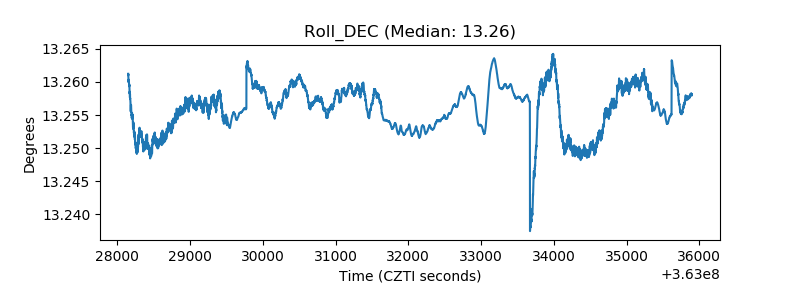 |
| _Roll_RA | 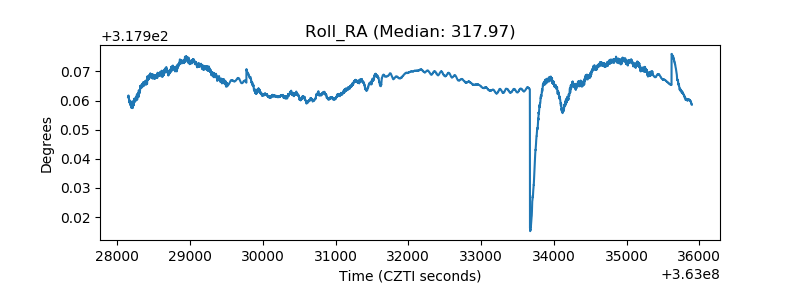 |
| Veto Counter | 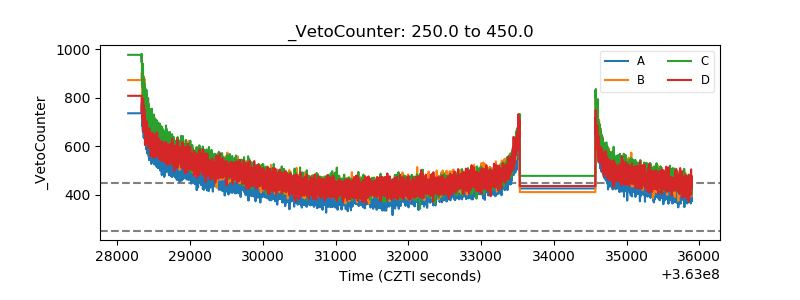 |