| Param | Original file | Final file |
|---|---|---|
| Filename | modeM0/AS1C06_006T03_9000004502cztM0_level2.fits | modeM0/AS1C06_006T03_9000004502cztM0_level2_quad_clean.evt |
| Size (bytes) | 116,576,640 | 100,068,480 |
| Size | 111.2 MB | 95.4 MB |
| Events in quadrant A | 720,992 | 597,949 |
| Events in quadrant B | 669,294 | 581,491 |
| Events in quadrant C | 689,748 | 532,632 |
| Events in quadrant D | 583,266 | 450,864 |
| Mode M0 | |||
|---|---|---|---|
| Quadrant | BADHDUFLAG | Total packets | Discarded packets |
| A | 0 | 25496 | 0 |
| B | 0 | 39166 | 0 |
| C | 0 | 27633 | 0 |
| D | 0 | 50573 | 0 |
| Mode M9 | |||
|---|---|---|---|
| Quadrant | BADHDUFLAG | Total packets | Discarded packets |
| A | 0 | 7 | 0 |
| B | 0 | 7 | 0 |
| C | 0 | 7 | 0 |
| D | 0 | 7 | 0 |
| Mode SS | |||
|---|---|---|---|
| Quadrant | BADHDUFLAG | Total packets | Discarded packets |
| A | 0 | 258 | 0 |
| B | 0 | 258 | 0 |
| C | 0 | 258 | 0 |
| D | 0 | 258 | 0 |
| Quadrant | Total seconds | Saturated seconds | Saturation percentage |
|---|---|---|---|
| A | 12523 | 96 | 0.766589% |
| B | 12523 | 308 | 2.459475% |
| C | 12523 | 705 | 5.629641% |
| D | 12523 | 1366 | 10.907929% |
Noise dominated data is calculated using 1-second bins in cleaned event files. If a bin has >2000 counts, and if more than 50% of those come from <1% of pixels, then it is considered to be noise-dominated and hence unusable.
| Quadrant | # 1 sec bins | Bins with >0 counts | Bins with >2000 counts | High rate bins dominated by noise | Noise dominated (total time) | Noise dominated (detector-on time) | Marked lightcurve |
|---|---|---|---|---|---|---|---|
| A | 13404 | 12524 | 0 | 0 | 0.00% | 0.00% |  |
| B | 13404 | 12524 | 0 | 0 | 0.00% | 0.00% |  |
| C | 13404 | 12503 | 0 | 0 | 0.00% | 0.00% | 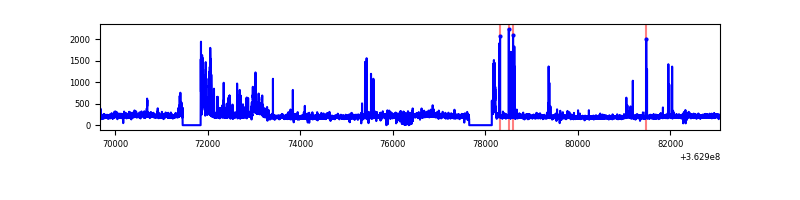 |
| D | 13404 | 12518 | 0 | 0 | 0.00% | 0.00% |  |
Top three noisy pixels from each quadrant. If the there are fewer than three noisy pixels in the level2.evt file, extra rows are filled as -1
| Pixel properties | Quadrant properties | ||||||
|---|---|---|---|---|---|---|---|
| Quadrant | DetID | PixID | Counts | Sigma | Mean | Median | Sigma |
| A | 0 | 29 | 720 | 11.29 | 187 | 175 | 48.3 |
| A | 7 | 110 | 566 | 8.1 | 187 | 175 | 48.3 |
| A | 0 | 30 | 537 | 7.5 | 187 | 175 | 48.3 |
| B | 2 | 9 | 526 | 9.6 | 177 | 168 | 37.3 |
| B | 5 | 232 | 484 | 8.47 | 177 | 168 | 37.3 |
| B | 14 | 254 | 458 | 7.78 | 177 | 168 | 37.3 |
| C | 12 | 241 | 479 | 6.52 | 182 | 170 | 47.4 |
| C | 2 | 191 | 475 | 6.43 | 182 | 170 | 47.4 |
| C | 3 | 126 | 472 | 6.37 | 182 | 170 | 47.4 |
| D | 15 | 46 | 470 | 6.95 | 166 | 151 | 45.9 |
| D | 3 | 14 | 449 | 6.5 | 166 | 151 | 45.9 |
| D | 4 | 160 | 416 | 5.78 | 166 | 151 | 45.9 |
Histogram calculated using DETX and DETY for each event in the final _common_clean file
| Quadrant A |  |
 |
Quadrant B |
|---|---|---|---|
| Quadrant D |  |
 |
Quadrant C |
| Plot type | Count rate plots | Images |
|---|---|---|
| Comparison with Poisson distribution Blue bars denote a histogram of data divided into 1 sec bins. Red curve is a Poisson curve with rate = median count rate of data. |
 |
 |
| Quadrant-wise count rates Data is divided into 100 sec bins |
 |
|
| Module-wise count rates for Quadrant A Data is divided into 100 sec bins |
 |
 |
| Module-wise count rates for Quadrant B Data is divided into 100 sec bins |
 |
 |
| Module-wise count rates for Quadrant C Data is divided into 100 sec bins |
 |
 |
| Module-wise count rates for Quadrant D Data is divided into 100 sec bins |
 |
 |
| Parameter | Plot |
|---|---|
| CZT HV Monitor |  |
| D_VDD |  |
| Temperature 1 |  |
| Veto HV Monitor |  |
| Veto LLD | 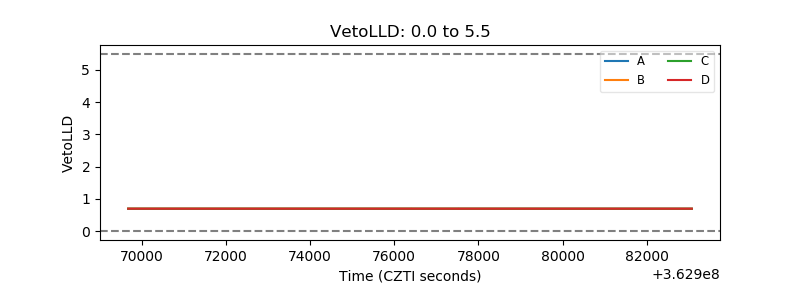 |
| Alpha Counter |  |
| _CPM_Rate |  |
| CZT Counter |  |
| +2.5 Volts monitor |  |
| +5 Volts monitor |  |
| _ROLL_ROT |  |
| _Roll_DEC |  |
| _Roll_RA |  |
| Veto Counter |  |