| Param | Original file | Final file |
|---|---|---|
| Filename | modeM0/AS1C06_006T03_9000004502_31156cztM0_level2.evt | modeM0/AS1C06_006T03_9000004502_31156cztM0_level2_quad_clean.evt |
| Size (bytes) | 336,018,240 | 48,870,720 |
| Size | 320.5 MB | 46.6 MB |
| Events in quadrant A | 1,632,712 | 322,321 |
| Events in quadrant B | 2,735,742 | 317,342 |
| Events in quadrant C | 1,977,786 | 310,900 |
| Events in quadrant D | 3,600,771 | 289,856 |
| Mode M0 | |||
|---|---|---|---|
| Quadrant | BADHDUFLAG | Total packets | Discarded packets |
| A | 0 | 6958 | 1 |
| B | 0 | 10468 | 2 |
| C | 0 | 7878 | 1 |
| D | 0 | 13119 | 1 |
| Mode M9 | |||
|---|---|---|---|
| Quadrant | BADHDUFLAG | Total packets | Discarded packets |
| A | 0 | 3 | 0 |
| B | 0 | 3 | 0 |
| C | 0 | 3 | 0 |
| D | 0 | 3 | 0 |
| Mode SS | |||
|---|---|---|---|
| Quadrant | BADHDUFLAG | Total packets | Discarded packets |
| A | 0 | 70 | 0 |
| B | 0 | 70 | 0 |
| C | 0 | 70 | 0 |
| D | 0 | 70 | 0 |
| Quadrant | Total seconds | Saturated seconds | Saturation percentage |
|---|---|---|---|
| A | 3368 | 18 | 0.534442% |
| B | 3367 | 97 | 2.880903% |
| C | 3367 | 129 | 3.831304% |
| D | 3367 | 337 | 10.008910% |
Noise dominated data is calculated using 1-second bins in cleaned event files. If a bin has >2000 counts, and if more than 50% of those come from <1% of pixels, then it is considered to be noise-dominated and hence unusable.
| Quadrant | # 1 sec bins | Bins with >0 counts | Bins with >2000 counts | High rate bins dominated by noise | Noise dominated (total time) | Noise dominated (detector-on time) | Marked lightcurve |
|---|---|---|---|---|---|---|---|
| A | 3758 | 3368 | 0 | 0 | 0.00% | 0.00% | 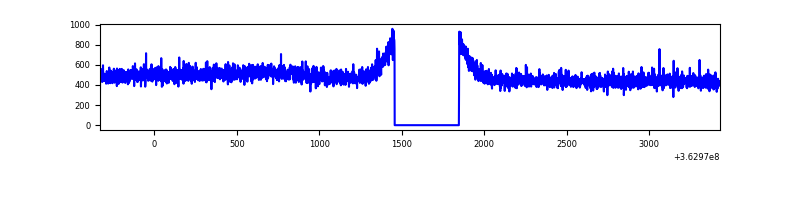 |
| B | 3757 | 3367 | 5 | 5 | 0.13% | 0.15% | 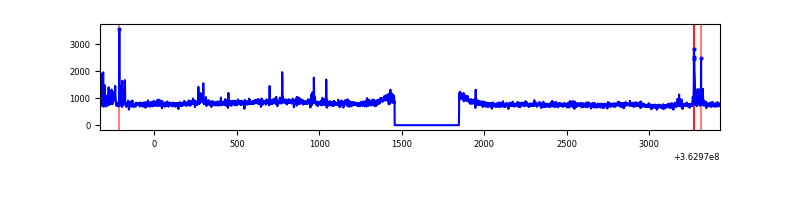 |
| C | 3757 | 3367 | 13 | 13 | 0.35% | 0.39% | 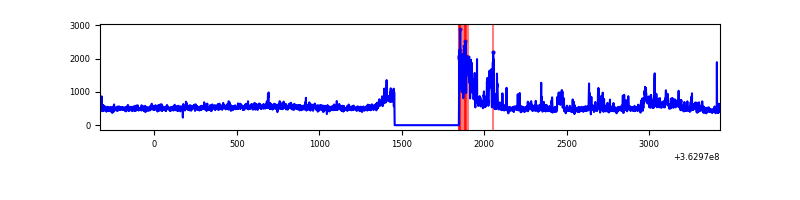 |
| D | 3757 | 3367 | 205 | 205 | 5.46% | 6.09% | 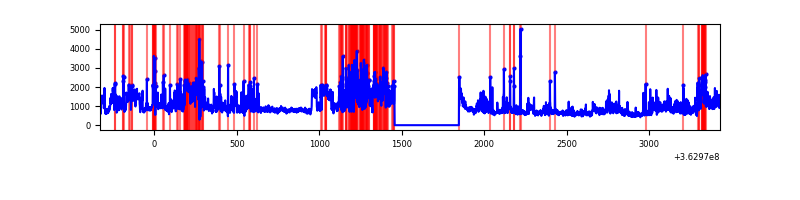 |
Top three noisy pixels from each quadrant. If the there are fewer than three noisy pixels in the level2.evt file, extra rows are filled as -1
| Pixel properties | Quadrant properties | ||||||
|---|---|---|---|---|---|---|---|
| Quadrant | DetID | PixID | Counts | Sigma | Mean | Median | Sigma |
| A | 13 | 254 | 6803 | 73.4 | 422 | 412 | 87.1 |
| A | 3 | 137 | 4172 | 43.18 | 422 | 412 | 87.1 |
| A | 0 | 226 | 3551 | 36.05 | 422 | 412 | 87.1 |
| B | 6 | 159 | 995007 | 12016.27 | 417 | 406 | 82.8 |
| B | 0 | 190 | 42676 | 510.68 | 417 | 406 | 82.8 |
| B | 0 | 229 | 24361 | 289.41 | 417 | 406 | 82.8 |
| C | 0 | 10 | 256428 | 2606.36 | 410 | 411 | 98.2 |
| C | 14 | 238 | 66118 | 668.93 | 410 | 411 | 98.2 |
| C | 3 | 233 | 37113 | 373.64 | 410 | 411 | 98.2 |
| D | 8 | 195 | 1093390 | 10251.53 | 395 | 386 | 106.6 |
| D | 13 | 174 | 792756 | 7431.82 | 395 | 386 | 106.6 |
| D | 2 | 250 | 66408 | 619.24 | 395 | 386 | 106.6 |
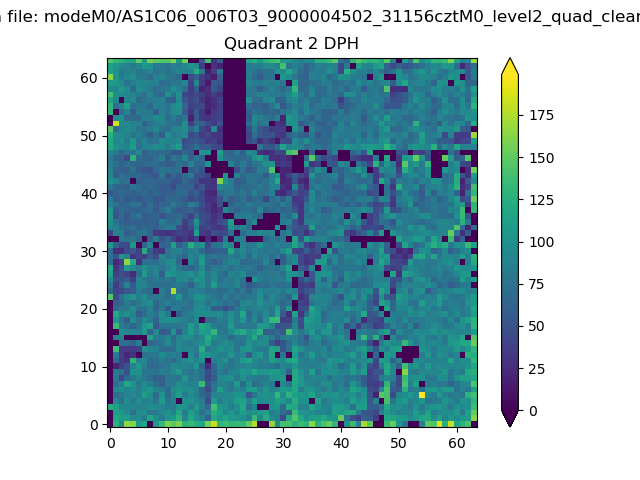
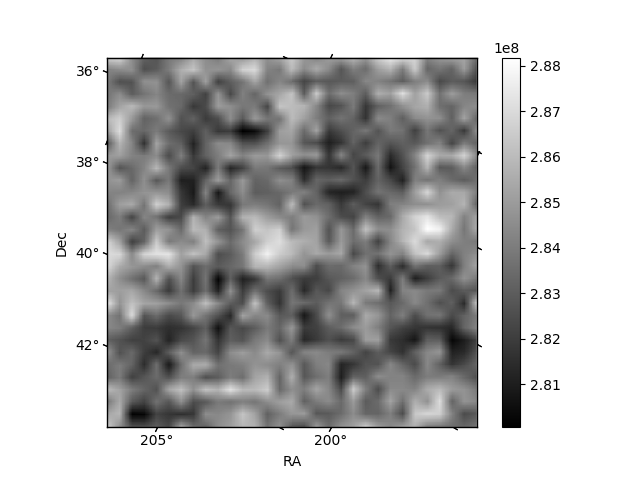
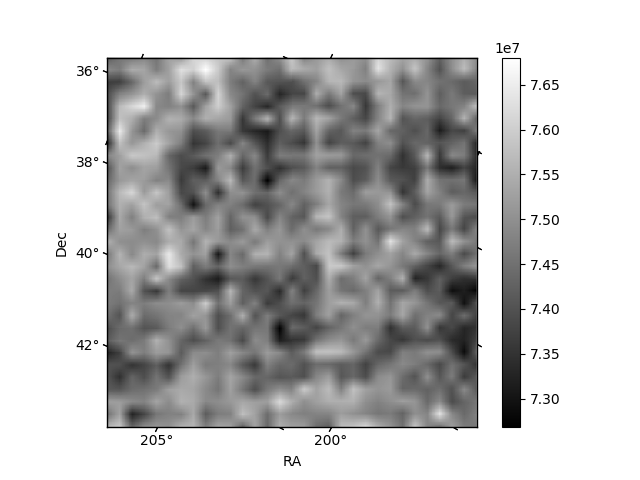
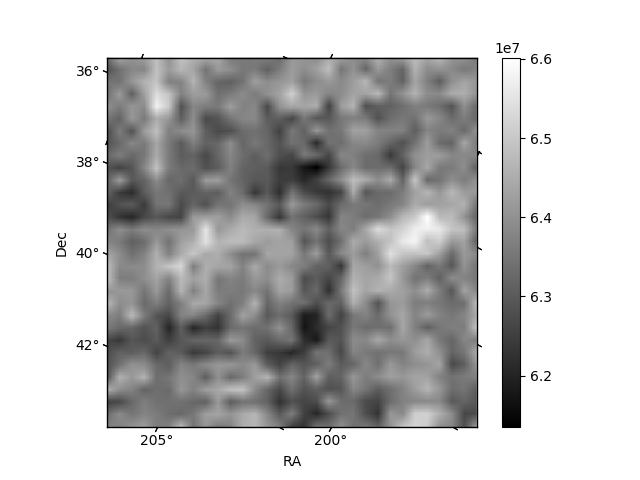
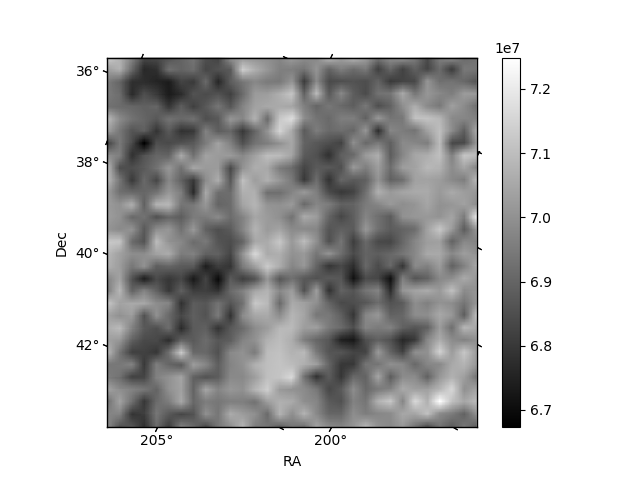
Histogram calculated using DETX and DETY for each event in the final _common_clean file
| Quadrant A | 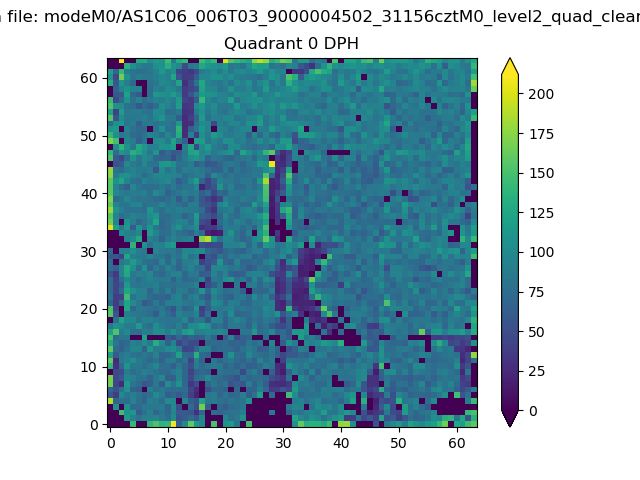 |
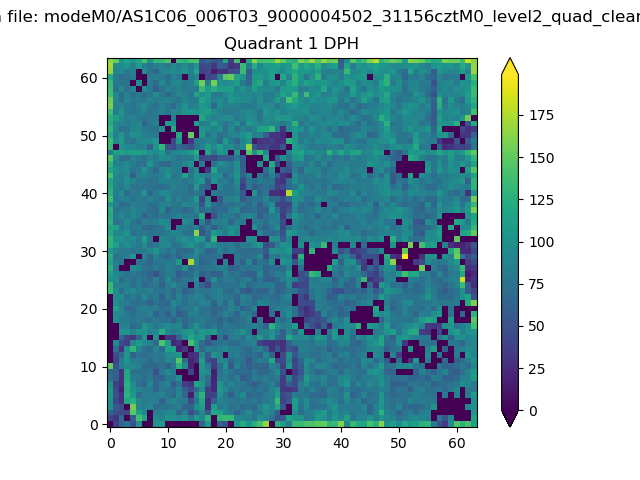 |
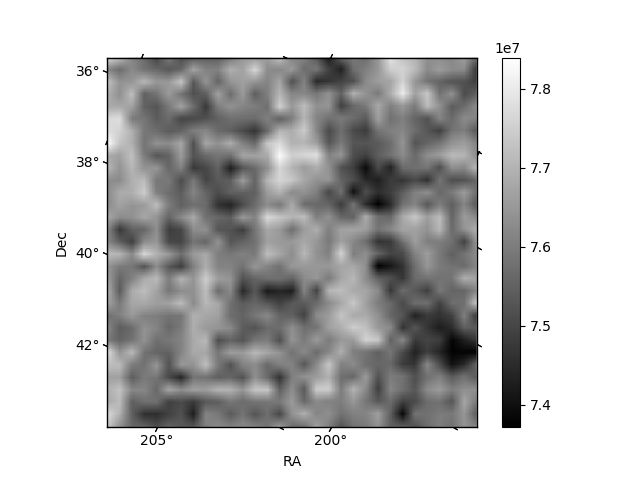
Quadrant B |
|---|---|---|---|
| Quadrant D | 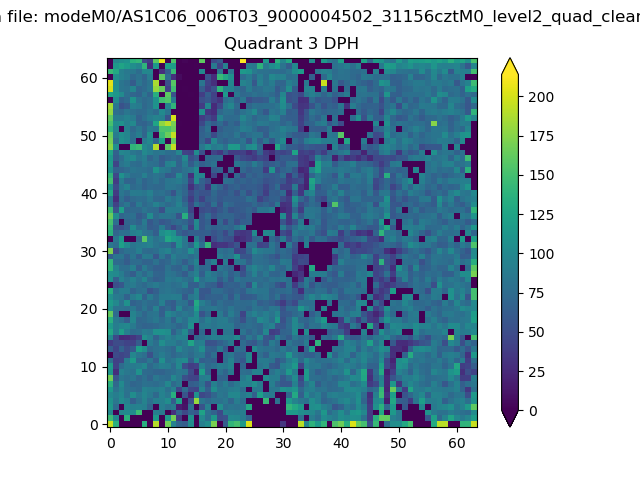 |
 |
Quadrant C |
| Plot type | Count rate plots | Images |
|---|---|---|
| Comparison with Poisson distribution Blue bars denote a histogram of data divided into 1 sec bins. Red curve is a Poisson curve with rate = median count rate of data. |
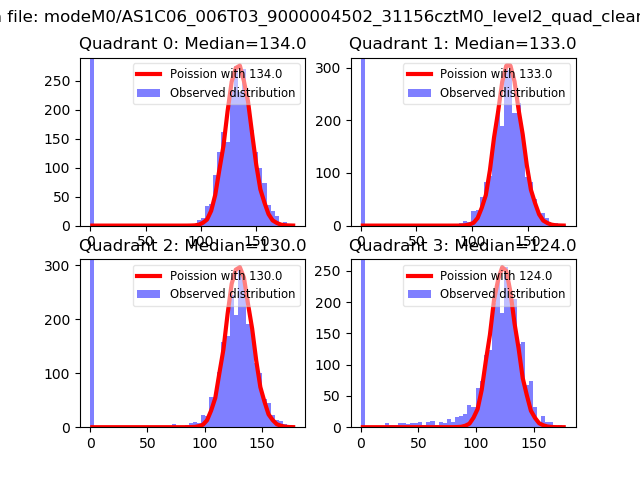 |
 |
| Quadrant-wise count rates Data is divided into 100 sec bins |
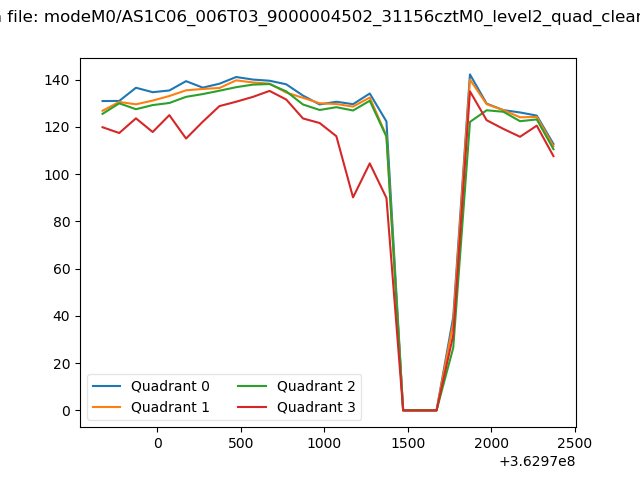 |
|
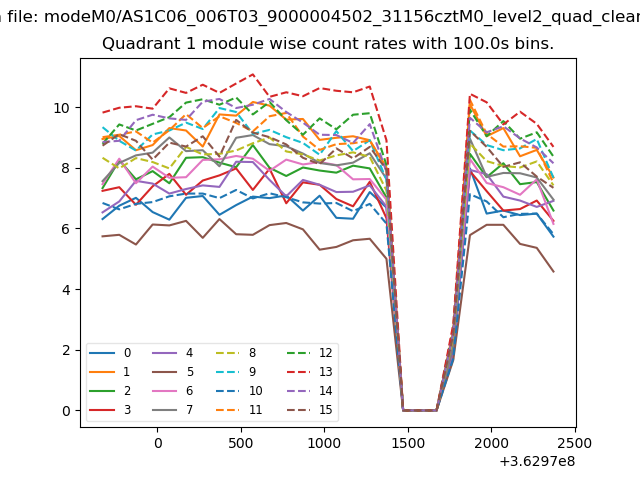
| Module-wise count rates for Quadrant A Data is divided into 100 sec bins |
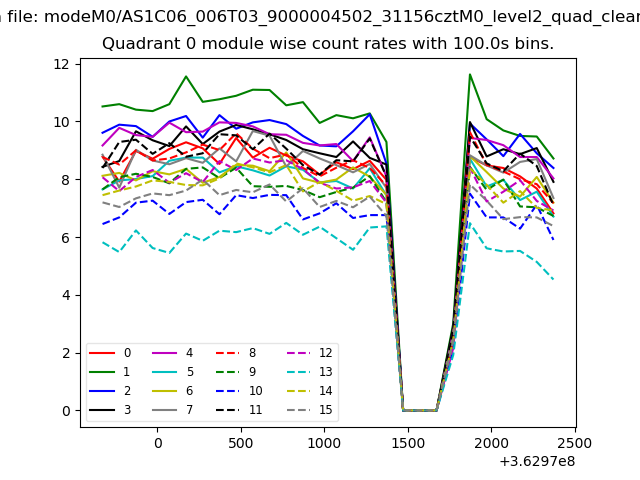 |
 |
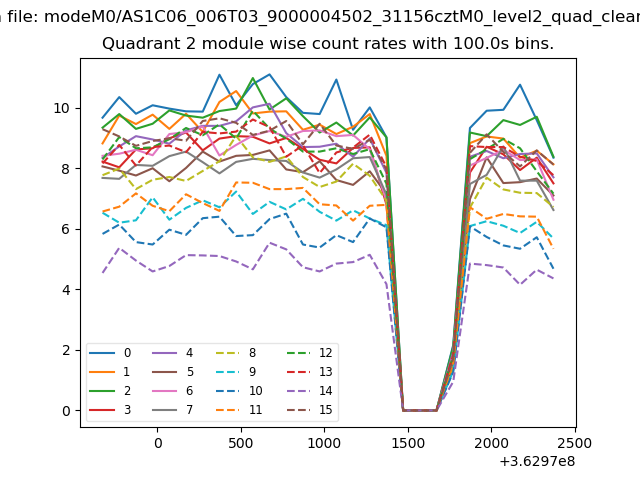
| Module-wise count rates for Quadrant B Data is divided into 100 sec bins |
 |
 |
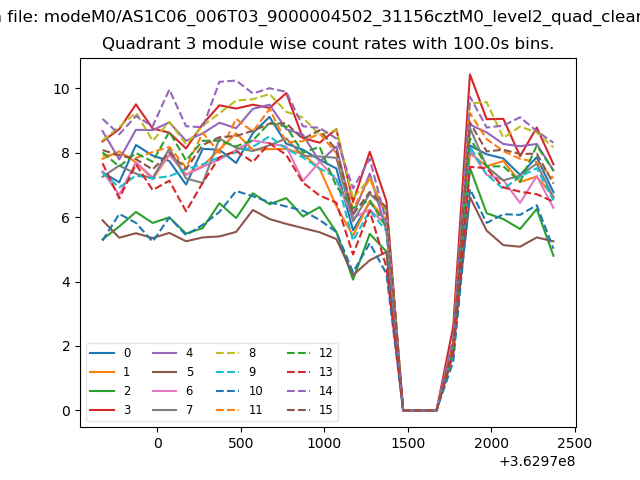
| Module-wise count rates for Quadrant C Data is divided into 100 sec bins |
 |
 |
| Module-wise count rates for Quadrant D Data is divided into 100 sec bins |
 |
 |
| Parameter | Plot |
|---|---|
| CZT HV Monitor | 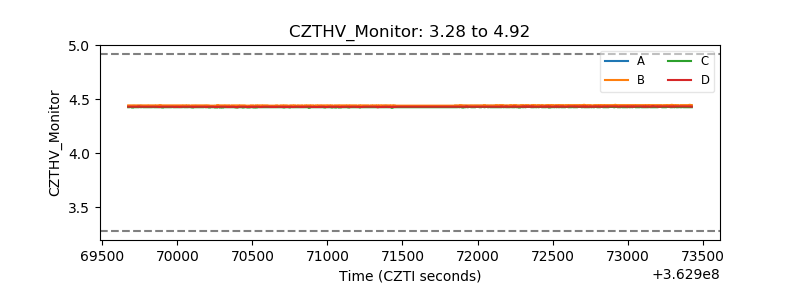 |
| D_VDD | 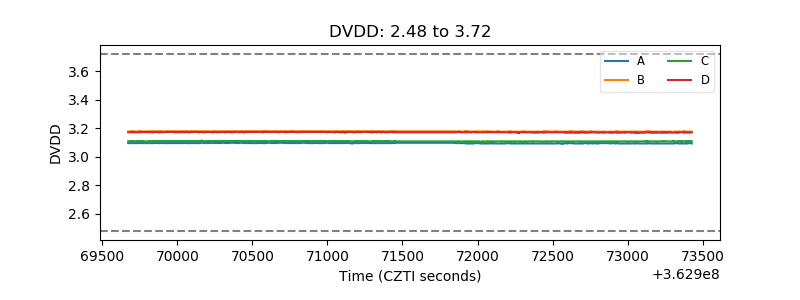 |
| Temperature 1 |  |
| Veto HV Monitor | 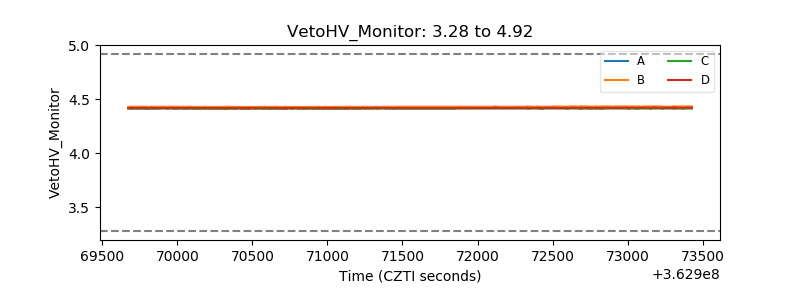 |
| Veto LLD |  |
| Alpha Counter |  |
| _CPM_Rate | 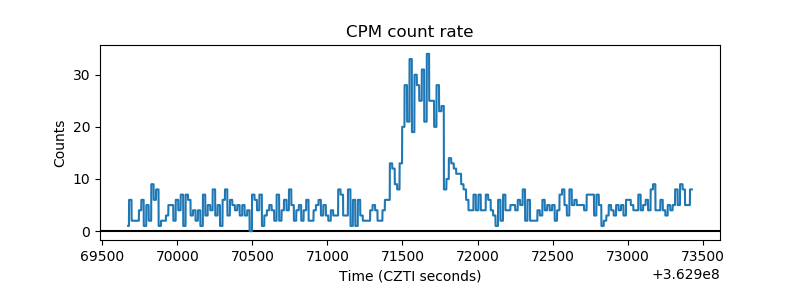 |
| CZT Counter | 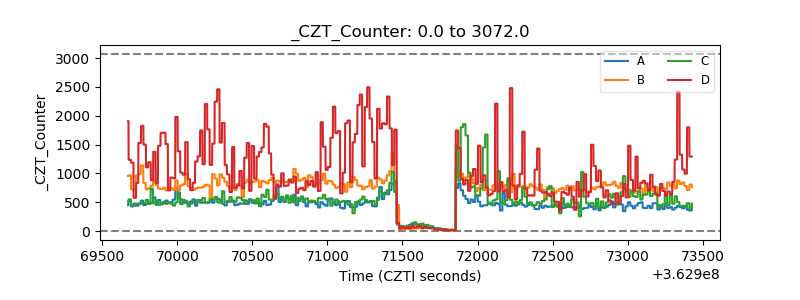 |
| +2.5 Volts monitor |  |
| +5 Volts monitor |  |
| _ROLL_ROT | 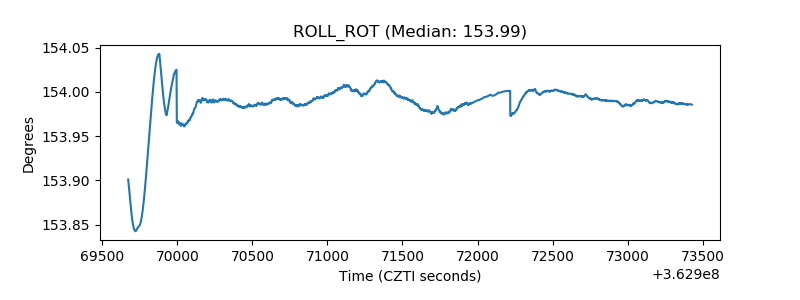 |
| _Roll_DEC | 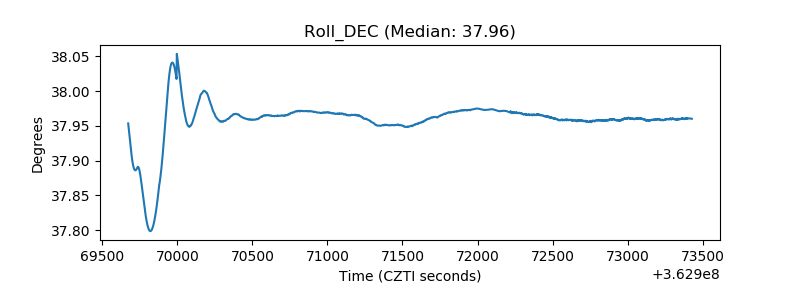 |
| _Roll_RA | 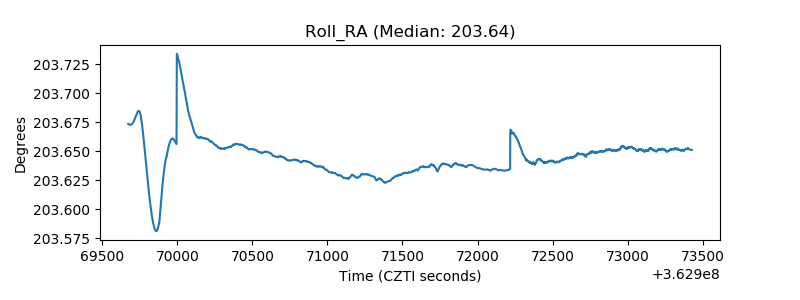 |
| Veto Counter | 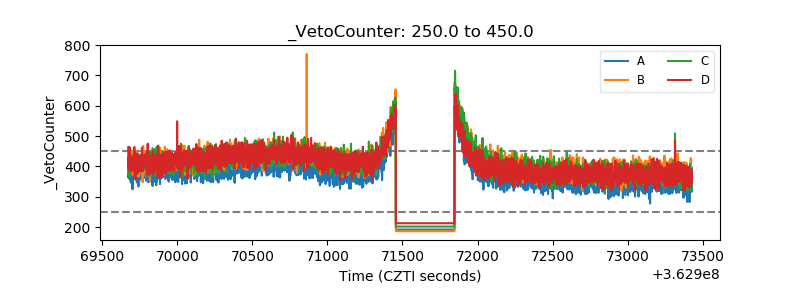 |