| Param | Original file | Final file |
|---|---|---|
| Filename | modeM0/AS1C06_006T03_9000004502_31158cztM0_level2.evt | modeM0/AS1C06_006T03_9000004502_31158cztM0_level2_quad_clean.evt |
| Size (bytes) | 754,914,240 | 78,189,120 |
| Size | 719.9 MB | 74.6 MB |
| Events in quadrant A | 3,646,598 | 480,741 |
| Events in quadrant B | 6,261,347 | 473,119 |
| Events in quadrant C | 4,238,348 | 437,866 |
| Events in quadrant D | 8,182,679 | 425,608 |
| Mode M0 | |||
|---|---|---|---|
| Quadrant | BADHDUFLAG | Total packets | Discarded packets |
| A | 0 | 16021 | 1 |
| B | 0 | 24474 | 1 |
| C | 0 | 17651 | 1 |
| D | 0 | 29946 | 1 |
| Mode M9 | |||
|---|---|---|---|
| Quadrant | BADHDUFLAG | Total packets | Discarded packets |
| A | 0 | 4 | 0 |
| B | 0 | 4 | 0 |
| C | 0 | 4 | 0 |
| D | 0 | 4 | 0 |
| Mode SS | |||
|---|---|---|---|
| Quadrant | BADHDUFLAG | Total packets | Discarded packets |
| A | 0 | 162 | 0 |
| B | 0 | 162 | 0 |
| C | 0 | 162 | 0 |
| D | 0 | 162 | 0 |
| Quadrant | Total seconds | Saturated seconds | Saturation percentage |
|---|---|---|---|
| A | 7899 | 78 | 0.987467% |
| B | 7900 | 169 | 2.139241% |
| C | 7900 | 564 | 7.139241% |
| D | 7900 | 609 | 7.708861% |
Noise dominated data is calculated using 1-second bins in cleaned event files. If a bin has >2000 counts, and if more than 50% of those come from <1% of pixels, then it is considered to be noise-dominated and hence unusable.
| Quadrant | # 1 sec bins | Bins with >0 counts | Bins with >2000 counts | High rate bins dominated by noise | Noise dominated (total time) | Noise dominated (detector-on time) | Marked lightcurve |
|---|---|---|---|---|---|---|---|
| A | 8389 | 7900 | 0 | 0 | 0.00% | 0.00% | 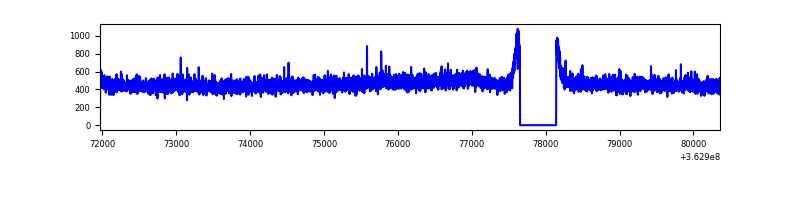 |
| B | 8390 | 7901 | 16 | 16 | 0.19% | 0.20% | 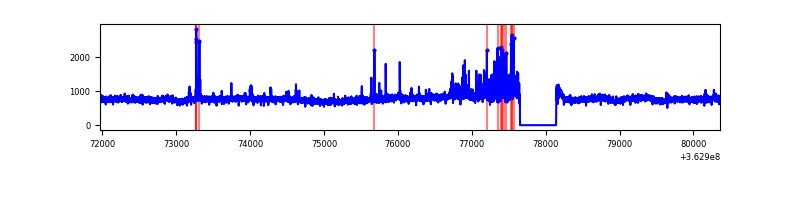 |
| C | 8390 | 7900 | 20 | 20 | 0.24% | 0.25% | 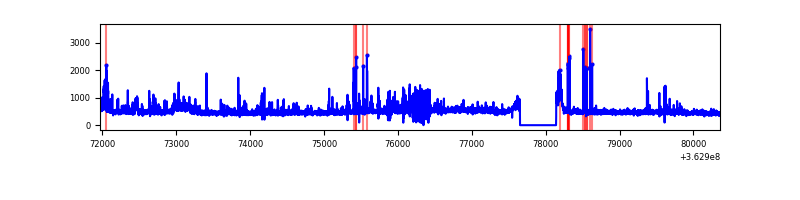 |
| D | 8390 | 7901 | 438 | 438 | 5.22% | 5.54% | 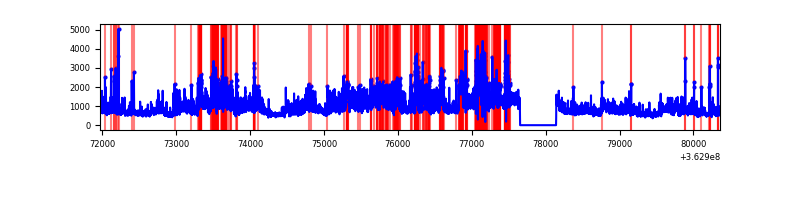 |
Top three noisy pixels from each quadrant. If the there are fewer than three noisy pixels in the level2.evt file, extra rows are filled as -1
| Pixel properties | Quadrant properties | ||||||
|---|---|---|---|---|---|---|---|
| Quadrant | DetID | PixID | Counts | Sigma | Mean | Median | Sigma |
| A | 13 | 254 | 14740 | 72.07 | 944 | 924 | 191.7 |
| A | 3 | 137 | 9781 | 46.2 | 944 | 924 | 191.7 |
| A | 0 | 226 | 8035 | 37.1 | 944 | 924 | 191.7 |
| B | 6 | 159 | 2290346 | 12784.62 | 930 | 908 | 179.1 |
| B | 12 | 18 | 202753 | 1127.14 | 930 | 908 | 179.1 |
| B | 0 | 229 | 37175 | 202.52 | 930 | 908 | 179.1 |
| C | 0 | 10 | 274947 | 1322.12 | 881 | 888 | 207.3 |
| C | 14 | 238 | 267954 | 1288.38 | 881 | 888 | 207.3 |
| C | 14 | 254 | 184691 | 886.71 | 881 | 888 | 207.3 |
| D | 8 | 195 | 2215909 | 10031.76 | 883 | 860 | 220.8 |
| D | 13 | 174 | 2017994 | 9135.42 | 883 | 860 | 220.8 |
| D | 2 | 250 | 348652 | 1575.12 | 883 | 860 | 220.8 |
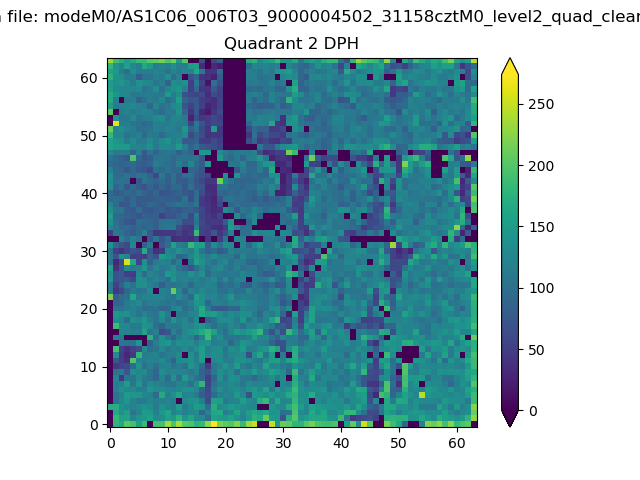
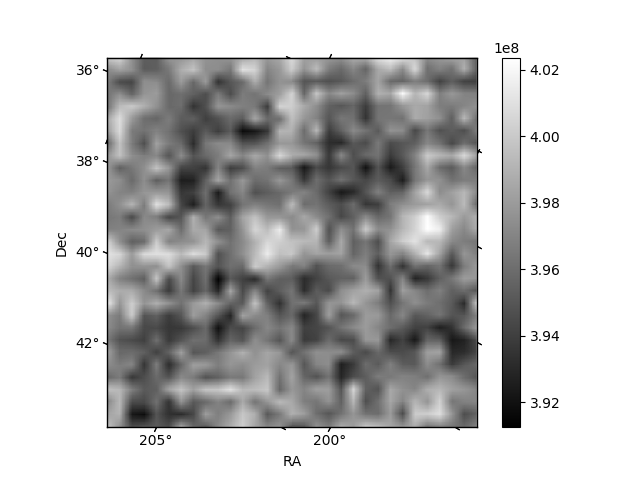
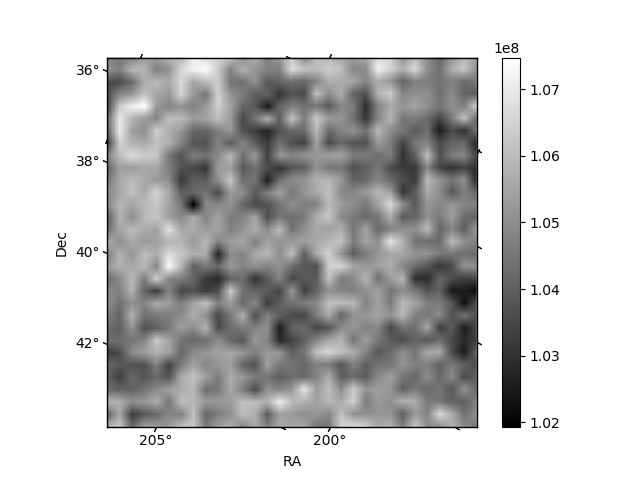
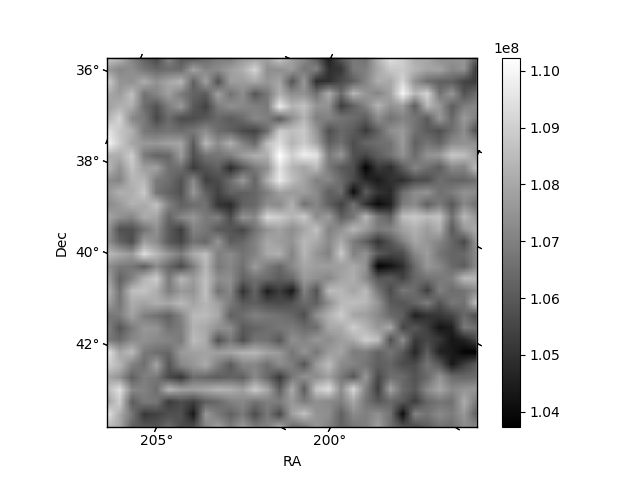
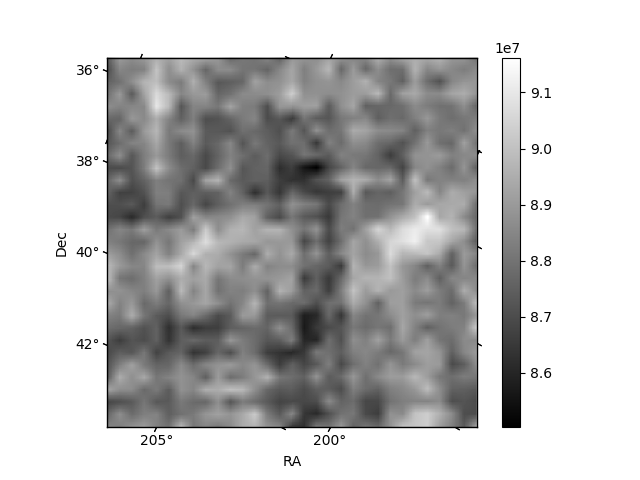
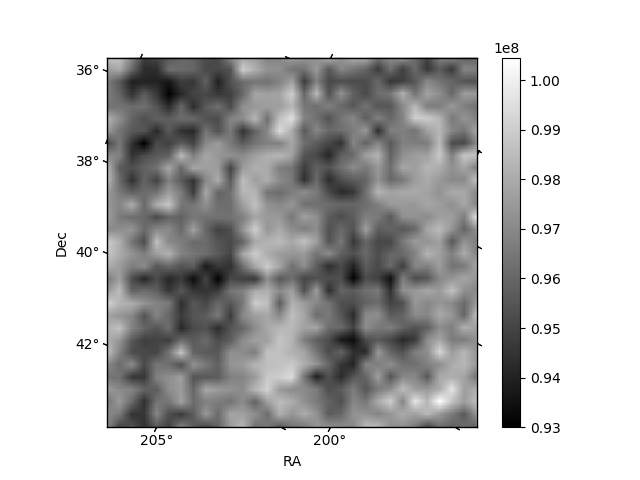
Histogram calculated using DETX and DETY for each event in the final _common_clean file
| Quadrant A | 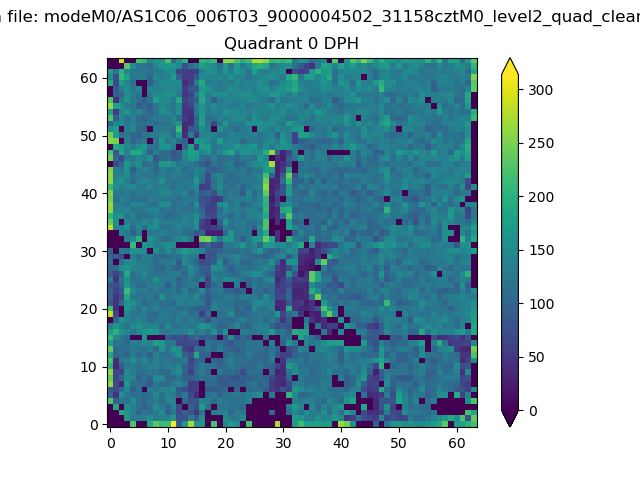 |
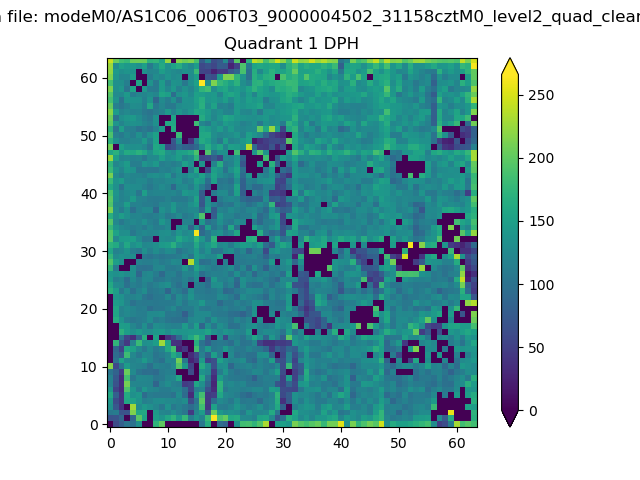 |
Quadrant B |
|---|---|---|---|
| Quadrant D | 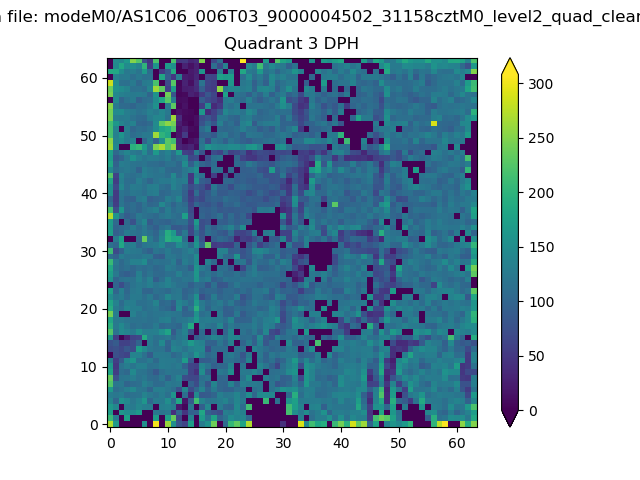 |
 |
Quadrant C |
| Plot type | Count rate plots | Images |
|---|---|---|
| Comparison with Poisson distribution Blue bars denote a histogram of data divided into 1 sec bins. Red curve is a Poisson curve with rate = median count rate of data. |
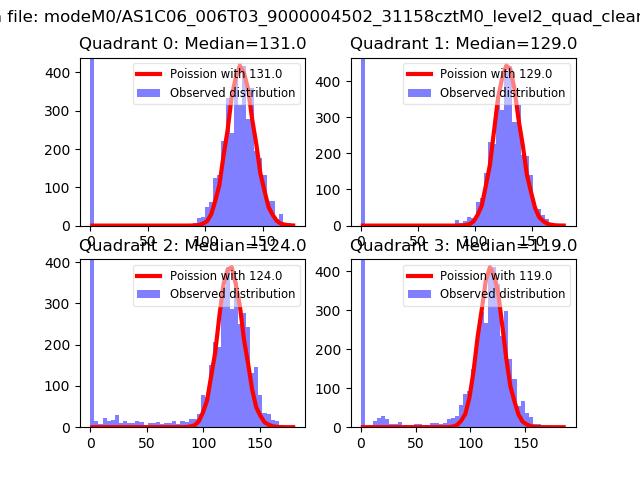 |
 |
| Quadrant-wise count rates Data is divided into 100 sec bins |
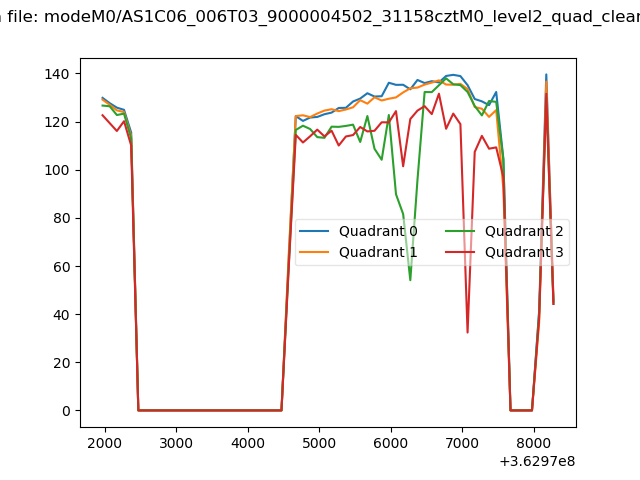 |
|
| Module-wise count rates for Quadrant A Data is divided into 100 sec bins |
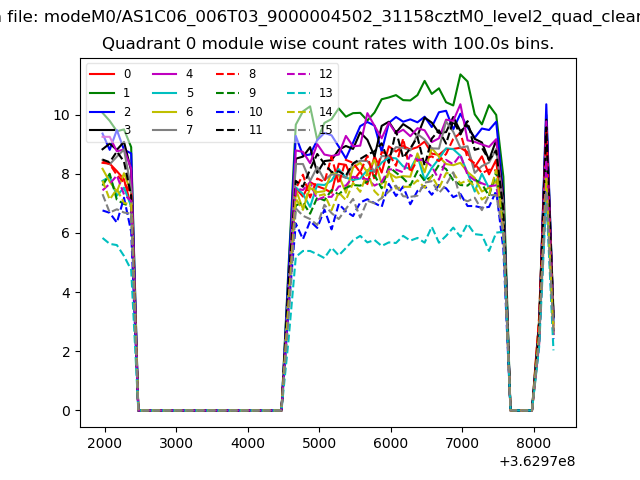 |
 |
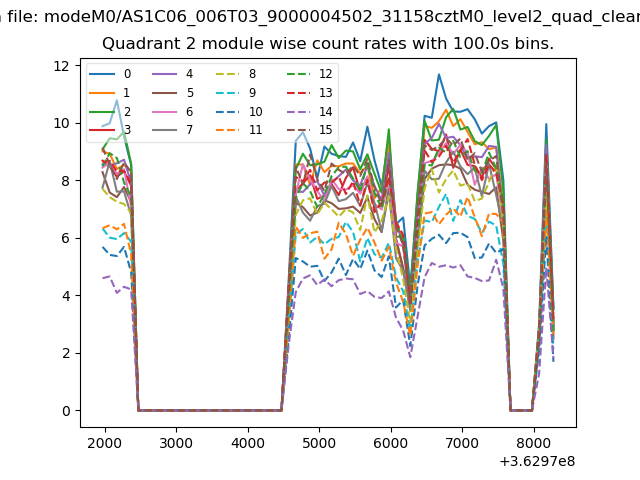
| Module-wise count rates for Quadrant B Data is divided into 100 sec bins |
 |
 |
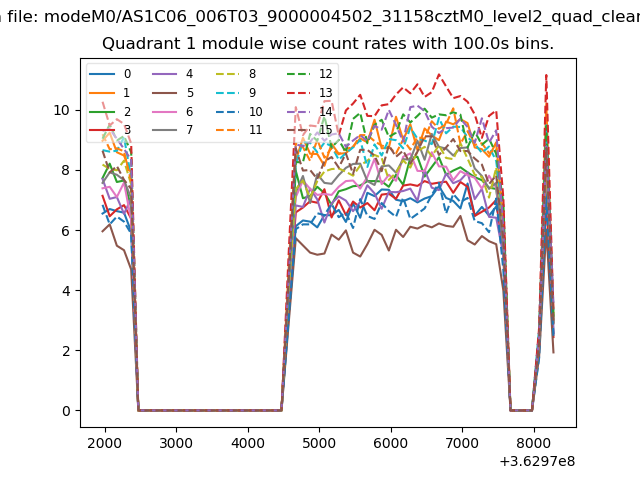
| Module-wise count rates for Quadrant C Data is divided into 100 sec bins |
 |
 |
| Module-wise count rates for Quadrant D Data is divided into 100 sec bins |
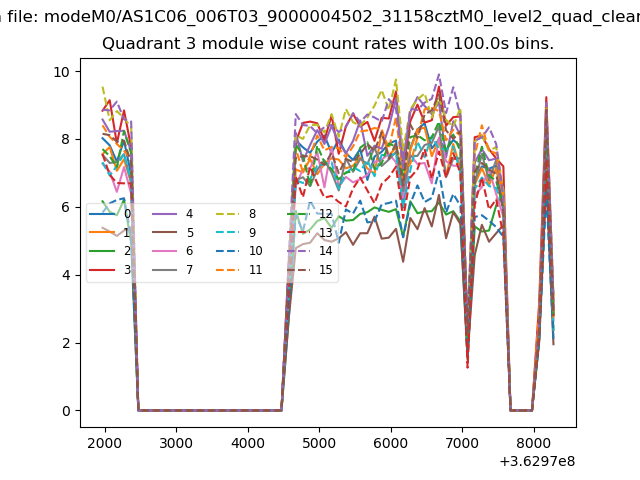 |
 |
| Parameter | Plot |
|---|---|
| CZT HV Monitor | 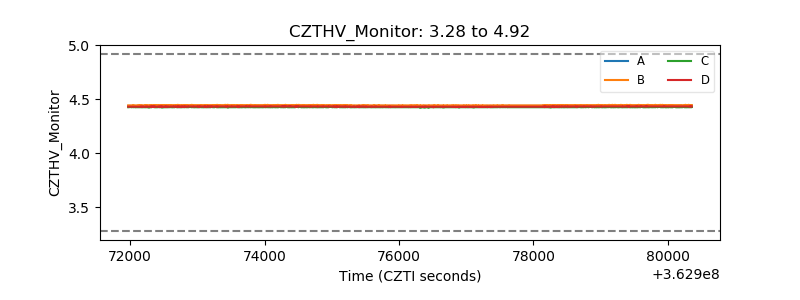 |
| D_VDD | 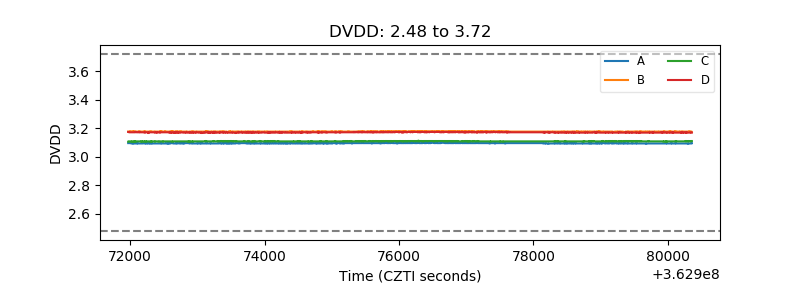 |
| Temperature 1 | 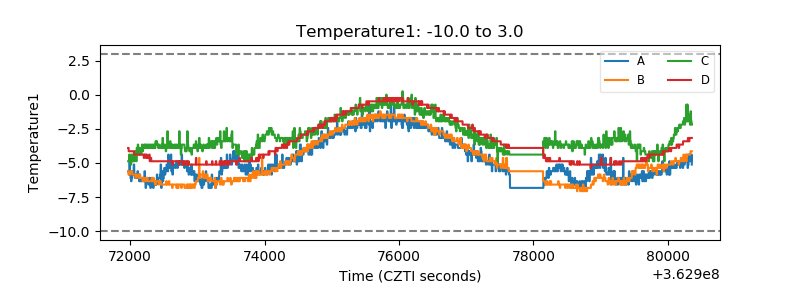 |
| Veto HV Monitor | 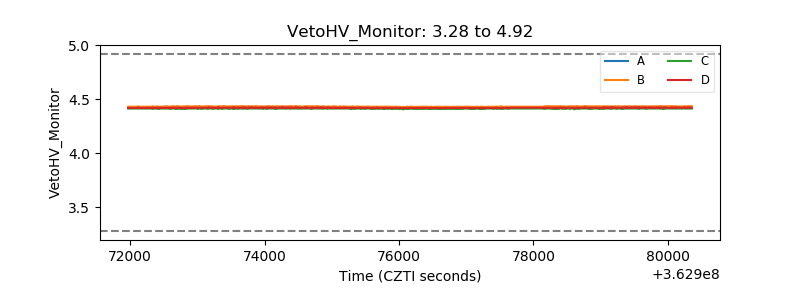 |
| Veto LLD | 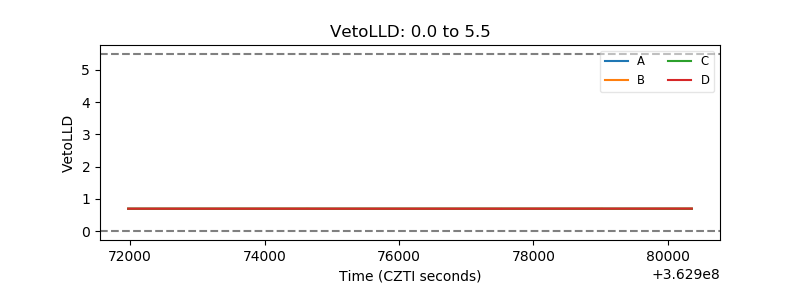 |
| Alpha Counter | 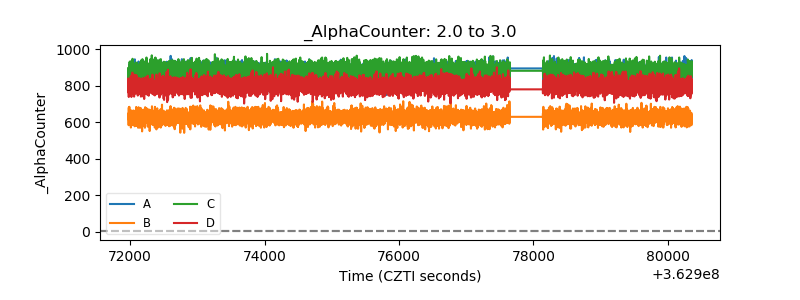 |
| _CPM_Rate | 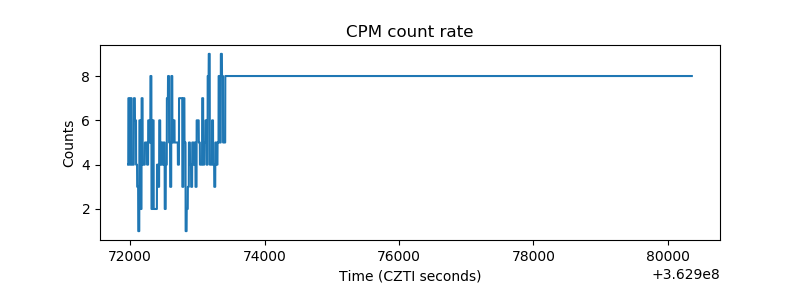 |
| CZT Counter | 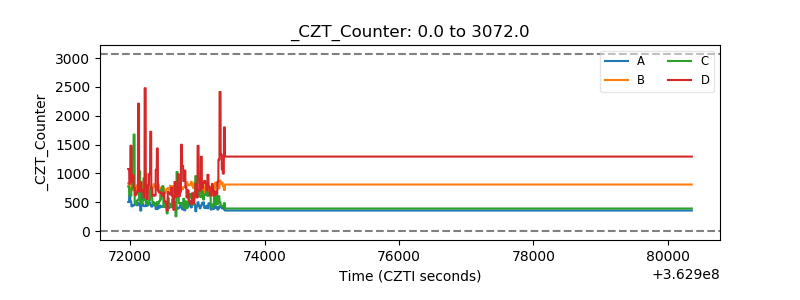 |
| +2.5 Volts monitor |  |
| +5 Volts monitor |  |
| _ROLL_ROT | 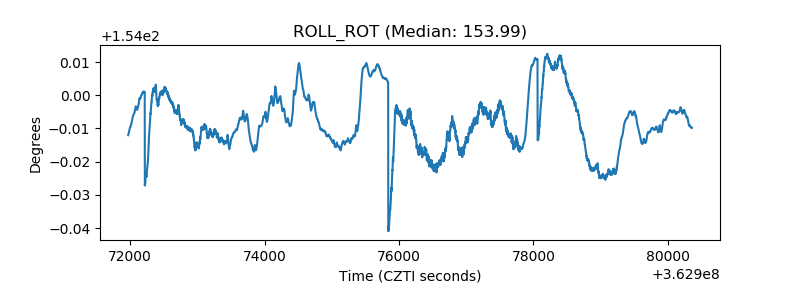 |
| _Roll_DEC | 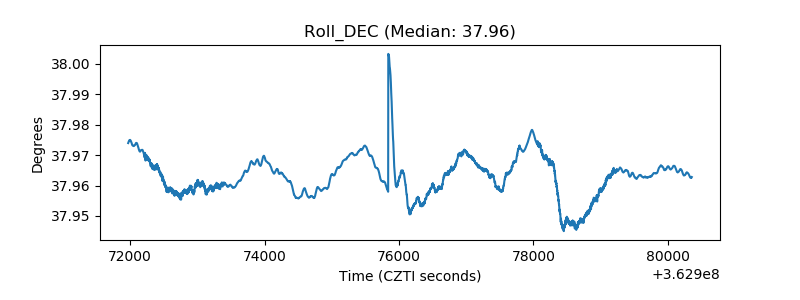 |
| _Roll_RA | 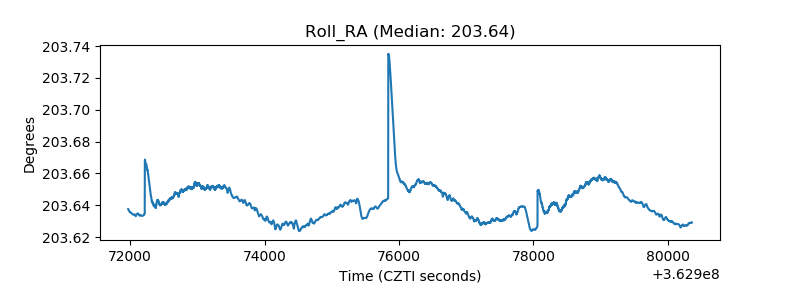 |
| Veto Counter | 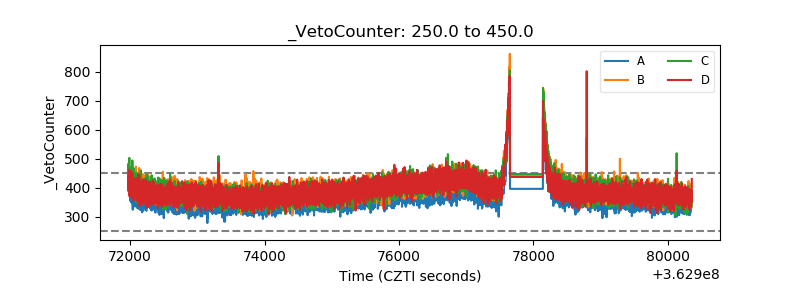 |