| Param | Original file | Final file |
|---|---|---|
| Filename | modeM0/AS1C06_006T03_9000004502_31159cztM0_level2.evt | modeM0/AS1C06_006T03_9000004502_31159cztM0_level2_quad_clean.evt |
| Size (bytes) | 301,112,640 | 49,167,360 |
| Size | 287.2 MB | 46.9 MB |
| Events in quadrant A | 1,370,904 | 332,657 |
| Events in quadrant B | 2,422,068 | 328,750 |
| Events in quadrant C | 1,438,574 | 321,729 |
| Events in quadrant D | 3,682,929 | 291,574 |
| Mode M0 | |||
|---|---|---|---|
| Quadrant | BADHDUFLAG | Total packets | Discarded packets |
| A | 0 | 6014 | 0 |
| B | 0 | 9508 | 0 |
| C | 0 | 6131 | 0 |
| D | 0 | 13065 | 0 |
| Mode SS | |||
|---|---|---|---|
| Quadrant | BADHDUFLAG | Total packets | Discarded packets |
| A | 0 | 60 | 0 |
| B | 0 | 60 | 0 |
| C | 0 | 60 | 0 |
| D | 0 | 60 | 0 |
| Quadrant | Total seconds | Saturated seconds | Saturation percentage |
|---|---|---|---|
| A | 3000 | 2 | 0.066667% |
| B | 3000 | 54 | 1.800000% |
| C | 3000 | 38 | 1.266667% |
| D | 3001 | 464 | 15.461513% |
Noise dominated data is calculated using 1-second bins in cleaned event files. If a bin has >2000 counts, and if more than 50% of those come from <1% of pixels, then it is considered to be noise-dominated and hence unusable.
| Quadrant | # 1 sec bins | Bins with >0 counts | Bins with >2000 counts | High rate bins dominated by noise | Noise dominated (total time) | Noise dominated (detector-on time) | Marked lightcurve |
|---|---|---|---|---|---|---|---|
| A | 3001 | 3001 | 0 | 0 | 0.00% | 0.00% | 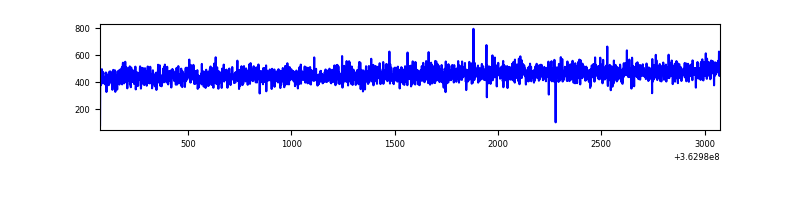 |
| B | 3001 | 3001 | 31 | 31 | 1.03% | 1.03% | 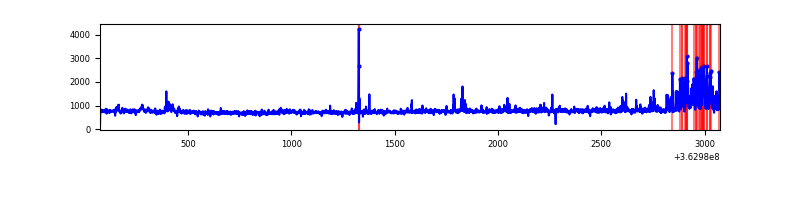 |
| C | 3001 | 3001 | 5 | 5 | 0.17% | 0.17% | 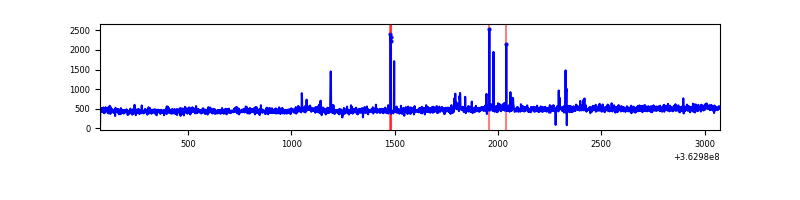 |
| D | 3002 | 3002 | 462 | 462 | 15.39% | 15.39% | 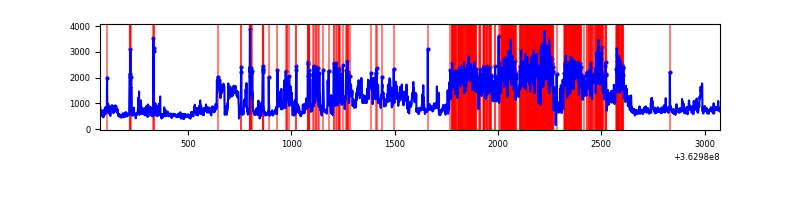 |
Top three noisy pixels from each quadrant. If the there are fewer than three noisy pixels in the level2.evt file, extra rows are filled as -1
| Pixel properties | Quadrant properties | ||||||
|---|---|---|---|---|---|---|---|
| Quadrant | DetID | PixID | Counts | Sigma | Mean | Median | Sigma |
| A | 13 | 254 | 5910 | 75.7 | 354 | 346 | 73.5 |
| A | 3 | 137 | 3597 | 44.23 | 354 | 346 | 73.5 |
| A | 0 | 226 | 2974 | 35.75 | 354 | 346 | 73.5 |
| B | 6 | 159 | 812237 | 11918.31 | 345 | 337 | 68.1 |
| B | 12 | 18 | 166994 | 2446.45 | 345 | 337 | 68.1 |
| B | 0 | 190 | 27798 | 403.11 | 345 | 337 | 68.1 |
| C | 14 | 238 | 65007 | 800.55 | 338 | 340 | 80.8 |
| C | 0 | 10 | 21596 | 263.14 | 338 | 340 | 80.8 |
| C | 14 | 254 | 13546 | 163.48 | 338 | 340 | 80.8 |
| D | 8 | 195 | 1239338 | 14414.96 | 327 | 320 | 86.0 |
| D | 13 | 174 | 755842 | 8789.88 | 327 | 320 | 86.0 |
| D | 12 | 16 | 188873 | 2193.66 | 327 | 320 | 86.0 |
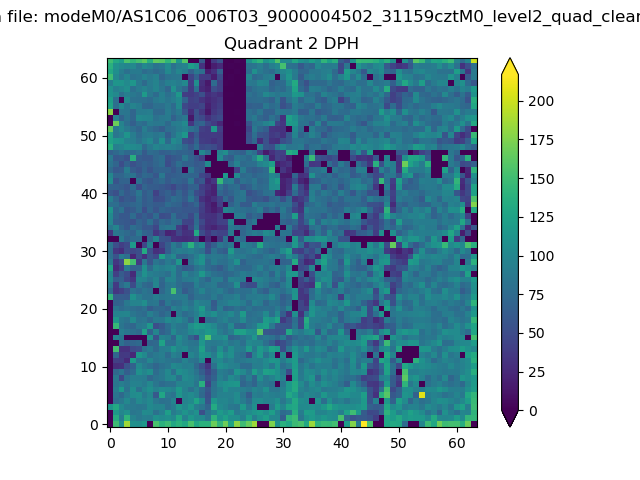
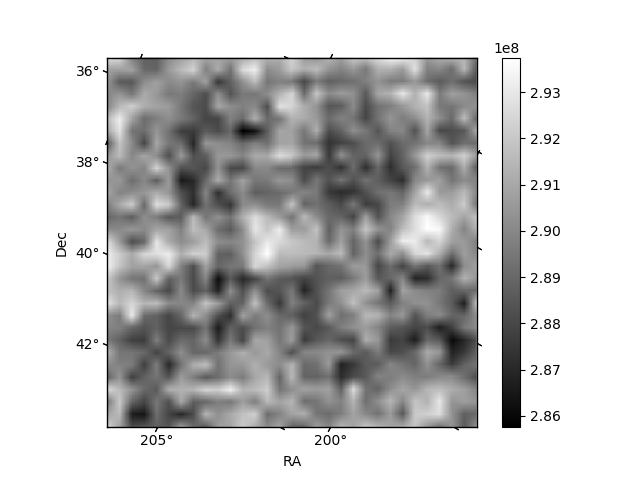
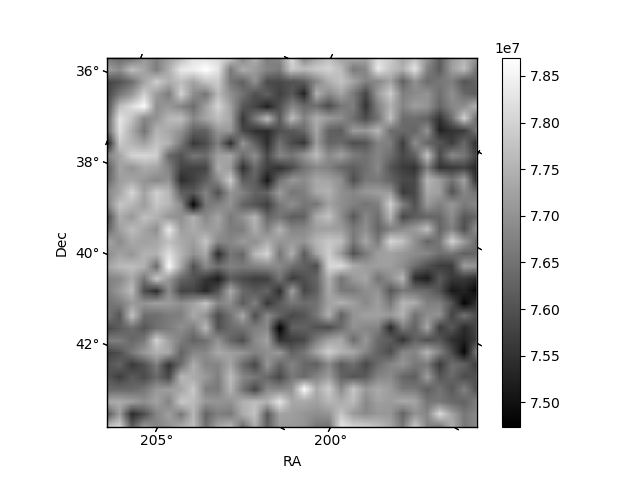
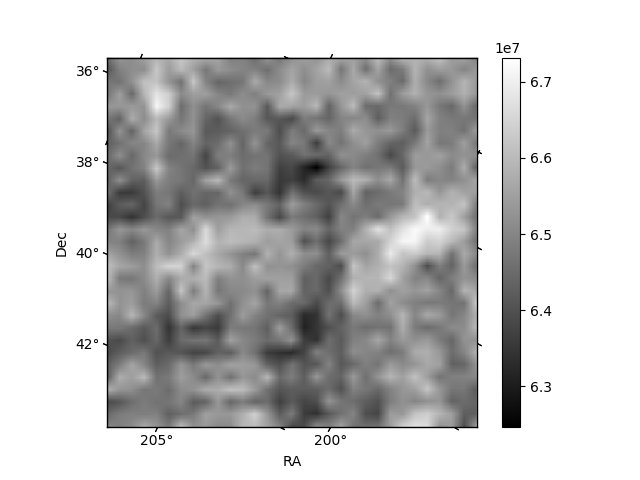
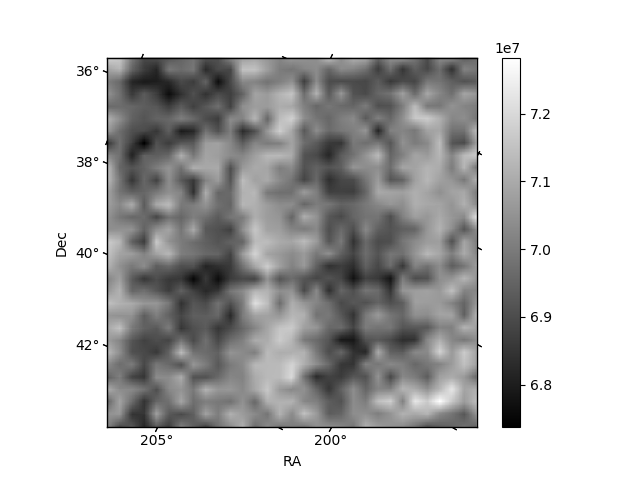
Histogram calculated using DETX and DETY for each event in the final _common_clean file
| Quadrant A | 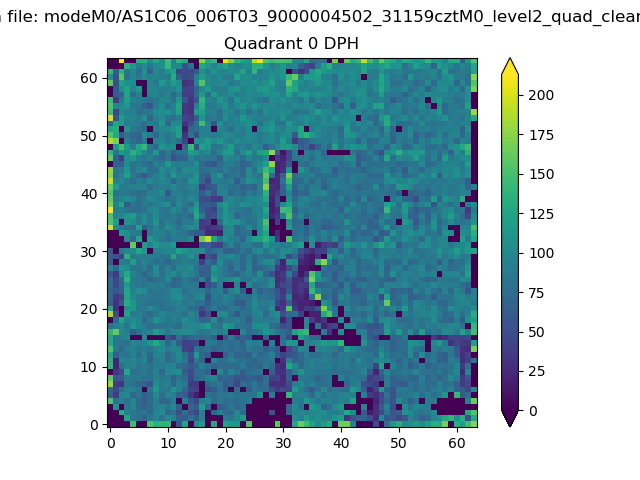 |
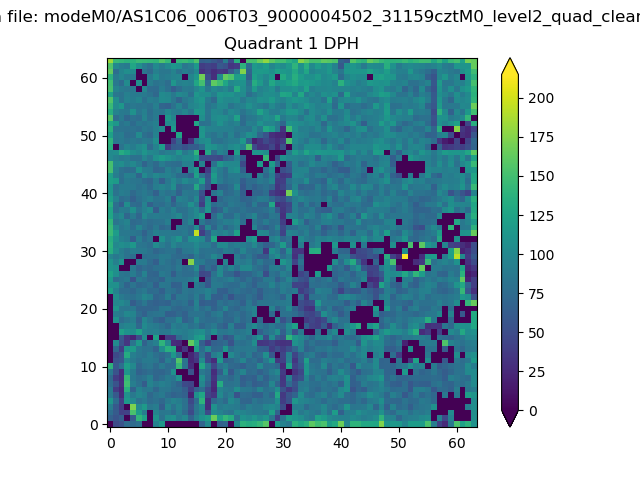 |
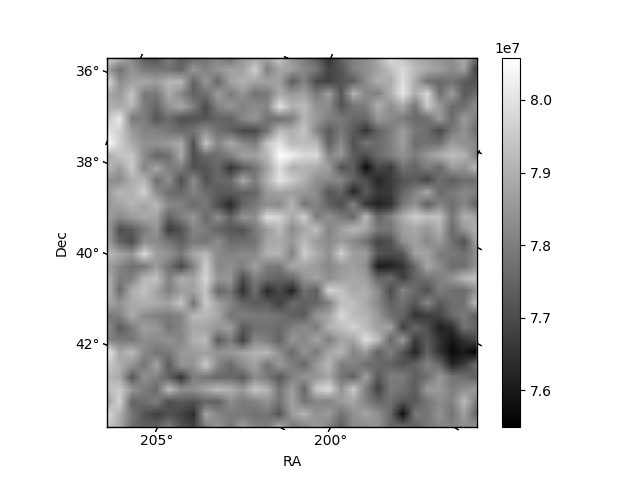
Quadrant B |
|---|---|---|---|
| Quadrant D | 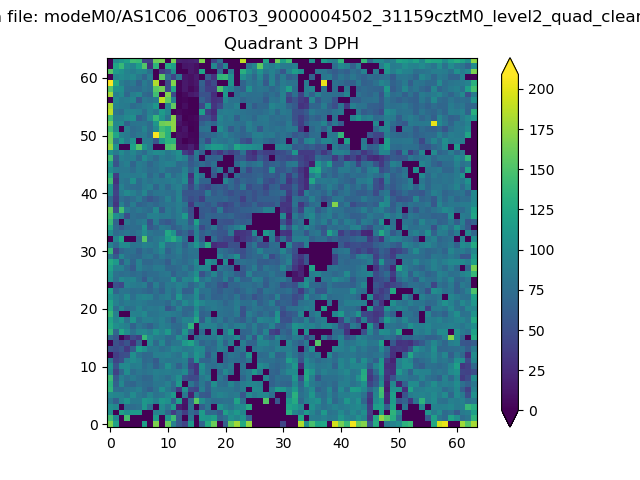 |
 |
Quadrant C |
| Plot type | Count rate plots | Images |
|---|---|---|
| Comparison with Poisson distribution Blue bars denote a histogram of data divided into 1 sec bins. Red curve is a Poisson curve with rate = median count rate of data. |
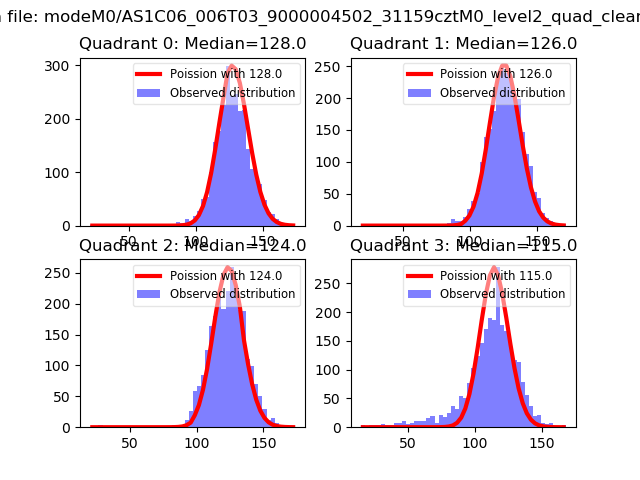 |
 |
| Quadrant-wise count rates Data is divided into 100 sec bins |
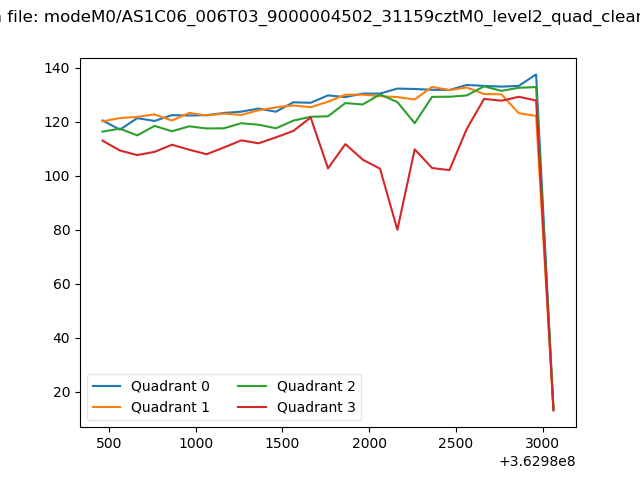 |
|
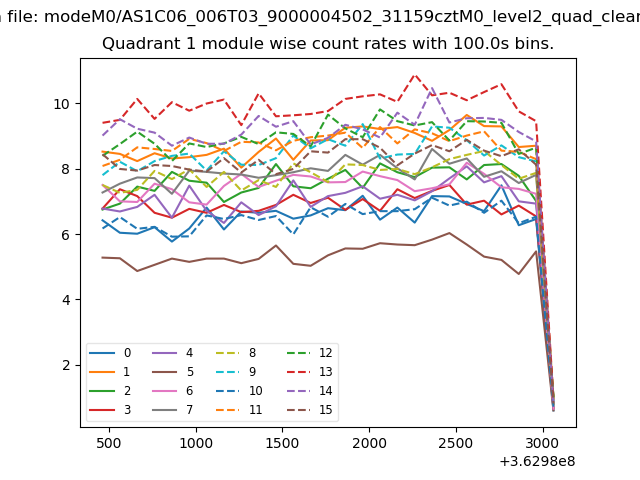
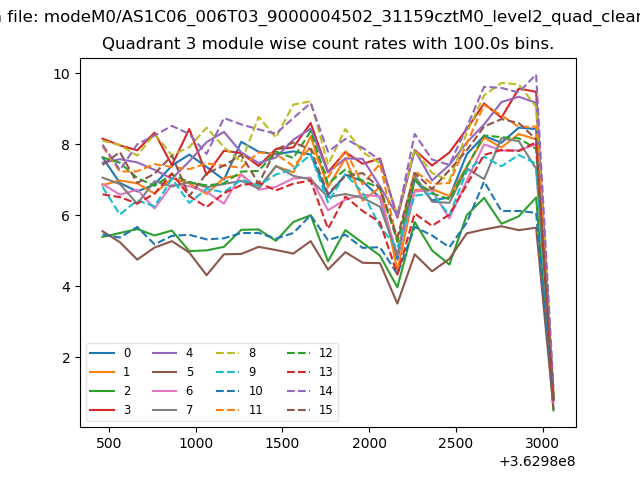
| Module-wise count rates for Quadrant A Data is divided into 100 sec bins |
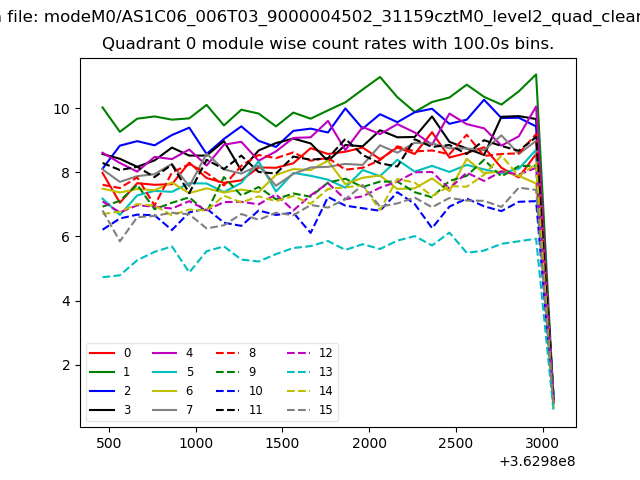 |
 |
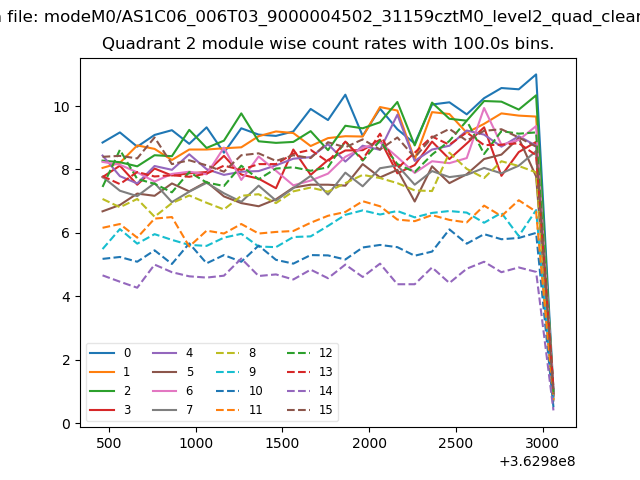
| Module-wise count rates for Quadrant B Data is divided into 100 sec bins |
 |
 |
| Module-wise count rates for Quadrant C Data is divided into 100 sec bins |
 |
 |
| Module-wise count rates for Quadrant D Data is divided into 100 sec bins |
 |
 |
| Parameter | Plot |
|---|---|
| CZT HV Monitor | 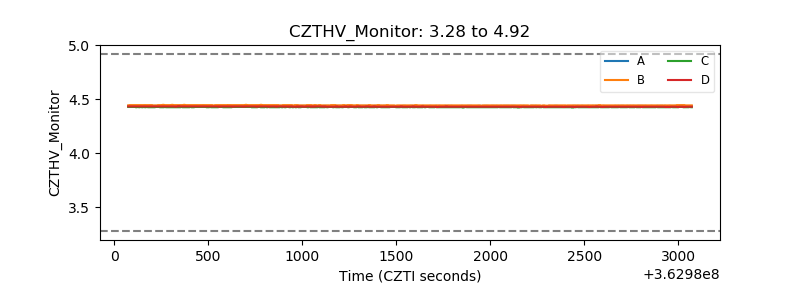 |
| D_VDD | 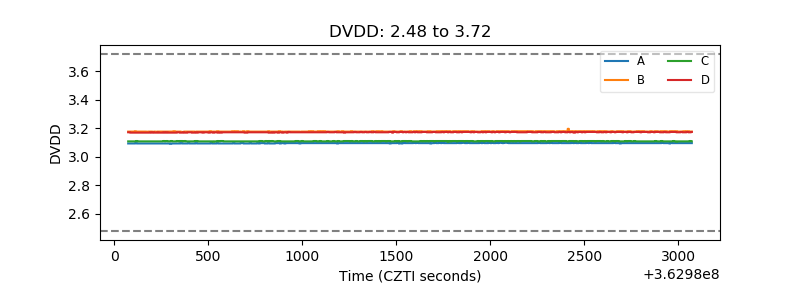 |
| Temperature 1 | 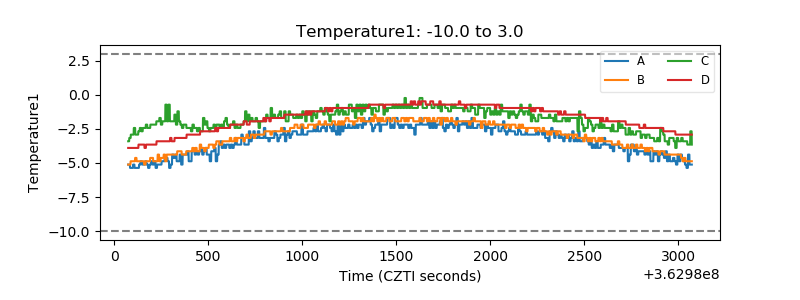 |
| Veto HV Monitor | 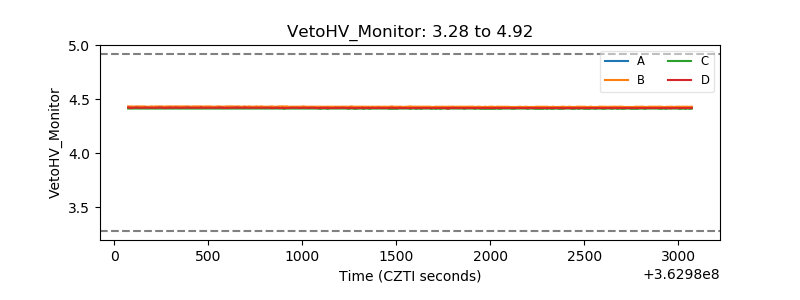 |
| Veto LLD |  |
| Alpha Counter | 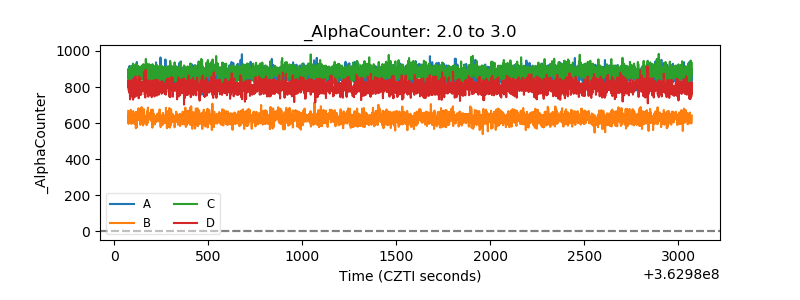 |
| _CPM_Rate | 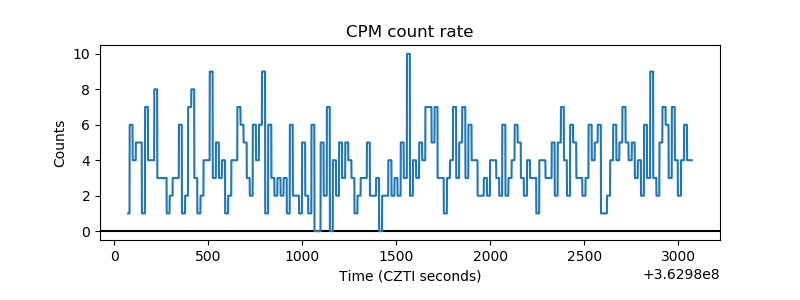 |
| CZT Counter | 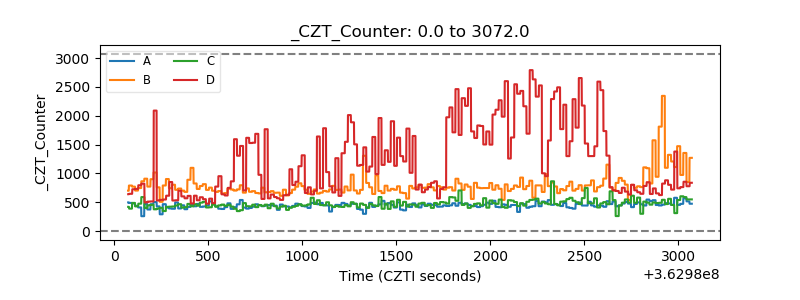 |
| +2.5 Volts monitor |  |
| +5 Volts monitor |  |
| _ROLL_ROT | 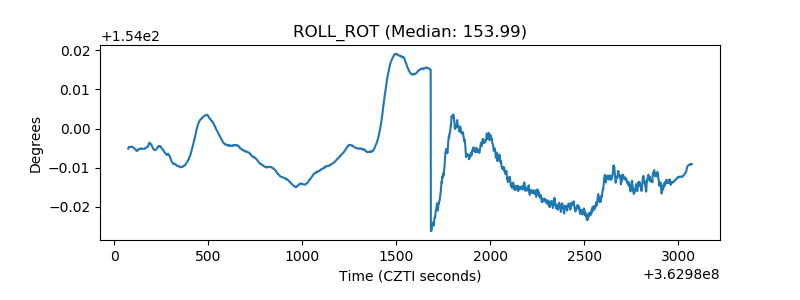 |
| _Roll_DEC | 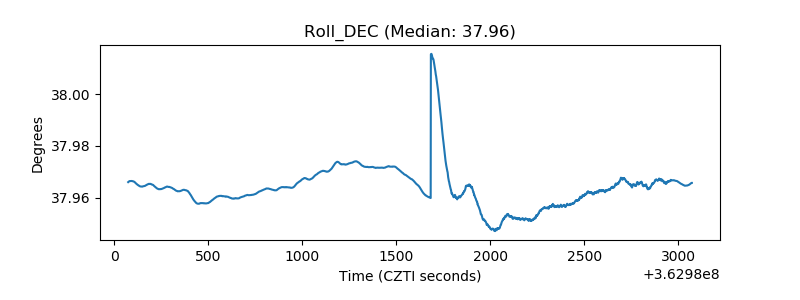 |
| _Roll_RA | 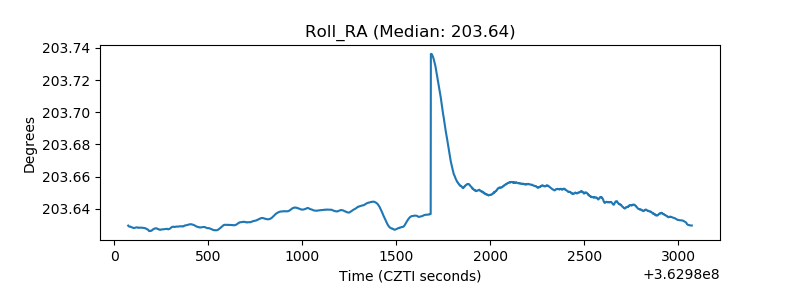 |
| Veto Counter | 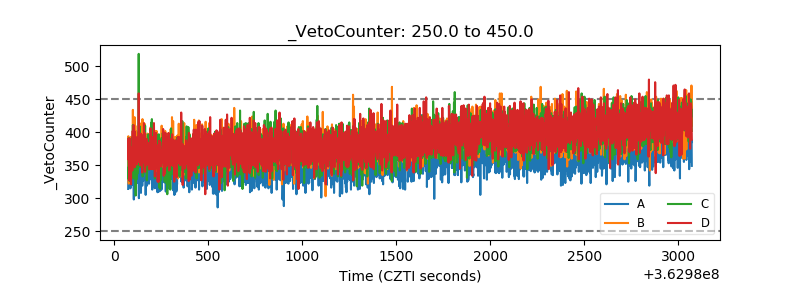 |