| Param | Original file | Final file |
|---|---|---|
| Filename | modeM0/AS1C06_006T05_9000004506cztM0_level2.fits | modeM0/AS1C06_006T05_9000004506cztM0_level2_quad_clean.evt |
| Size (bytes) | 83,269,440 | 48,412,800 |
| Size | 79.4 MB | 46.2 MB |
| Events in quadrant A | 545,430 | 252,045 |
| Events in quadrant B | 495,954 | 243,292 |
| Events in quadrant C | 506,306 | 234,765 |
| Events in quadrant D | 452,434 | 213,032 |
| Mode M0 | |||
|---|---|---|---|
| Quadrant | BADHDUFLAG | Total packets | Discarded packets |
| A | 0 | 16683 | 0 |
| B | 0 | 23571 | 0 |
| C | 0 | 17071 | 0 |
| D | 0 | 24645 | 0 |
| Mode M9 | |||
|---|---|---|---|
| Quadrant | BADHDUFLAG | Total packets | Discarded packets |
| A | 0 | 23 | 0 |
| B | 0 | 23 | 0 |
| C | 0 | 23 | 0 |
| D | 0 | 23 | 0 |
| Mode SS | |||
|---|---|---|---|
| Quadrant | BADHDUFLAG | Total packets | Discarded packets |
| A | 0 | 154 | 0 |
| B | 0 | 154 | 0 |
| C | 0 | 154 | 0 |
| D | 0 | 154 | 0 |
| Quadrant | Total seconds | Saturated seconds | Saturation percentage |
|---|---|---|---|
| A | 7500 | 149 | 1.986667% |
| B | 7500 | 268 | 3.573333% |
| C | 7500 | 247 | 3.293333% |
| D | 7500 | 287 | 3.826667% |
Noise dominated data is calculated using 1-second bins in cleaned event files. If a bin has >2000 counts, and if more than 50% of those come from <1% of pixels, then it is considered to be noise-dominated and hence unusable.
| Quadrant | # 1 sec bins | Bins with >0 counts | Bins with >2000 counts | High rate bins dominated by noise | Noise dominated (total time) | Noise dominated (detector-on time) | Marked lightcurve |
|---|---|---|---|---|---|---|---|
| A | 9795 | 7500 | 0 | 0 | 0.00% | 0.00% | 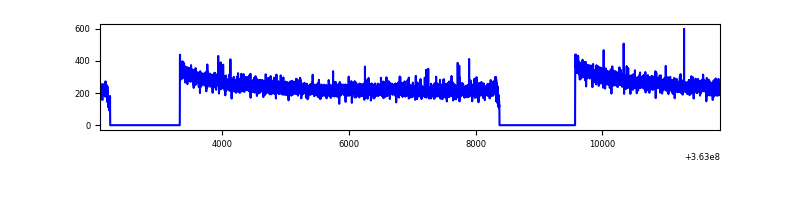 |
| B | 9795 | 7500 | 0 | 0 | 0.00% | 0.00% |  |
| C | 9795 | 7500 | 0 | 0 | 0.00% | 0.00% |  |
| D | 9795 | 7499 | 0 | 0 | 0.00% | 0.00% |  |
Top three noisy pixels from each quadrant. If the there are fewer than three noisy pixels in the level2.evt file, extra rows are filled as -1
| Pixel properties | Quadrant properties | ||||||
|---|---|---|---|---|---|---|---|
| Quadrant | DetID | PixID | Counts | Sigma | Mean | Median | Sigma |
| A | 0 | 29 | 478 | 9.56 | 142 | 135 | 35.9 |
| A | 7 | 110 | 434 | 8.33 | 142 | 135 | 35.9 |
| A | 9 | 19 | 422 | 8.0 | 142 | 135 | 35.9 |
| B | 2 | 9 | 361 | 8.43 | 131 | 126 | 27.9 |
| B | 5 | 225 | 337 | 7.57 | 131 | 126 | 27.9 |
| B | 14 | 254 | 334 | 7.46 | 131 | 126 | 27.9 |
| C | 9 | 233 | 358 | 6.55 | 134 | 126 | 35.4 |
| C | 9 | 209 | 354 | 6.44 | 134 | 126 | 35.4 |
| C | 3 | 126 | 343 | 6.13 | 134 | 126 | 35.4 |
| D | 15 | 46 | 356 | 6.7 | 129 | 118 | 35.5 |
| D | 6 | 231 | 333 | 6.05 | 129 | 118 | 35.5 |
| D | 12 | 6 | 332 | 6.03 | 129 | 118 | 35.5 |
Histogram calculated using DETX and DETY for each event in the final _common_clean file
| Quadrant A |  |
 |
Quadrant B |
|---|---|---|---|
| Quadrant D |  |
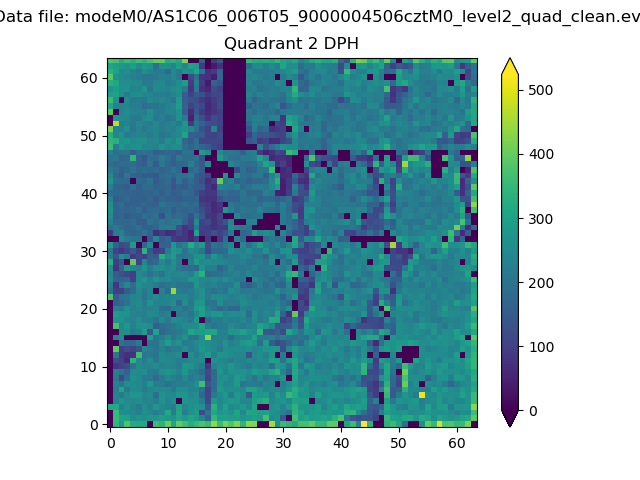 |
Quadrant C |
| Plot type | Count rate plots | Images |
|---|---|---|
| Comparison with Poisson distribution Blue bars denote a histogram of data divided into 1 sec bins. Red curve is a Poisson curve with rate = median count rate of data. |
 |
 |
| Quadrant-wise count rates Data is divided into 100 sec bins |
 |
|
| Module-wise count rates for Quadrant A Data is divided into 100 sec bins |
 |
 |
| Module-wise count rates for Quadrant B Data is divided into 100 sec bins |
 |
 |
| Module-wise count rates for Quadrant C Data is divided into 100 sec bins |
 |
 |
| Module-wise count rates for Quadrant D Data is divided into 100 sec bins |
 |
 |
| Parameter | Plot |
|---|---|
| CZT HV Monitor |  |
| D_VDD |  |
| Temperature 1 |  |
| Veto HV Monitor |  |
| Veto LLD | 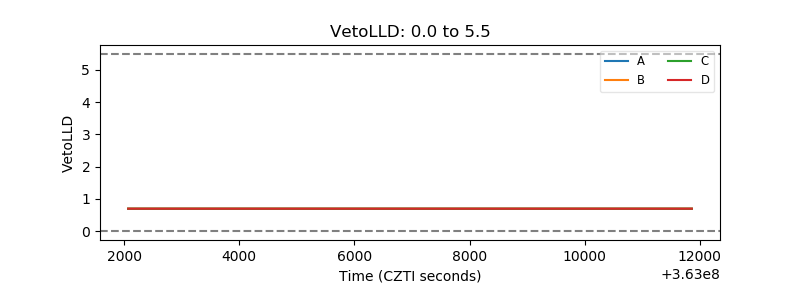 |
| Alpha Counter |  |
| _CPM_Rate |  |
| CZT Counter |  |
| +2.5 Volts monitor |  |
| +5 Volts monitor |  |
| _ROLL_ROT |  |
| _Roll_DEC |  |
| _Roll_RA |  |
| Veto Counter |  |