| Param | Original file | Final file |
|---|---|---|
| Filename | modeM0/AS1C06_006T05_9000004506_31163cztM0_level2.evt | modeM0/AS1C06_006T05_9000004506_31163cztM0_level2_quad_clean.evt |
| Size (bytes) | 607,034,880 | 115,522,560 |
| Size | 578.9 MB | 110.2 MB |
| Events in quadrant A | 3,472,113 | 793,481 |
| Events in quadrant B | 5,451,771 | 776,680 |
| Events in quadrant C | 3,592,331 | 743,745 |
| Events in quadrant D | 5,426,634 | 729,713 |
| Mode M0 | |||
|---|---|---|---|
| Quadrant | BADHDUFLAG | Total packets | Discarded packets |
| A | 0 | 14577 | 1 |
| B | 0 | 20564 | 1 |
| C | 0 | 14796 | 1 |
| D | 0 | 21104 | 1 |
| Mode M9 | |||
|---|---|---|---|
| Quadrant | BADHDUFLAG | Total packets | Discarded packets |
| A | 0 | 12 | 0 |
| B | 0 | 12 | 0 |
| C | 0 | 12 | 0 |
| D | 0 | 12 | 0 |
| Mode SS | |||
|---|---|---|---|
| Quadrant | BADHDUFLAG | Total packets | Discarded packets |
| A | 0 | 132 | 0 |
| B | 0 | 132 | 0 |
| C | 0 | 132 | 0 |
| D | 0 | 132 | 0 |
| Quadrant | Total seconds | Saturated seconds | Saturation percentage |
|---|---|---|---|
| A | 6529 | 83 | 1.271251% |
| B | 6530 | 178 | 2.725881% |
| C | 6530 | 146 | 2.235835% |
| D | 6530 | 190 | 2.909648% |
Noise dominated data is calculated using 1-second bins in cleaned event files. If a bin has >2000 counts, and if more than 50% of those come from <1% of pixels, then it is considered to be noise-dominated and hence unusable.
| Quadrant | # 1 sec bins | Bins with >0 counts | Bins with >2000 counts | High rate bins dominated by noise | Noise dominated (total time) | Noise dominated (detector-on time) | Marked lightcurve |
|---|---|---|---|---|---|---|---|
| A | 7724 | 6530 | 0 | 0 | 0.00% | 0.00% | 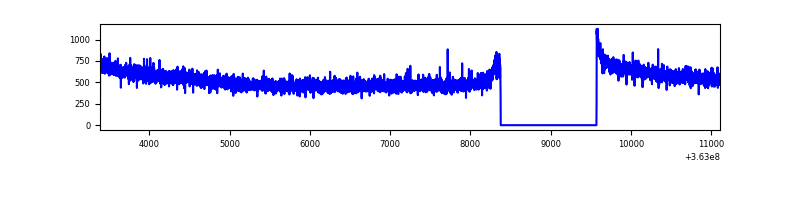 |
| B | 7725 | 6531 | 16 | 16 | 0.21% | 0.24% | 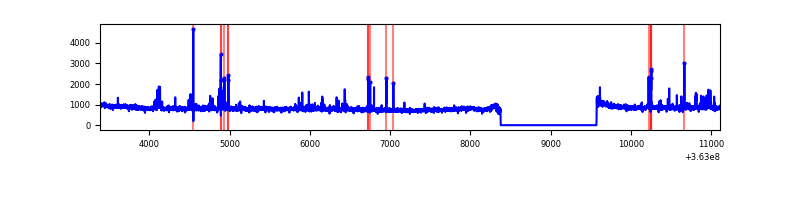 |
| C | 7725 | 6531 | 3 | 3 | 0.04% | 0.05% | 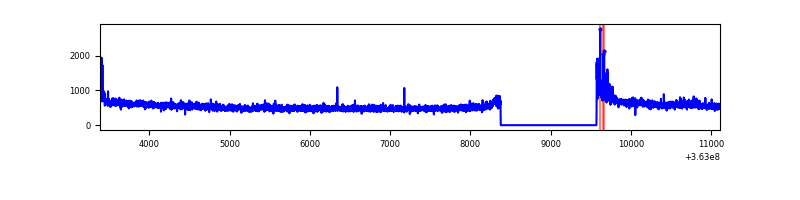 |
| D | 7725 | 6531 | 134 | 134 | 1.73% | 2.05% | 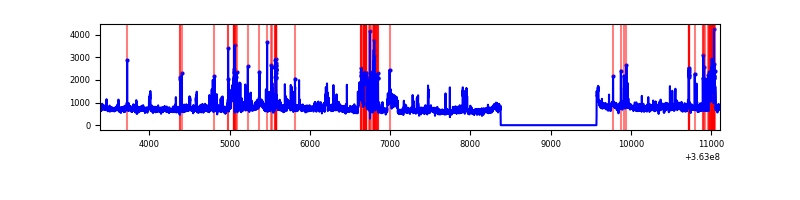 |
Top three noisy pixels from each quadrant. If the there are fewer than three noisy pixels in the level2.evt file, extra rows are filled as -1
| Pixel properties | Quadrant properties | ||||||
|---|---|---|---|---|---|---|---|
| Quadrant | DetID | PixID | Counts | Sigma | Mean | Median | Sigma |
| A | 13 | 254 | 12561 | 65.67 | 899 | 883 | 177.8 |
| A | 3 | 137 | 8165 | 40.95 | 899 | 883 | 177.8 |
| A | 0 | 226 | 7880 | 39.35 | 899 | 883 | 177.8 |
| B | 6 | 159 | 1781531 | 10879.31 | 871 | 851 | 163.7 |
| B | 0 | 190 | 117210 | 710.91 | 871 | 851 | 163.7 |
| B | 12 | 18 | 38113 | 227.66 | 871 | 851 | 163.7 |
| C | 14 | 238 | 137616 | 705.63 | 843 | 848 | 193.8 |
| C | 0 | 10 | 122223 | 626.21 | 843 | 848 | 193.8 |
| C | 2 | 114 | 15271 | 74.41 | 843 | 848 | 193.8 |
| D | 8 | 195 | 1704825 | 7564.45 | 857 | 839 | 225.3 |
| D | 13 | 249 | 158014 | 697.74 | 857 | 839 | 225.3 |
| D | 12 | 233 | 102150 | 449.75 | 857 | 839 | 225.3 |
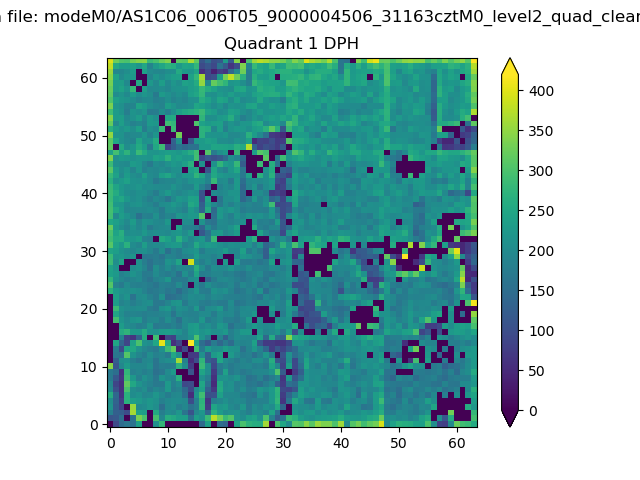
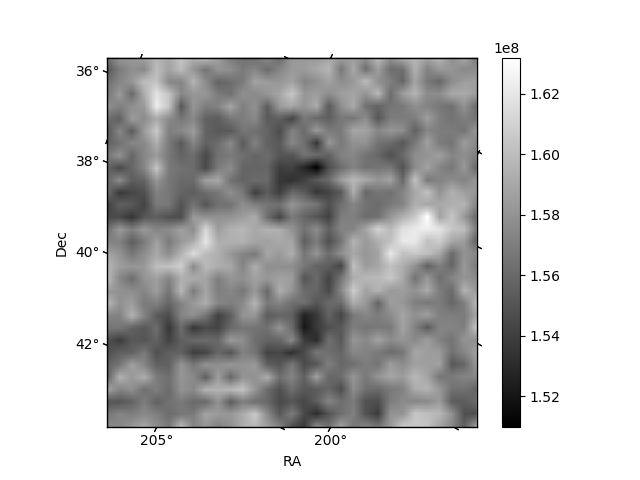
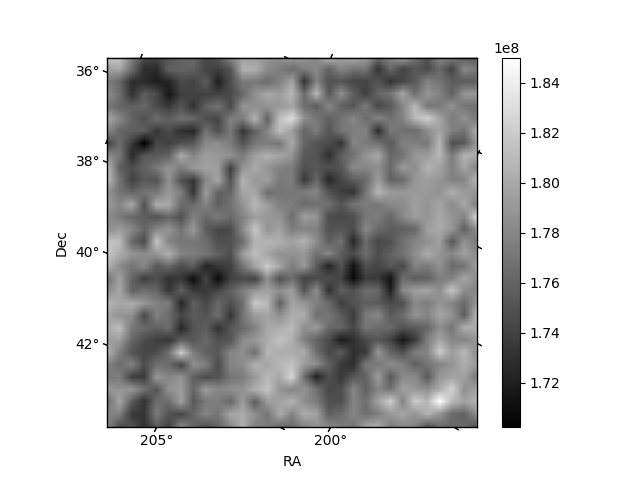
Histogram calculated using DETX and DETY for each event in the final _common_clean file
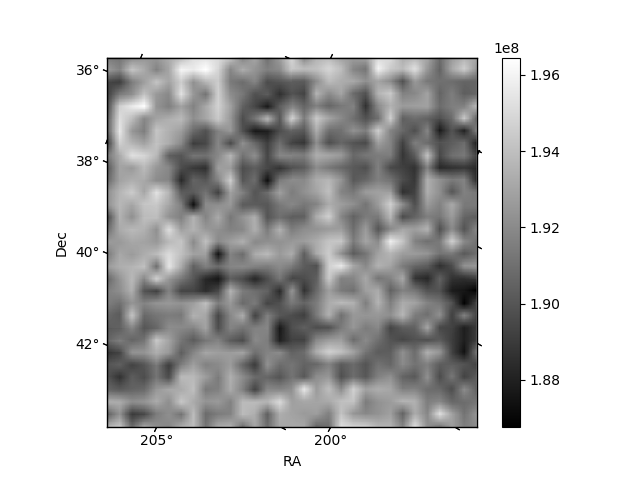
| Quadrant A |  |
 |
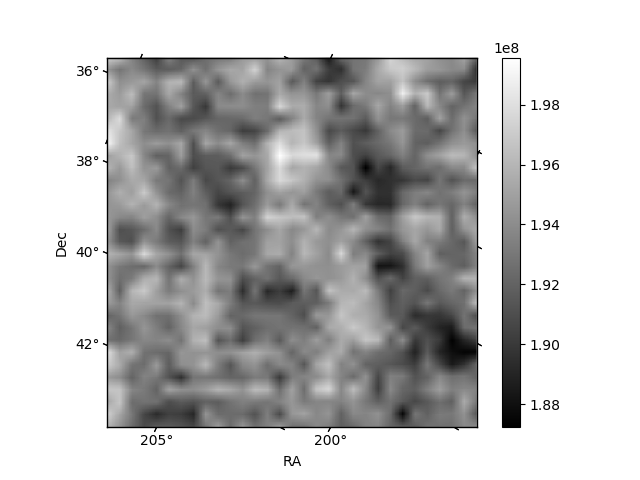
Quadrant B |
|---|---|---|---|
| Quadrant D | 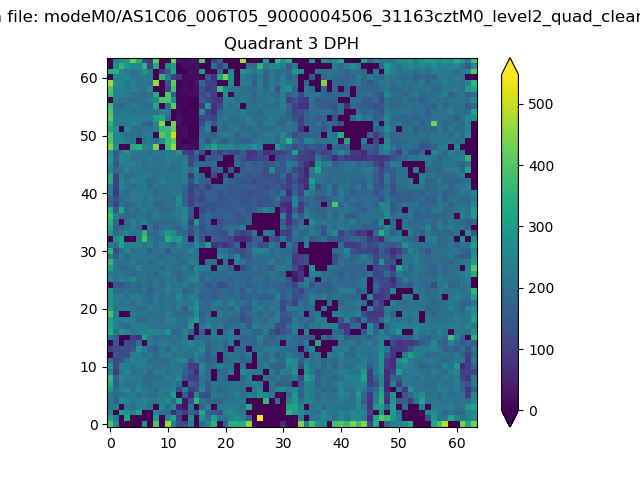 |
 |
Quadrant C |
| Plot type | Count rate plots | Images |
|---|---|---|
| Comparison with Poisson distribution Blue bars denote a histogram of data divided into 1 sec bins. Red curve is a Poisson curve with rate = median count rate of data. |
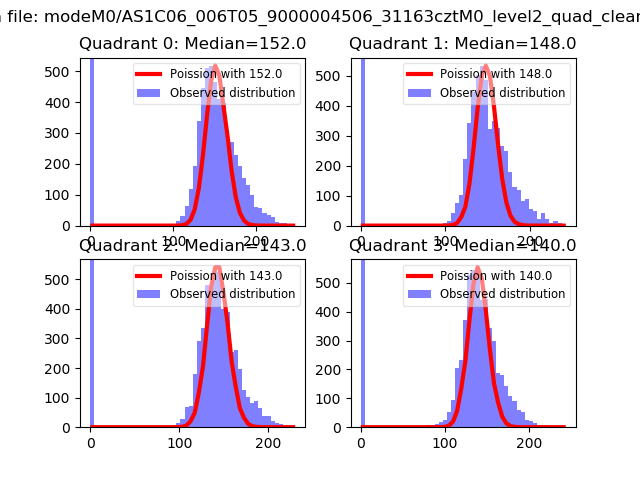 |
 |
| Quadrant-wise count rates Data is divided into 100 sec bins |
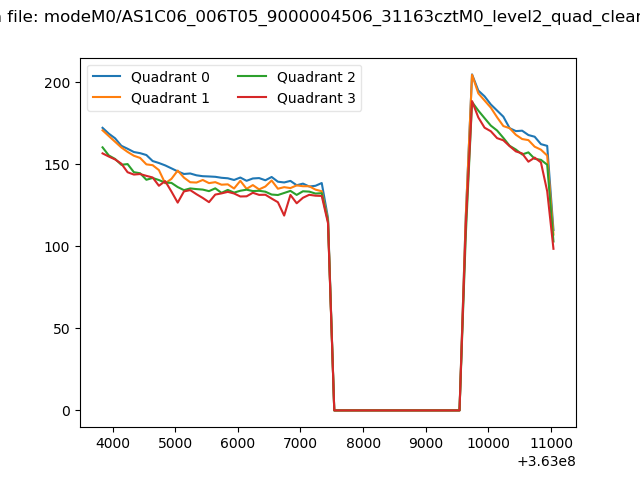 |
|
| Module-wise count rates for Quadrant A Data is divided into 100 sec bins |
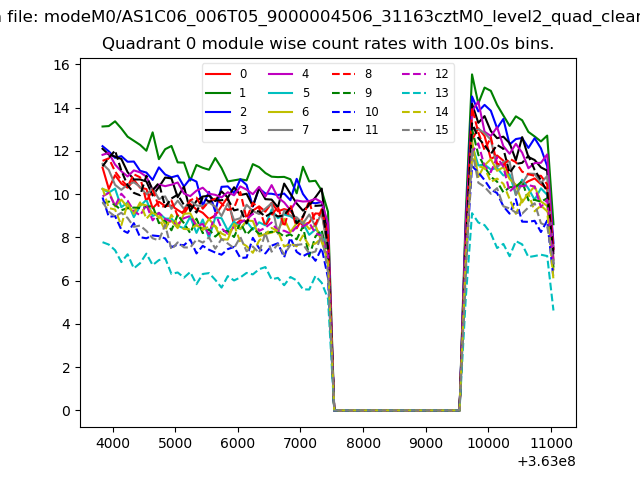 |
 |
| Module-wise count rates for Quadrant B Data is divided into 100 sec bins |
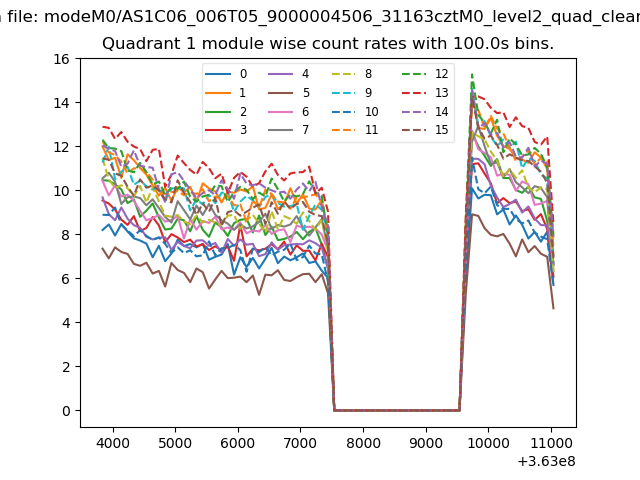 |
 |
| Module-wise count rates for Quadrant C Data is divided into 100 sec bins |
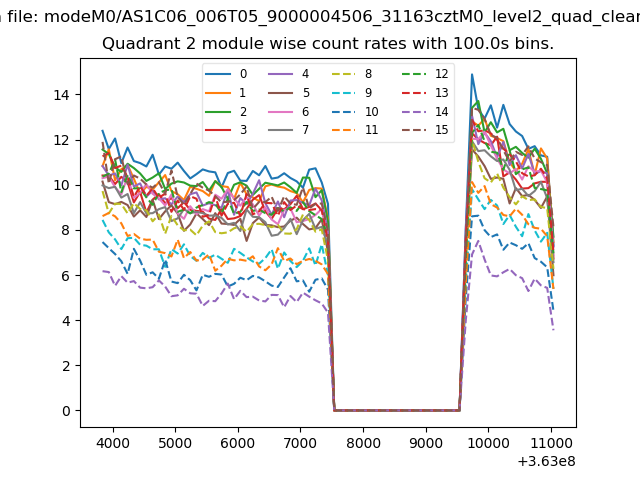 |
 |
| Module-wise count rates for Quadrant D Data is divided into 100 sec bins |
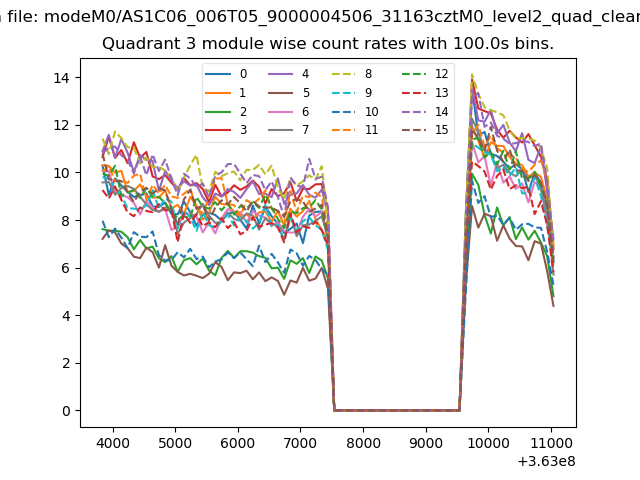 |
 |
| Parameter | Plot |
|---|---|
| CZT HV Monitor | 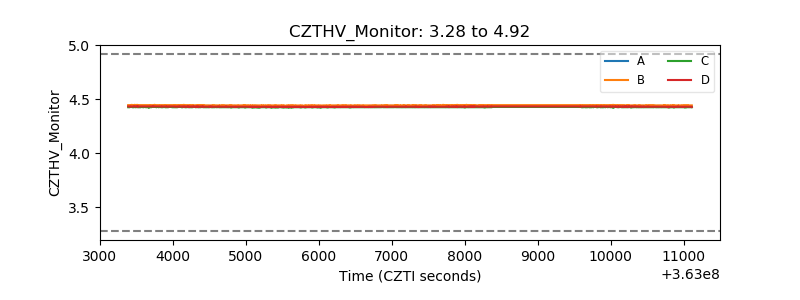 |
| D_VDD | 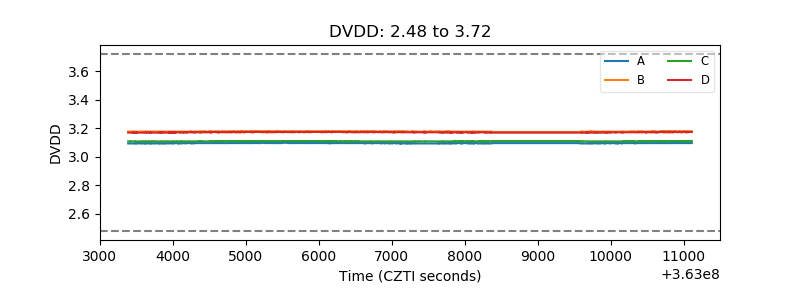 |
| Temperature 1 | 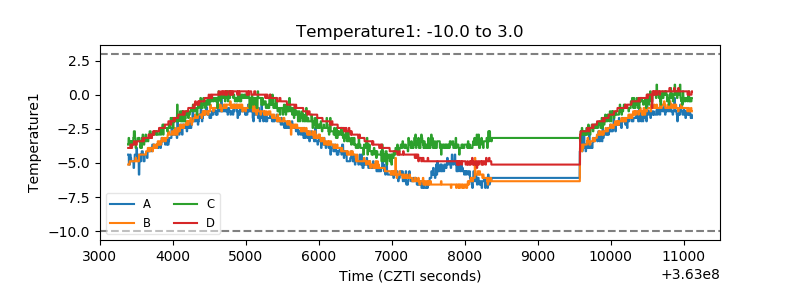 |
| Veto HV Monitor | 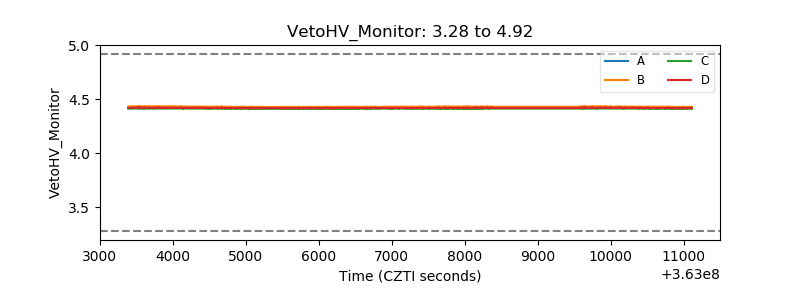 |
| Veto LLD | 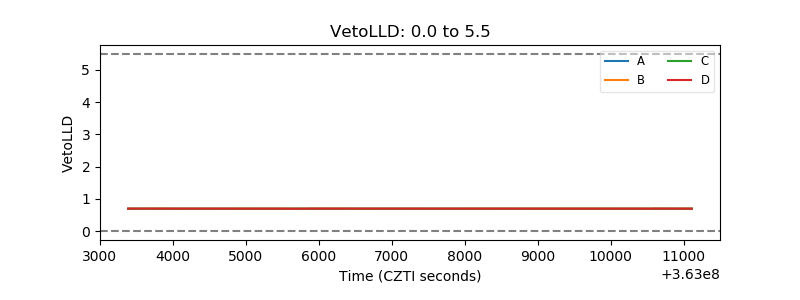 |
| Alpha Counter | 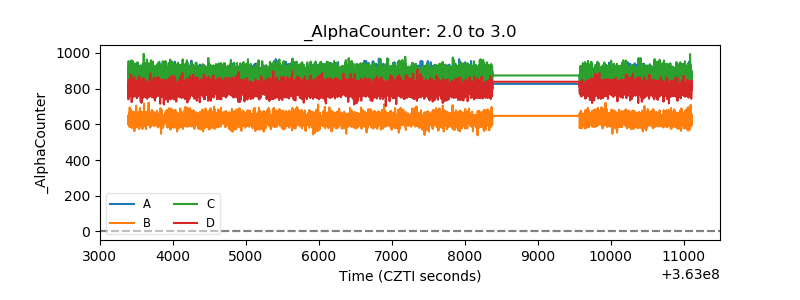 |
| _CPM_Rate | 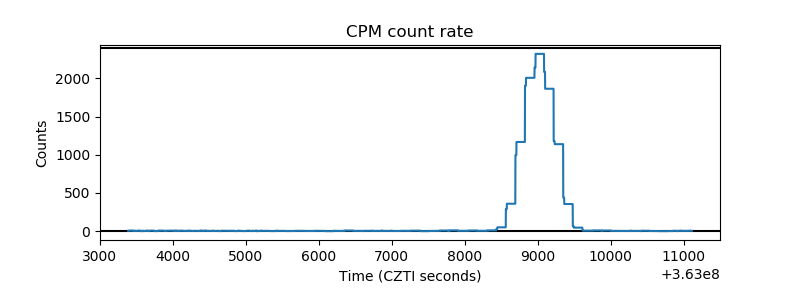 |
| CZT Counter | 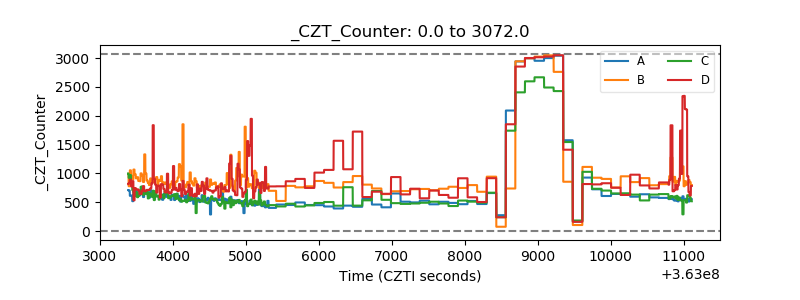 |
| +2.5 Volts monitor |  |
| +5 Volts monitor |  |
| _ROLL_ROT | 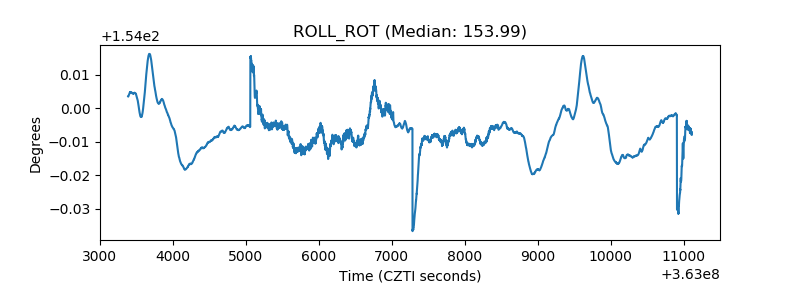 |
| _Roll_DEC | 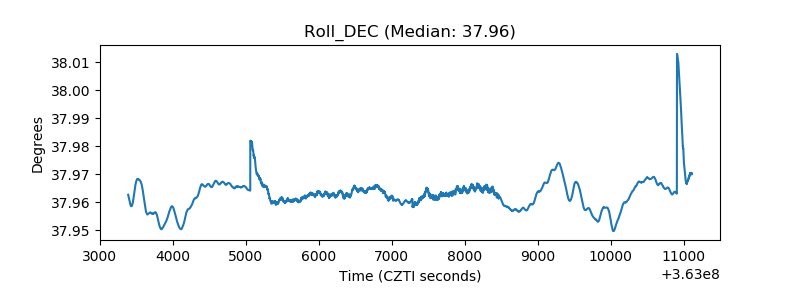 |
| _Roll_RA |  |
| Veto Counter | 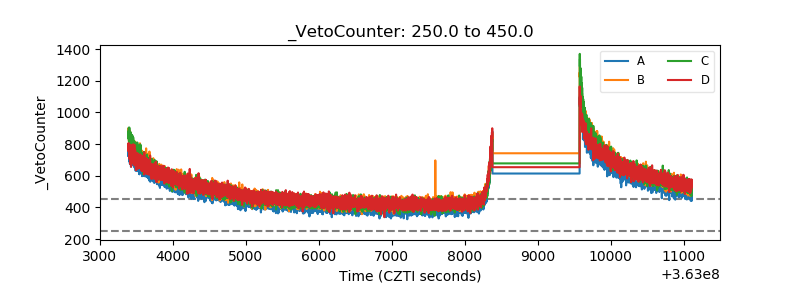 |