| Param | Original file | Final file |
|---|---|---|
| Filename | modeM0/AS1C06_006T05_9000004506_31164cztM0_level2.evt | modeM0/AS1C06_006T05_9000004506_31164cztM0_level2_quad_clean.evt |
| Size (bytes) | 180,146,880 | 42,240,960 |
| Size | 171.8 MB | 40.3 MB |
| Events in quadrant A | 988,398 | 299,792 |
| Events in quadrant B | 1,598,186 | 292,001 |
| Events in quadrant C | 1,043,315 | 280,045 |
| Events in quadrant D | 1,699,091 | 272,811 |
| Mode M0 | |||
|---|---|---|---|
| Quadrant | BADHDUFLAG | Total packets | Discarded packets |
| A | 0 | 4038 | 0 |
| B | 0 | 5799 | 0 |
| C | 0 | 4213 | 0 |
| D | 0 | 6410 | 0 |
| Mode SS | |||
|---|---|---|---|
| Quadrant | BADHDUFLAG | Total packets | Discarded packets |
| A | 0 | 38 | 0 |
| B | 0 | 38 | 0 |
| C | 0 | 38 | 0 |
| D | 0 | 38 | 0 |
| Quadrant | Total seconds | Saturated seconds | Saturation percentage |
|---|---|---|---|
| A | 1834 | 4 | 0.218103% |
| B | 1834 | 20 | 1.090513% |
| C | 1835 | 11 | 0.599455% |
| D | 1835 | 60 | 3.269755% |
Noise dominated data is calculated using 1-second bins in cleaned event files. If a bin has >2000 counts, and if more than 50% of those come from <1% of pixels, then it is considered to be noise-dominated and hence unusable.
| Quadrant | # 1 sec bins | Bins with >0 counts | Bins with >2000 counts | High rate bins dominated by noise | Noise dominated (total time) | Noise dominated (detector-on time) | Marked lightcurve |
|---|---|---|---|---|---|---|---|
| A | 1834 | 1834 | 0 | 0 | 0.00% | 0.00% | 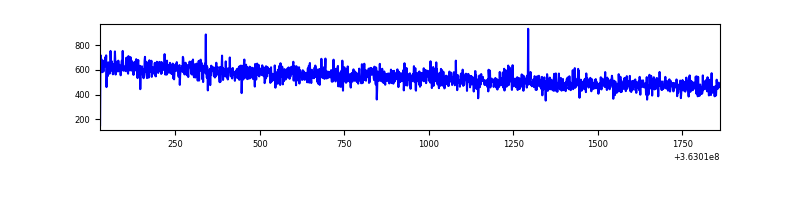 |
| B | 1834 | 1834 | 5 | 5 | 0.27% | 0.27% | 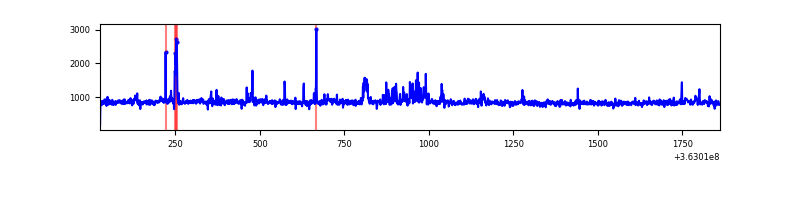 |
| C | 1835 | 1835 | 0 | 0 | 0.00% | 0.00% | 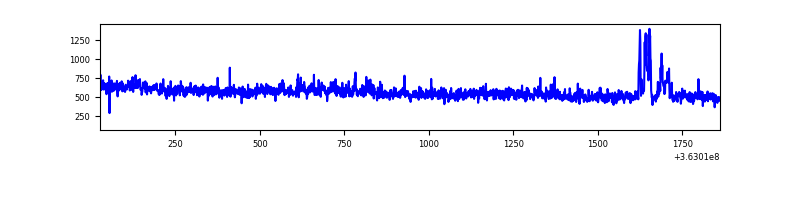 |
| D | 1835 | 1835 | 64 | 64 | 3.49% | 3.49% | 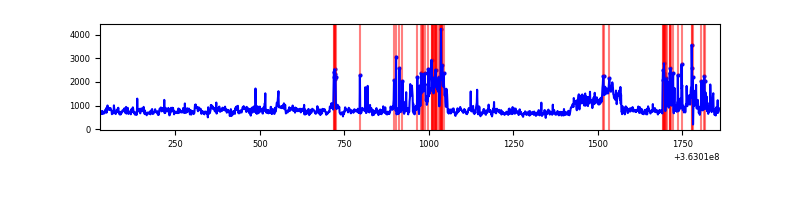 |
Top three noisy pixels from each quadrant. If the there are fewer than three noisy pixels in the level2.evt file, extra rows are filled as -1
| Pixel properties | Quadrant properties | ||||||
|---|---|---|---|---|---|---|---|
| Quadrant | DetID | PixID | Counts | Sigma | Mean | Median | Sigma |
| A | 13 | 254 | 3369 | 59.94 | 255 | 251 | 52.0 |
| A | 0 | 226 | 2276 | 38.93 | 255 | 251 | 52.0 |
| A | 3 | 137 | 2079 | 35.14 | 255 | 251 | 52.0 |
| B | 6 | 159 | 539489 | 11410.15 | 245 | 240 | 47.3 |
| B | 0 | 190 | 58120 | 1224.7 | 245 | 240 | 47.3 |
| B | 0 | 156 | 20846 | 436.01 | 245 | 240 | 47.3 |
| C | 0 | 10 | 54513 | 956.26 | 239 | 241 | 56.8 |
| C | 14 | 238 | 39266 | 687.61 | 239 | 241 | 56.8 |
| C | 2 | 114 | 4553 | 75.98 | 239 | 241 | 56.8 |
| D | 8 | 195 | 569166 | 9675.31 | 245 | 240 | 58.8 |
| D | 12 | 233 | 114385 | 1941.18 | 245 | 240 | 58.8 |
| D | 13 | 249 | 40640 | 687.05 | 245 | 240 | 58.8 |
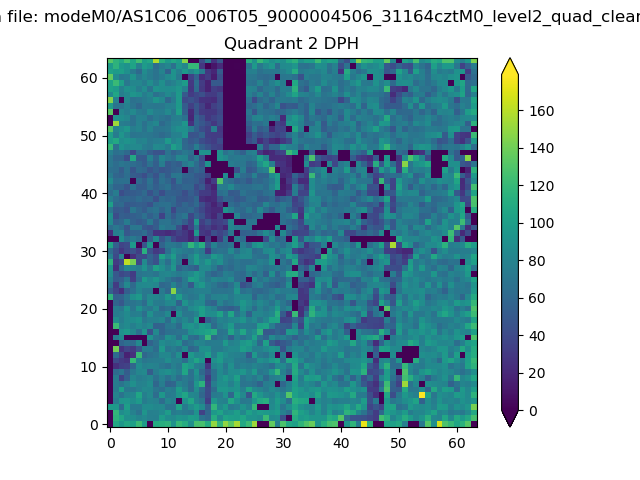
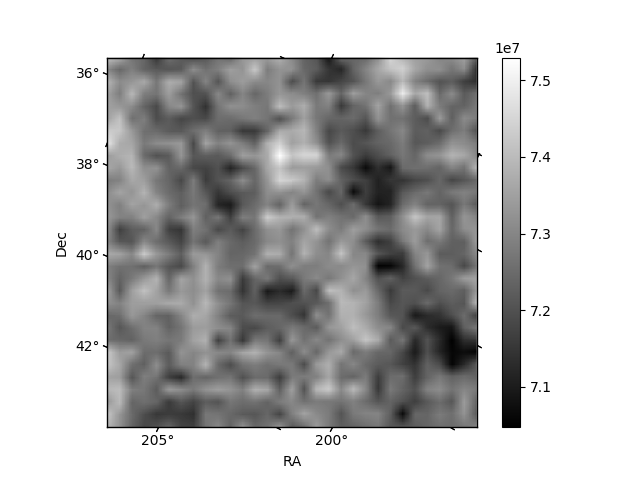
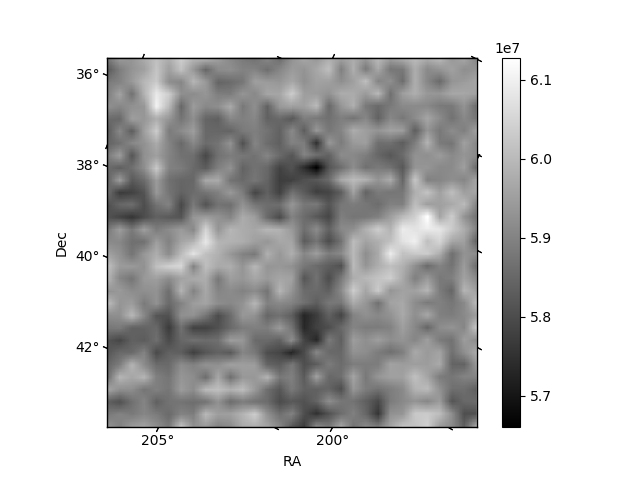
Histogram calculated using DETX and DETY for each event in the final _common_clean file
| Quadrant A | 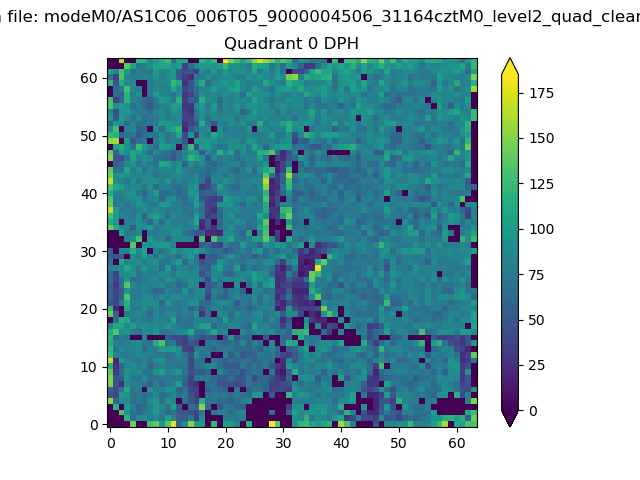 |
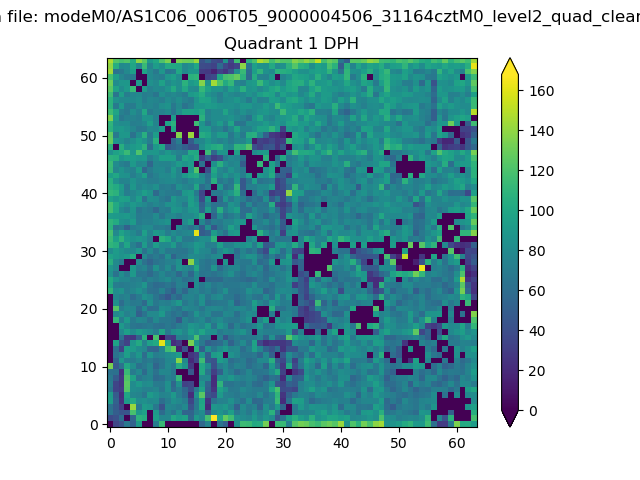 |
Quadrant B |
|---|---|---|---|
| Quadrant D | 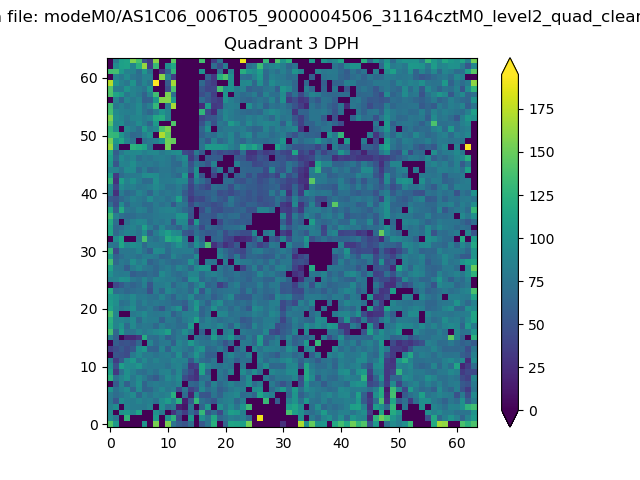 |
 |
Quadrant C |
| Plot type | Count rate plots | Images |
|---|---|---|
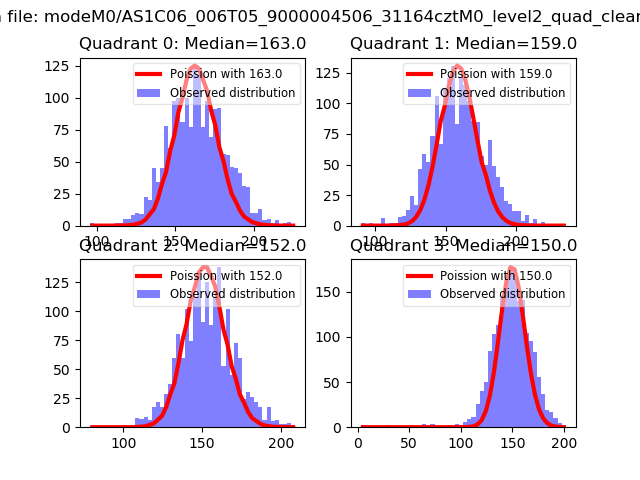
| Comparison with Poisson distribution Blue bars denote a histogram of data divided into 1 sec bins. Red curve is a Poisson curve with rate = median count rate of data. |
 |
 |
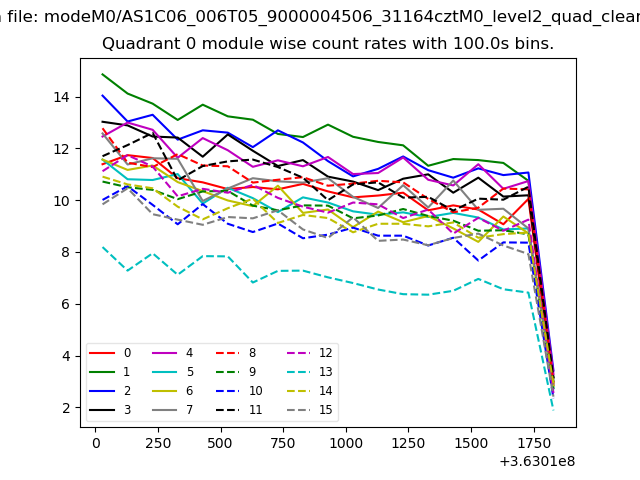
| Quadrant-wise count rates Data is divided into 100 sec bins |
 |
|
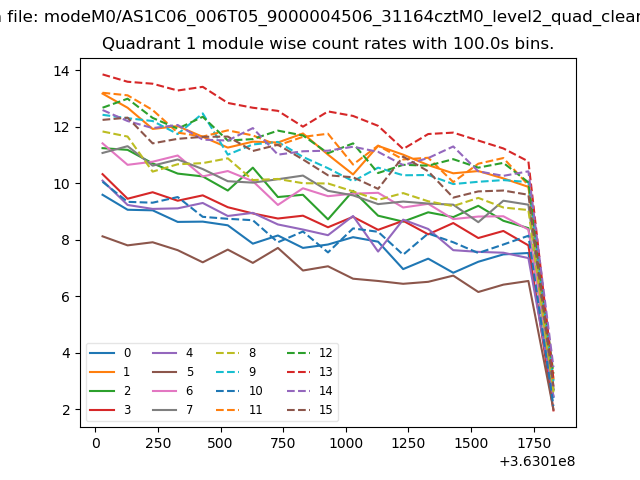
| Module-wise count rates for Quadrant A Data is divided into 100 sec bins |
 |
 |
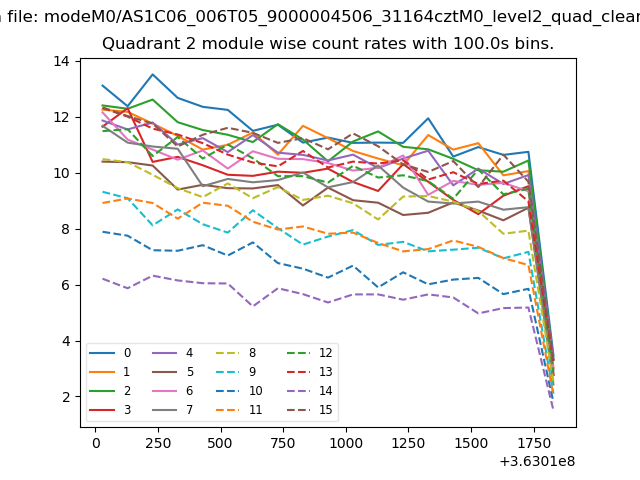
| Module-wise count rates for Quadrant B Data is divided into 100 sec bins |
 |
 |
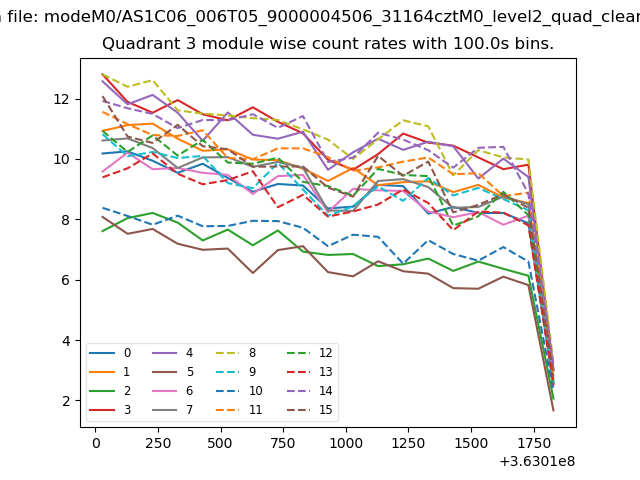
| Module-wise count rates for Quadrant C Data is divided into 100 sec bins |
 |
 |
| Module-wise count rates for Quadrant D Data is divided into 100 sec bins |
 |
 |
| Parameter | Plot |
|---|---|
| CZT HV Monitor |  |
| D_VDD | 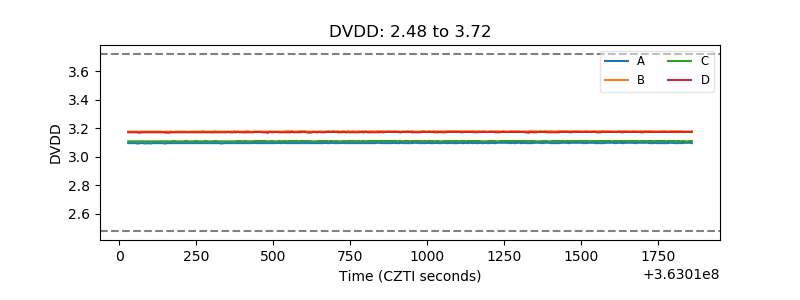 |
| Temperature 1 | 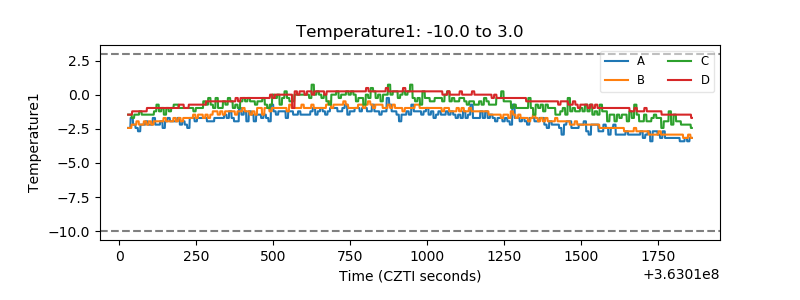 |
| Veto HV Monitor | 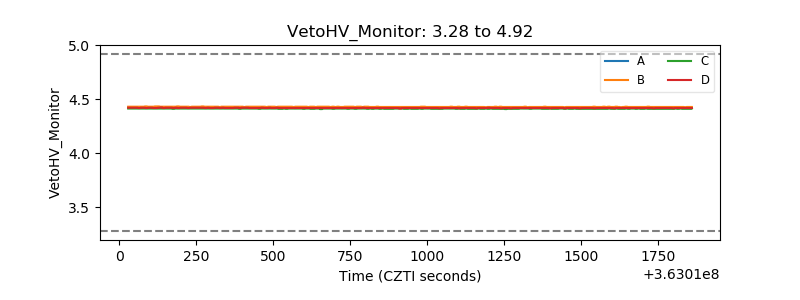 |
| Veto LLD | 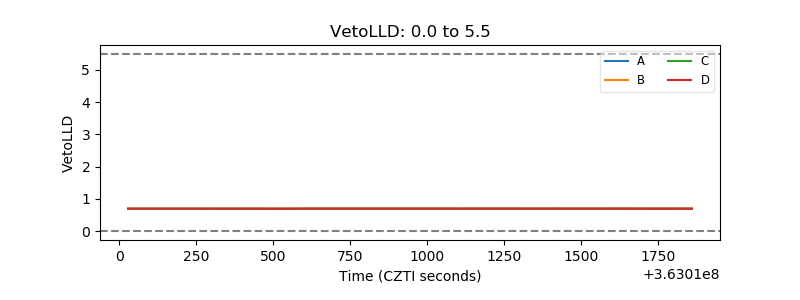 |
| Alpha Counter | 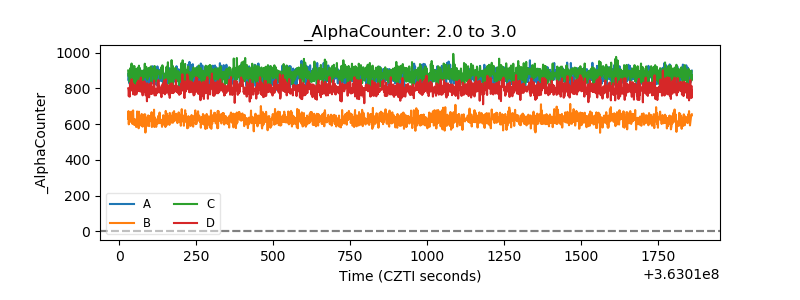 |
| _CPM_Rate | 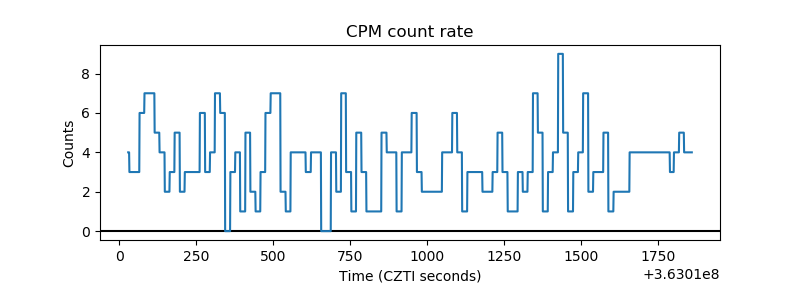 |
| CZT Counter | 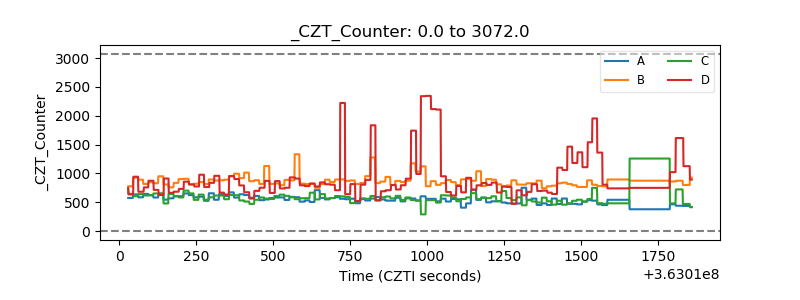 |
| +2.5 Volts monitor |  |
| +5 Volts monitor |  |
| _ROLL_ROT | 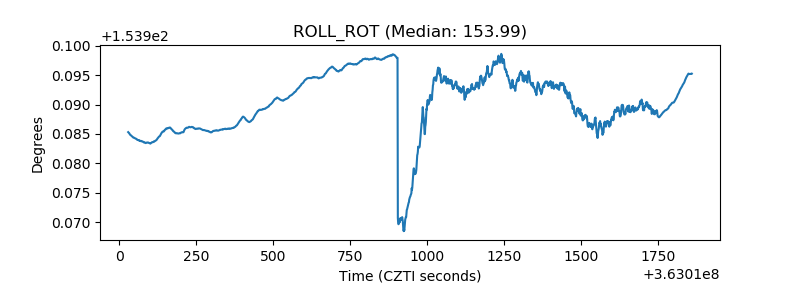 |
| _Roll_DEC | 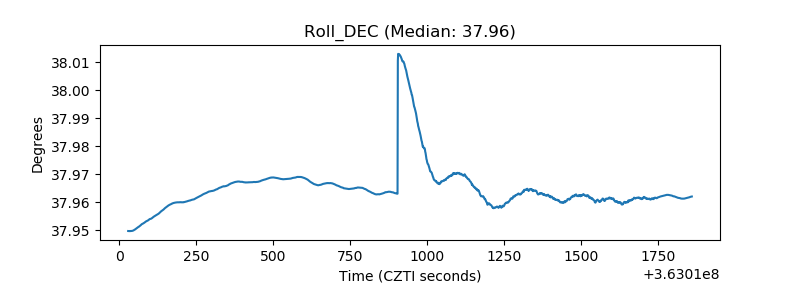 |
| _Roll_RA | 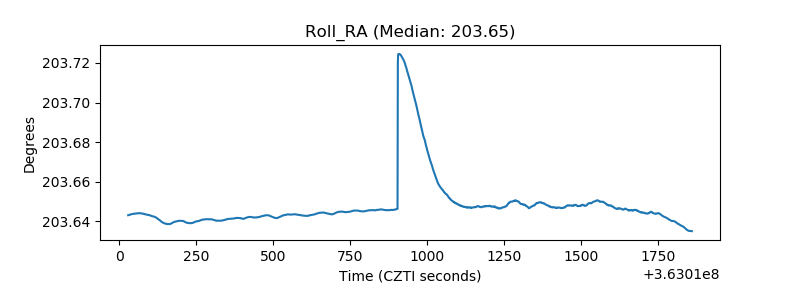 |
| Veto Counter | 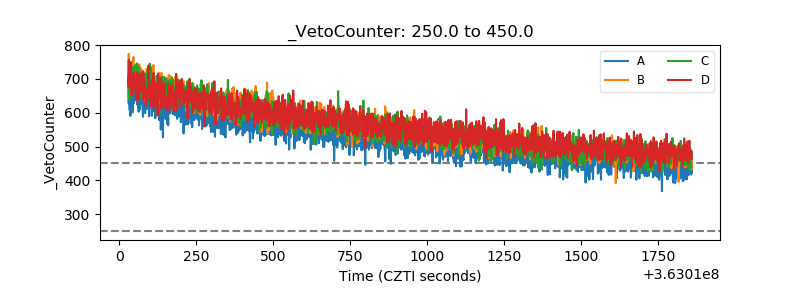 |