| Param | Original file | Final file |
|---|---|---|
| Filename | modeM0/AS1C06_010T01_9000004504cztM0_level2.fits | modeM0/AS1C06_010T01_9000004504cztM0_level2_quad_clean.evt |
| Size (bytes) | 141,471,360 | 139,829,760 |
| Size | 134.9 MB | 133.4 MB |
| Events in quadrant A | 880,784 | 865,346 |
| Events in quadrant B | 807,128 | 839,497 |
| Events in quadrant C | 840,876 | 805,132 |
| Events in quadrant D | 718,804 | 687,399 |
| Mode M9 | |||
|---|---|---|---|
| Quadrant | BADHDUFLAG | Total packets | Discarded packets |
| A | 0 | 25 | 0 |
| B | 0 | 25 | 0 |
| C | 0 | 25 | 0 |
| D | 0 | 25 | 0 |
| Mode SS | |||
|---|---|---|---|
| Quadrant | BADHDUFLAG | Total packets | Discarded packets |
| A | 0 | 306 | 0 |
| B | 0 | 306 | 0 |
| C | 0 | 306 | 0 |
| D | 0 | 306 | 0 |
| Mode M0 | |||
|---|---|---|---|
| Quadrant | BADHDUFLAG | Total packets | Discarded packets |
| A | 0 | 30511 | 0 |
| B | 0 | 47032 | 0 |
| C | 0 | 31037 | 0 |
| D | 0 | 58438 | 0 |
| Quadrant | Total seconds | Saturated seconds | Saturation percentage |
|---|---|---|---|
| A | 15020 | 65 | 0.432756% |
| B | 15020 | 350 | 2.330226% |
| C | 15020 | 150 | 0.998668% |
| D | 15020 | 1203 | 8.009321% |
Noise dominated data is calculated using 1-second bins in cleaned event files. If a bin has >2000 counts, and if more than 50% of those come from <1% of pixels, then it is considered to be noise-dominated and hence unusable.
| Quadrant | # 1 sec bins | Bins with >0 counts | Bins with >2000 counts | High rate bins dominated by noise | Noise dominated (total time) | Noise dominated (detector-on time) | Marked lightcurve |
|---|---|---|---|---|---|---|---|
| A | 16864 | 15019 | 0 | 0 | 0.00% | 0.00% |  |
| B | 16864 | 15017 | 0 | 0 | 0.00% | 0.00% |  |
| C | 16864 | 15019 | 0 | 0 | 0.00% | 0.00% | 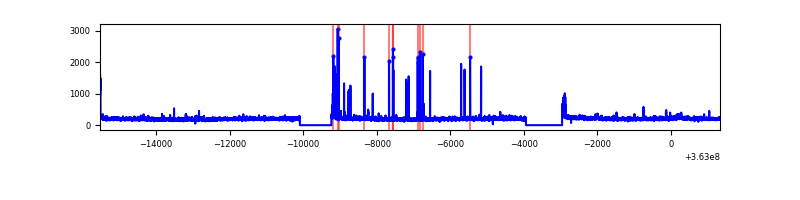 |
| D | 16864 | 15007 | 0 | 0 | 0.00% | 0.00% | 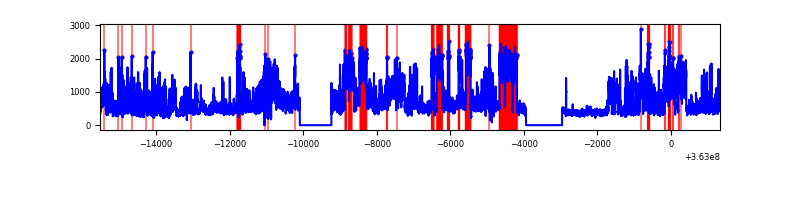 |
Top three noisy pixels from each quadrant. If the there are fewer than three noisy pixels in the level2.evt file, extra rows are filled as -1
| Pixel properties | Quadrant properties | ||||||
|---|---|---|---|---|---|---|---|
| Quadrant | DetID | PixID | Counts | Sigma | Mean | Median | Sigma |
| A | 0 | 29 | 853 | 10.93 | 229 | 216 | 58.3 |
| A | 7 | 110 | 691 | 8.15 | 229 | 216 | 58.3 |
| A | 9 | 19 | 651 | 7.47 | 229 | 216 | 58.3 |
| B | 2 | 9 | 622 | 9.55 | 214 | 206 | 43.5 |
| B | 3 | 80 | 568 | 8.31 | 214 | 206 | 43.5 |
| B | 5 | 128 | 554 | 7.99 | 214 | 206 | 43.5 |
| C | 3 | 202 | 639 | 7.41 | 222 | 208 | 58.2 |
| C | 12 | 241 | 603 | 6.79 | 222 | 208 | 58.2 |
| C | 3 | 187 | 592 | 6.6 | 222 | 208 | 58.2 |
| D | 15 | 46 | 558 | 6.62 | 205 | 187 | 56.0 |
| D | 4 | 246 | 542 | 6.34 | 205 | 187 | 56.0 |
| D | 6 | 38 | 532 | 6.16 | 205 | 187 | 56.0 |
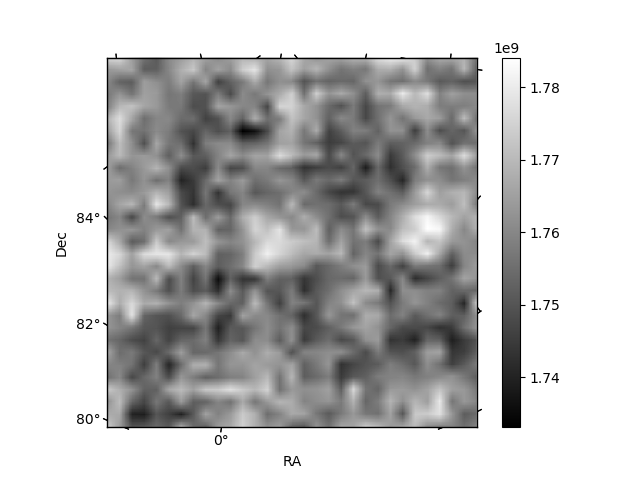
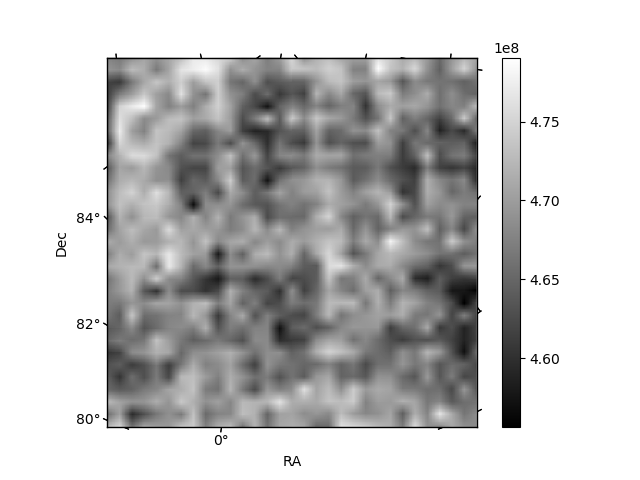
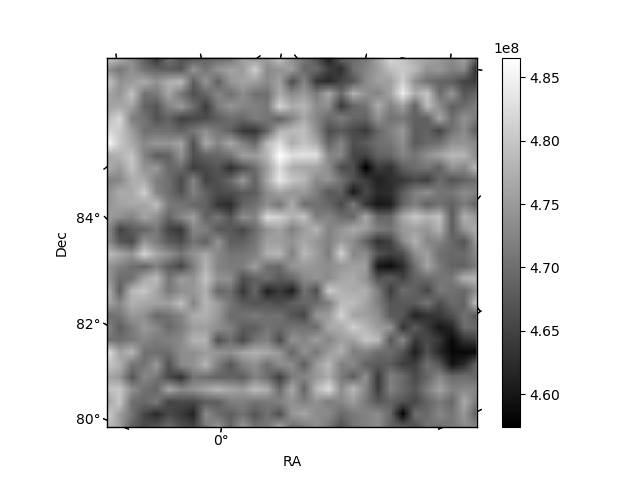
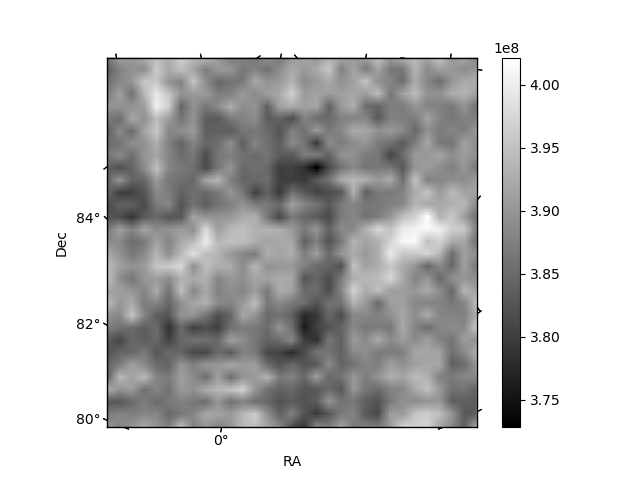
Histogram calculated using DETX and DETY for each event in the final _common_clean file
| Quadrant A |  |
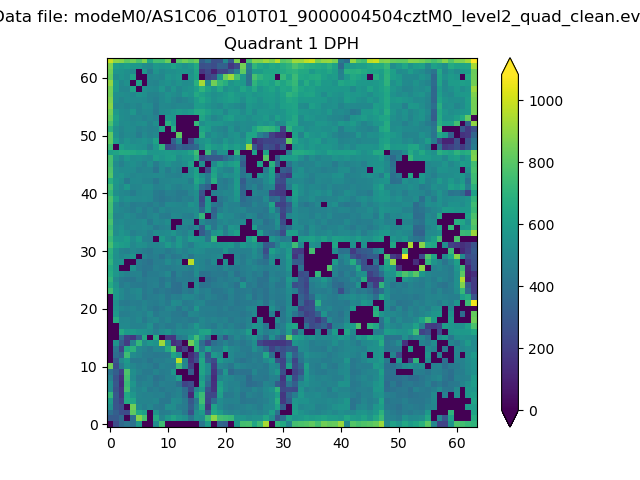 |
Quadrant B |
|---|---|---|---|
| Quadrant D | 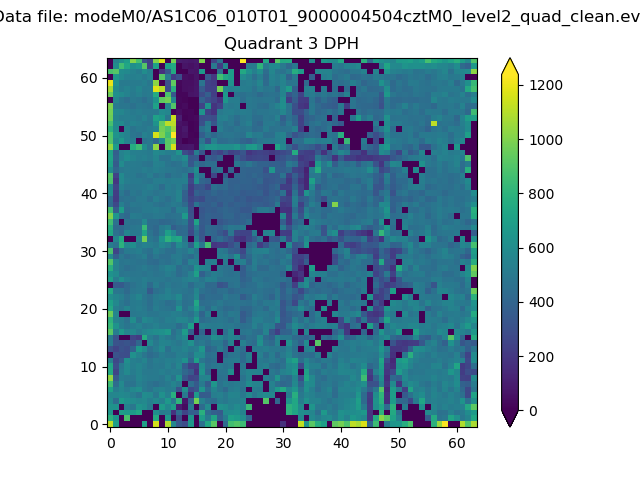 |
 |
Quadrant C |
| Plot type | Count rate plots | Images |
|---|---|---|
| Comparison with Poisson distribution Blue bars denote a histogram of data divided into 1 sec bins. Red curve is a Poisson curve with rate = median count rate of data. |
 |
 |
| Quadrant-wise count rates Data is divided into 100 sec bins |
 |
|
| Module-wise count rates for Quadrant A Data is divided into 100 sec bins |
 |
 |
| Module-wise count rates for Quadrant B Data is divided into 100 sec bins |
 |
 |
| Module-wise count rates for Quadrant C Data is divided into 100 sec bins |
 |
 |
| Module-wise count rates for Quadrant D Data is divided into 100 sec bins |
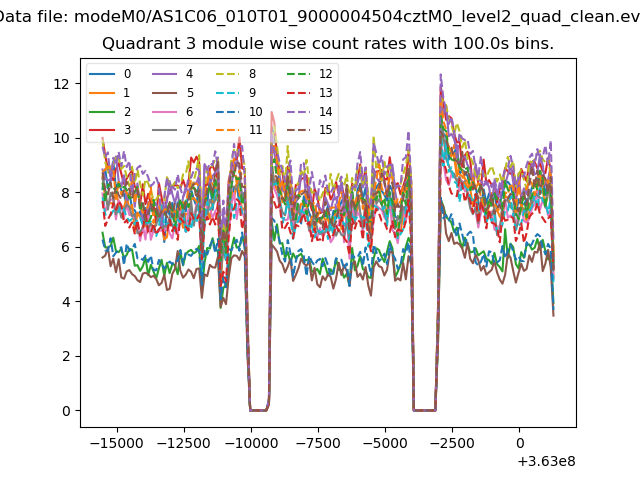 |
 |
| Parameter | Plot |
|---|---|
| CZT HV Monitor |  |
| D_VDD |  |
| Temperature 1 |  |
| Veto HV Monitor |  |
| Veto LLD |  |
| Alpha Counter |  |
| _CPM_Rate | 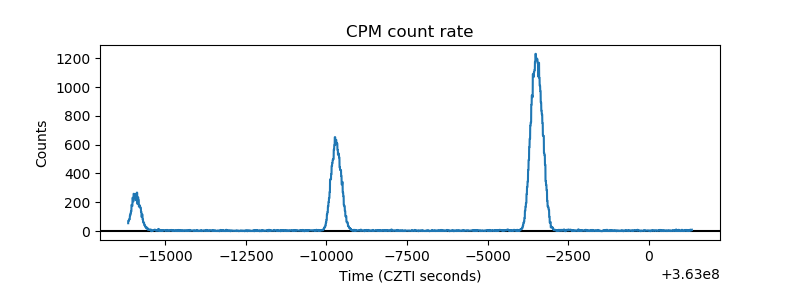 |
| CZT Counter |  |
| +2.5 Volts monitor | 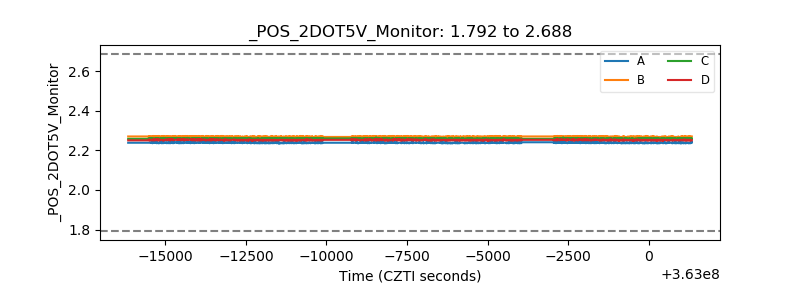 |
| +5 Volts monitor | 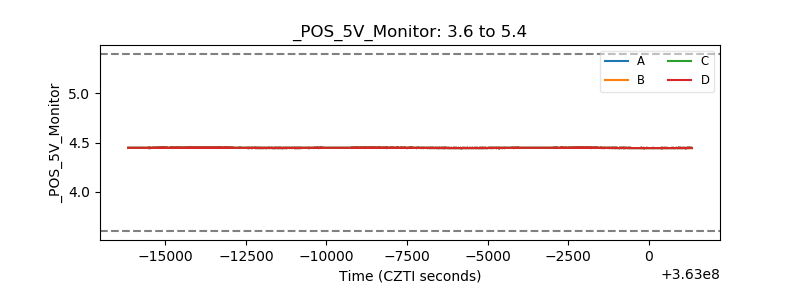 |
| _ROLL_ROT | 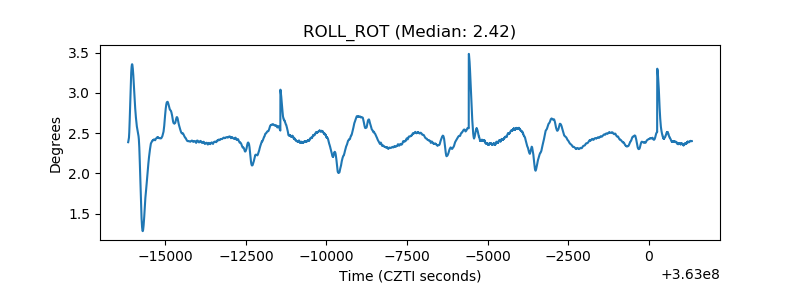 |
| _Roll_DEC |  |
| _Roll_RA |  |
| Veto Counter | 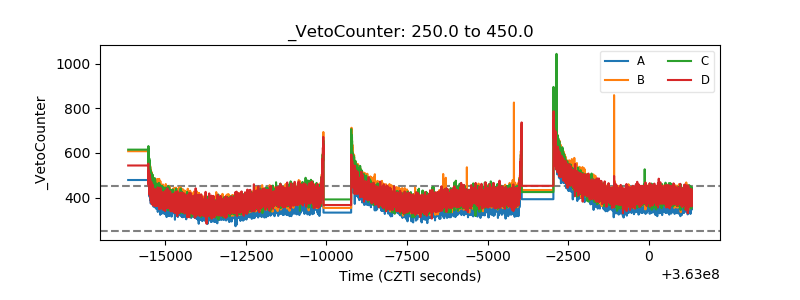 |