| Param | Original file | Final file |
|---|---|---|
| Filename | modeM0/AS1C06_010T01_9000004504_31159cztM0_level2.evt | modeM0/AS1C06_010T01_9000004504_31159cztM0_level2_quad_clean.evt |
| Size (bytes) | 655,718,400 | 128,776,320 |
| Size | 625.3 MB | 122.8 MB |
| Events in quadrant A | 3,182,809 | 887,171 |
| Events in quadrant B | 5,719,254 | 863,305 |
| Events in quadrant C | 3,313,571 | 853,013 |
| Events in quadrant D | 7,174,626 | 813,814 |
| Mode M9 | |||
|---|---|---|---|
| Quadrant | BADHDUFLAG | Total packets | Discarded packets |
| A | 0 | 16 | 0 |
| B | 0 | 16 | 0 |
| C | 0 | 16 | 0 |
| D | 0 | 16 | 0 |
| Mode SS | |||
|---|---|---|---|
| Quadrant | BADHDUFLAG | Total packets | Discarded packets |
| A | 0 | 142 | 0 |
| B | 0 | 142 | 0 |
| C | 0 | 142 | 0 |
| D | 0 | 142 | 0 |
| Mode M0 | |||
|---|---|---|---|
| Quadrant | BADHDUFLAG | Total packets | Discarded packets |
| A | 0 | 14034 | 2 |
| B | 0 | 22216 | 2 |
| C | 0 | 14326 | 2 |
| D | 0 | 26401 | 2 |
| Quadrant | Total seconds | Saturated seconds | Saturation percentage |
|---|---|---|---|
| A | 6932 | 24 | 0.346220% |
| B | 6932 | 249 | 3.592037% |
| C | 6932 | 65 | 0.937680% |
| D | 6932 | 490 | 7.068667% |
Noise dominated data is calculated using 1-second bins in cleaned event files. If a bin has >2000 counts, and if more than 50% of those come from <1% of pixels, then it is considered to be noise-dominated and hence unusable.
| Quadrant | # 1 sec bins | Bins with >0 counts | Bins with >2000 counts | High rate bins dominated by noise | Noise dominated (total time) | Noise dominated (detector-on time) | Marked lightcurve |
|---|---|---|---|---|---|---|---|
| A | 7792 | 6933 | 0 | 0 | 0.00% | 0.00% | 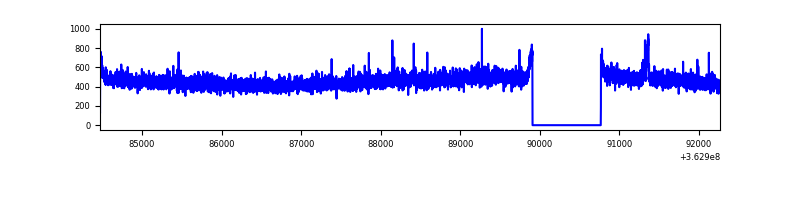 |
| B | 7792 | 6933 | 87 | 87 | 1.12% | 1.25% | 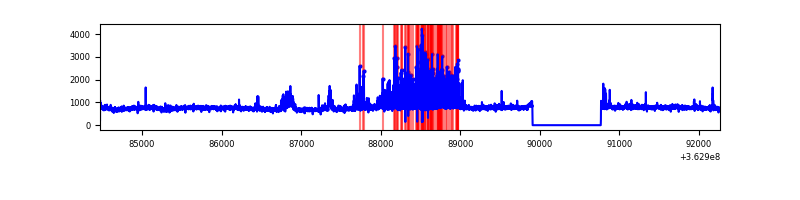 |
| C | 7792 | 6933 | 9 | 9 | 0.12% | 0.13% | 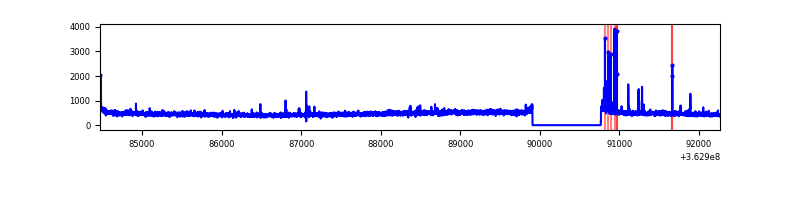 |
| D | 7792 | 6933 | 490 | 490 | 6.29% | 7.07% | 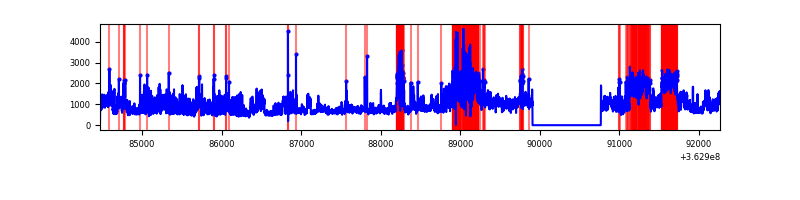 |
Top three noisy pixels from each quadrant. If the there are fewer than three noisy pixels in the level2.evt file, extra rows are filled as -1
| Pixel properties | Quadrant properties | ||||||
|---|---|---|---|---|---|---|---|
| Quadrant | DetID | PixID | Counts | Sigma | Mean | Median | Sigma |
| A | 3 | 247 | 15766 | 91.9 | 818 | 801 | 162.8 |
| A | 13 | 254 | 12395 | 71.2 | 818 | 801 | 162.8 |
| A | 11 | 47 | 11115 | 63.34 | 818 | 801 | 162.8 |
| B | 6 | 159 | 1923711 | 12409.22 | 800 | 779 | 155.0 |
| B | 12 | 18 | 468481 | 3018.21 | 800 | 779 | 155.0 |
| B | 0 | 190 | 65520 | 417.79 | 800 | 779 | 155.0 |
| C | 14 | 238 | 132813 | 715.62 | 780 | 782 | 184.5 |
| C | 0 | 10 | 83043 | 445.86 | 780 | 782 | 184.5 |
| C | 3 | 233 | 18223 | 94.53 | 780 | 782 | 184.5 |
| D | 8 | 195 | 2270413 | 11329.16 | 764 | 745 | 200.3 |
| D | 13 | 174 | 1579858 | 7882.22 | 764 | 745 | 200.3 |
| D | 13 | 249 | 240022 | 1194.36 | 764 | 745 | 200.3 |
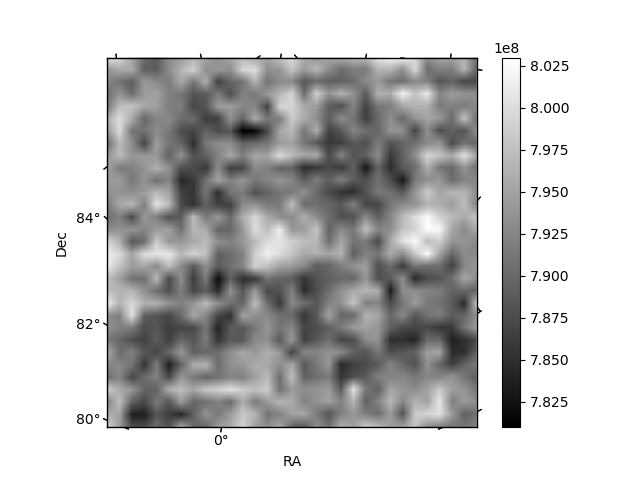
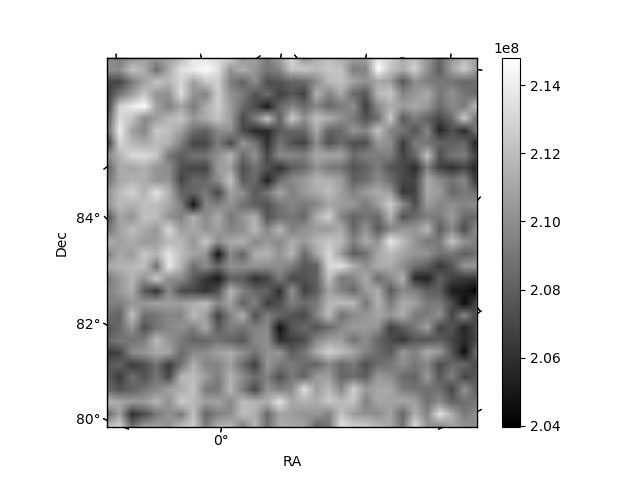
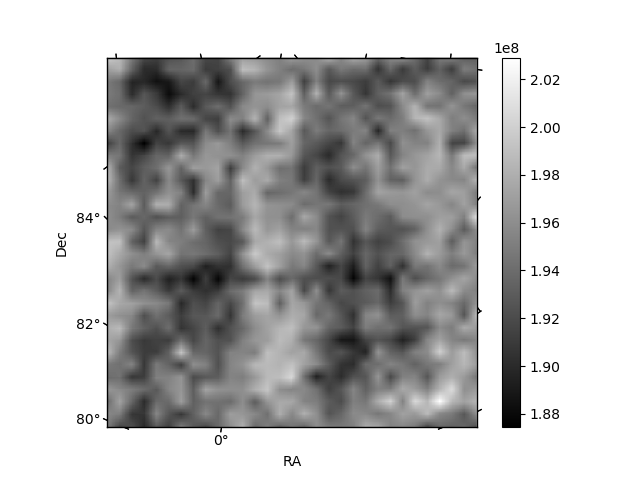
Histogram calculated using DETX and DETY for each event in the final _common_clean file
| Quadrant A | 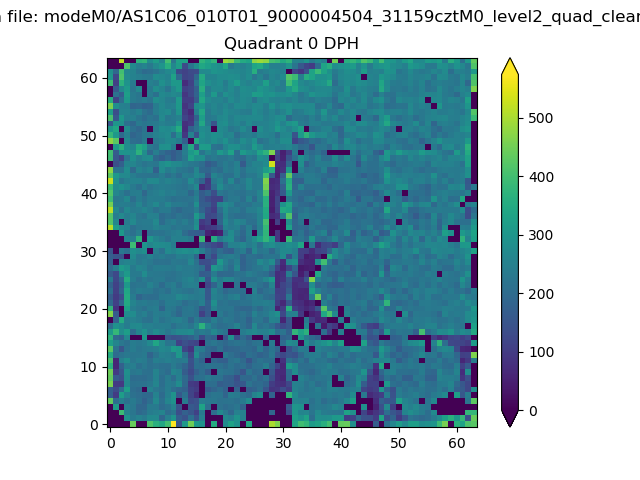 |
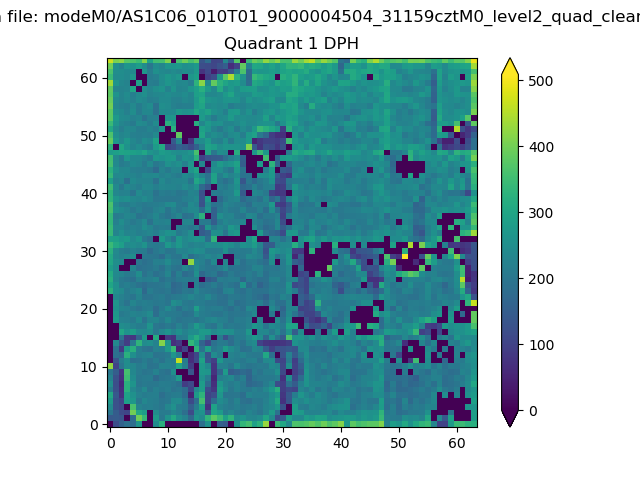 |
Quadrant B |
|---|---|---|---|
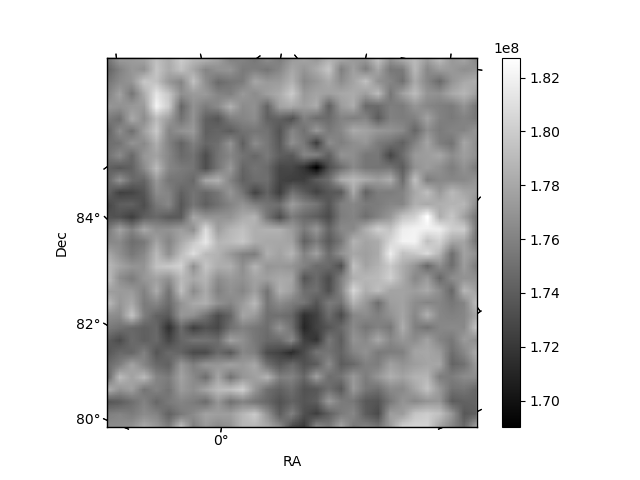
| Quadrant D | 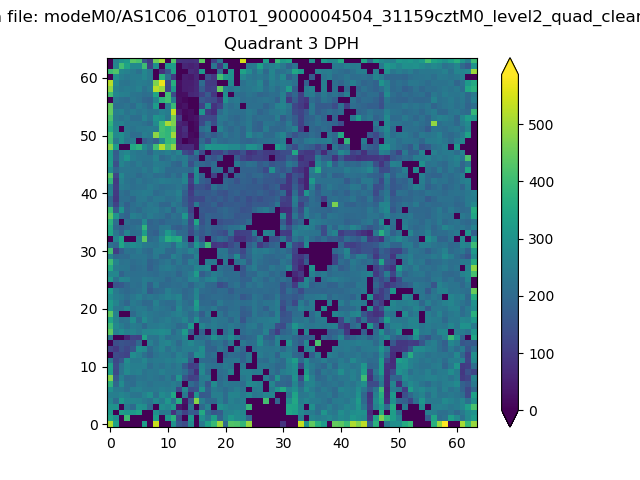 |
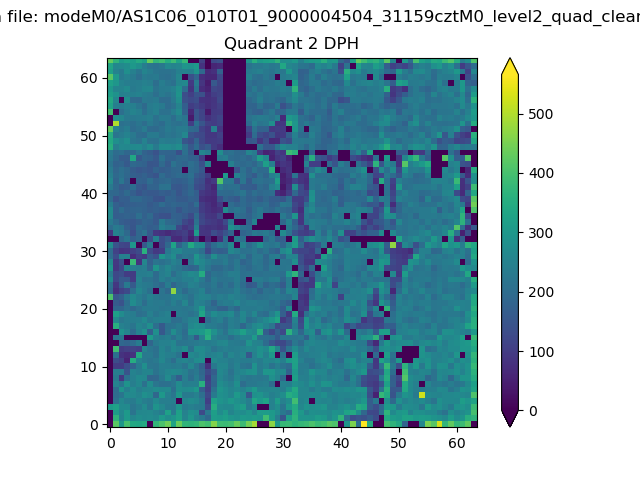 |
Quadrant C |
| Plot type | Count rate plots | Images |
|---|---|---|
| Comparison with Poisson distribution Blue bars denote a histogram of data divided into 1 sec bins. Red curve is a Poisson curve with rate = median count rate of data. |
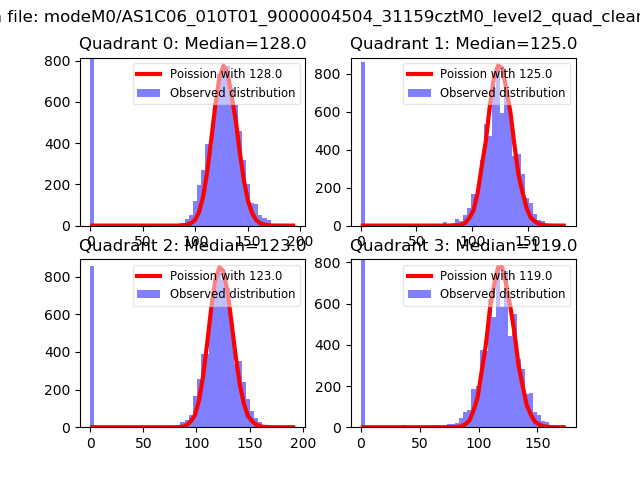 |
 |
| Quadrant-wise count rates Data is divided into 100 sec bins |
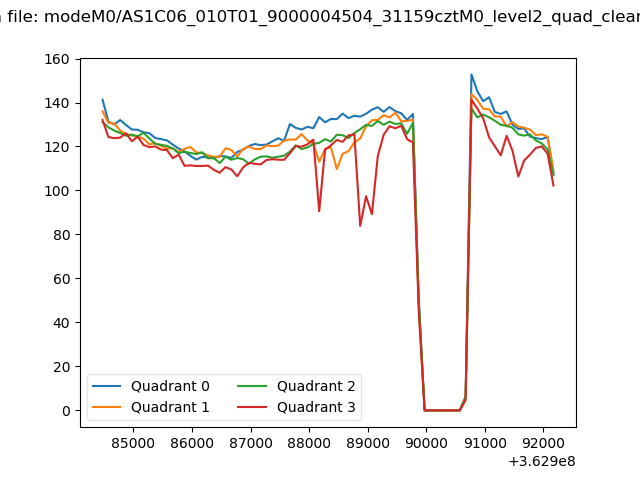 |
|
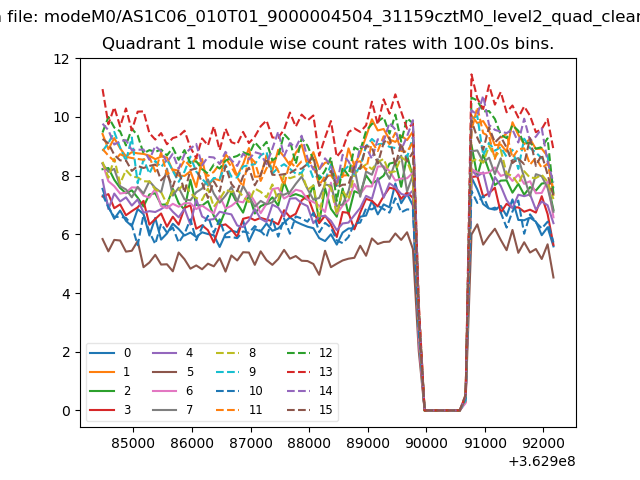
| Module-wise count rates for Quadrant A Data is divided into 100 sec bins |
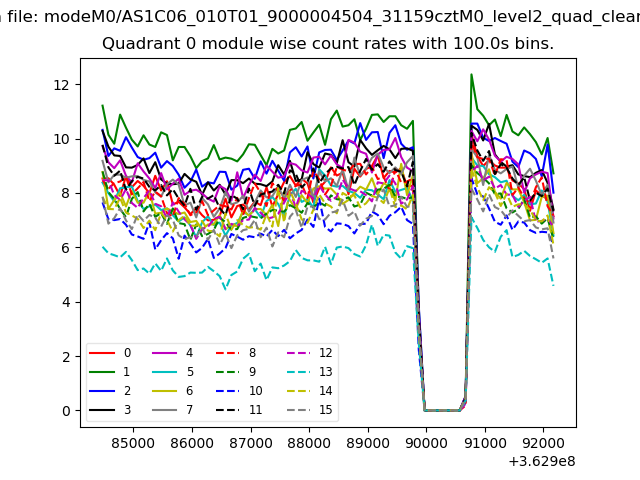 |
 |
| Module-wise count rates for Quadrant B Data is divided into 100 sec bins |
 |
 |
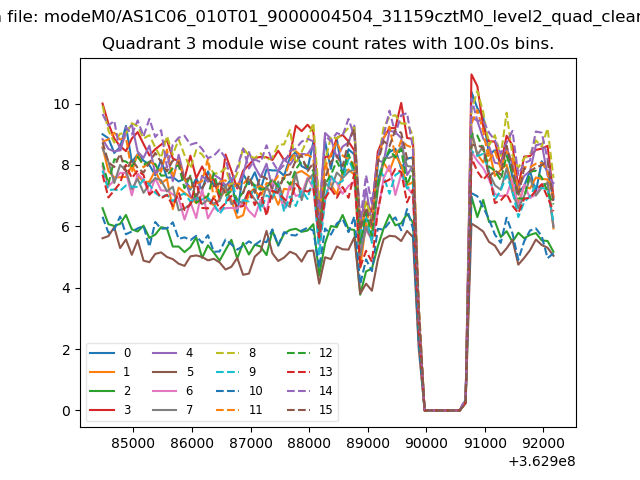
| Module-wise count rates for Quadrant C Data is divided into 100 sec bins |
 |
 |
| Module-wise count rates for Quadrant D Data is divided into 100 sec bins |
 |
 |
| Parameter | Plot |
|---|---|
| CZT HV Monitor | 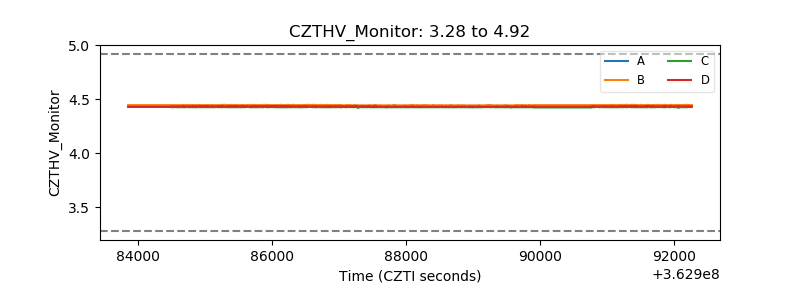 |
| D_VDD | 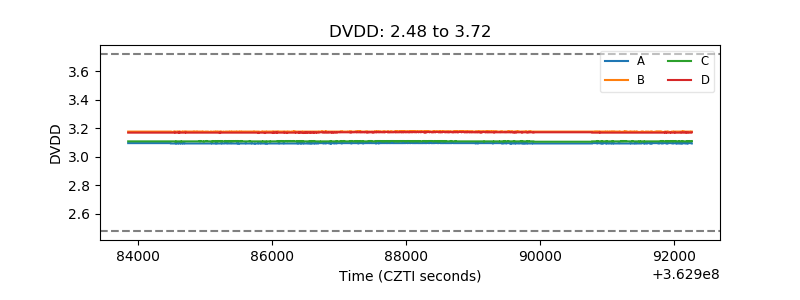 |
| Temperature 1 | 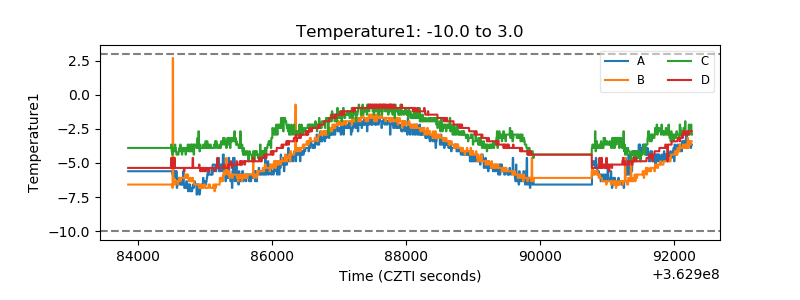 |
| Veto HV Monitor | 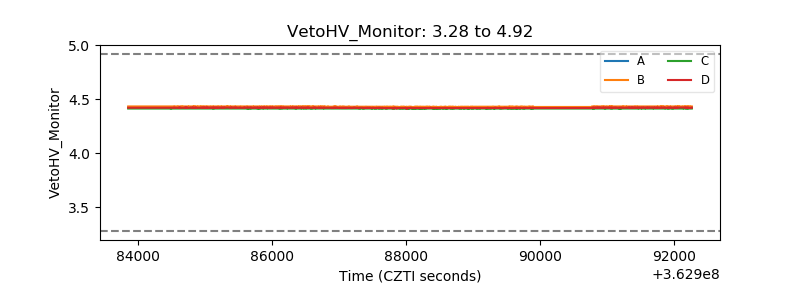 |
| Veto LLD | 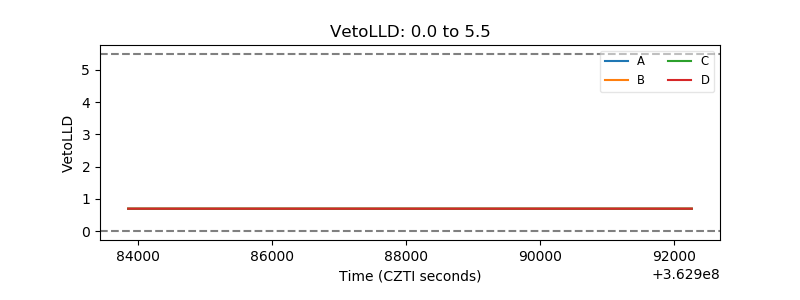 |
| Alpha Counter |  |
| _CPM_Rate | 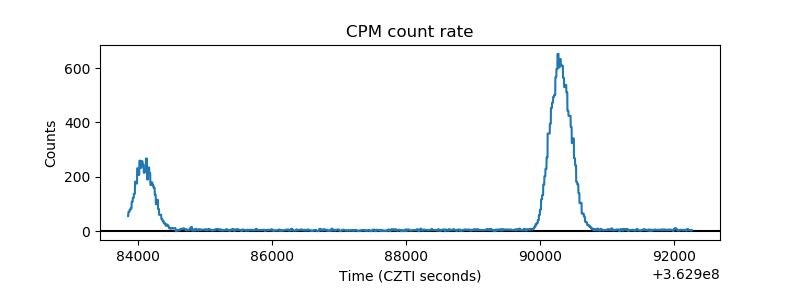 |
| CZT Counter | 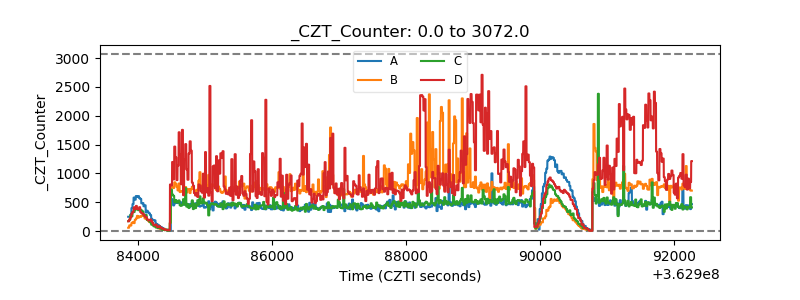 |
| +2.5 Volts monitor |  |
| +5 Volts monitor |  |
| _ROLL_ROT | 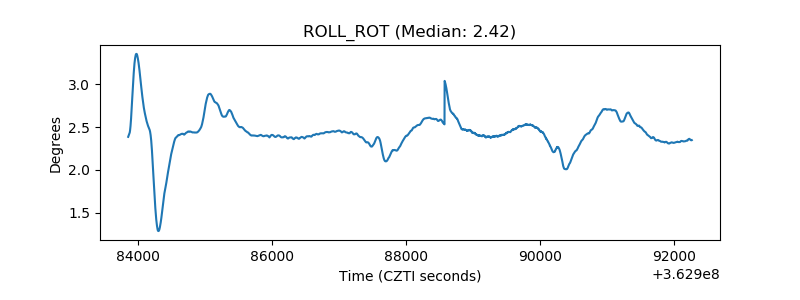 |
| _Roll_DEC | 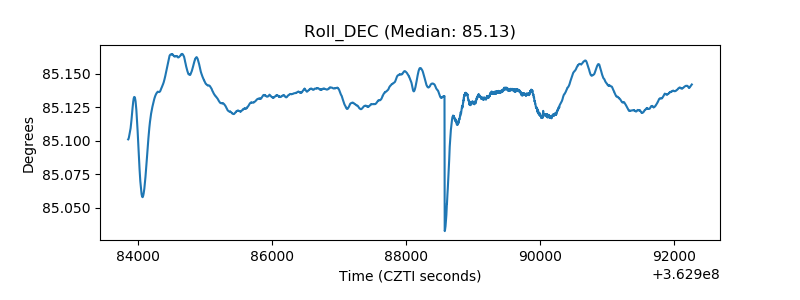 |
| _Roll_RA | 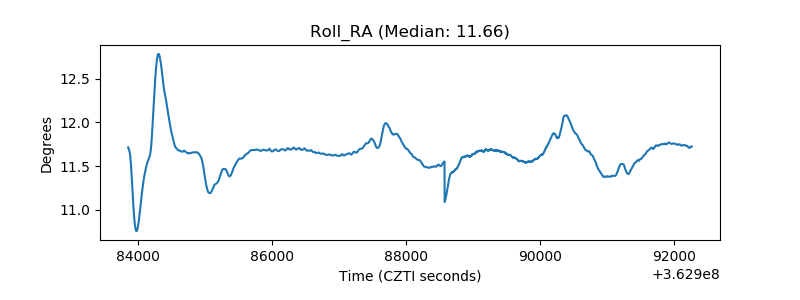 |
| Veto Counter | 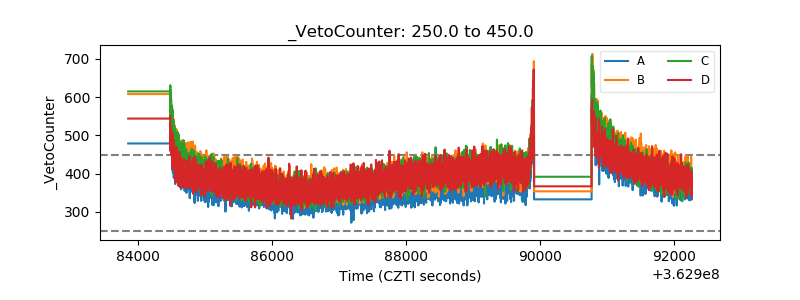 |