| Param | Original file | Final file |
|---|---|---|
| Filename | modeM0/AS1C06_010T01_9000004504_31160cztM0_level2.evt | modeM0/AS1C06_010T01_9000004504_31160cztM0_level2_quad_clean.evt |
| Size (bytes) | 611,208,000 | 119,666,880 |
| Size | 582.9 MB | 114.1 MB |
| Events in quadrant A | 2,956,508 | 828,856 |
| Events in quadrant B | 4,927,586 | 817,707 |
| Events in quadrant C | 3,066,486 | 789,229 |
| Events in quadrant D | 7,136,645 | 751,128 |
| Mode M9 | |||
|---|---|---|---|
| Quadrant | BADHDUFLAG | Total packets | Discarded packets |
| A | 0 | 9 | 0 |
| B | 0 | 9 | 0 |
| C | 0 | 9 | 0 |
| D | 0 | 9 | 0 |
| Mode SS | |||
|---|---|---|---|
| Quadrant | BADHDUFLAG | Total packets | Discarded packets |
| A | 0 | 128 | 0 |
| B | 0 | 128 | 0 |
| C | 0 | 128 | 0 |
| D | 0 | 128 | 0 |
| Mode M0 | |||
|---|---|---|---|
| Quadrant | BADHDUFLAG | Total packets | Discarded packets |
| A | 0 | 12861 | 1 |
| B | 0 | 19248 | 1 |
| C | 0 | 13086 | 1 |
| D | 0 | 25725 | 1 |
| Quadrant | Total seconds | Saturated seconds | Saturation percentage |
|---|---|---|---|
| A | 6261 | 41 | 0.654847% |
| B | 6262 | 99 | 1.580965% |
| C | 6262 | 77 | 1.229639% |
| D | 6261 | 672 | 10.733110% |
Noise dominated data is calculated using 1-second bins in cleaned event files. If a bin has >2000 counts, and if more than 50% of those come from <1% of pixels, then it is considered to be noise-dominated and hence unusable.
| Quadrant | # 1 sec bins | Bins with >0 counts | Bins with >2000 counts | High rate bins dominated by noise | Noise dominated (total time) | Noise dominated (detector-on time) | Marked lightcurve |
|---|---|---|---|---|---|---|---|
| A | 7246 | 6262 | 7 | 7 | 0.10% | 0.11% | 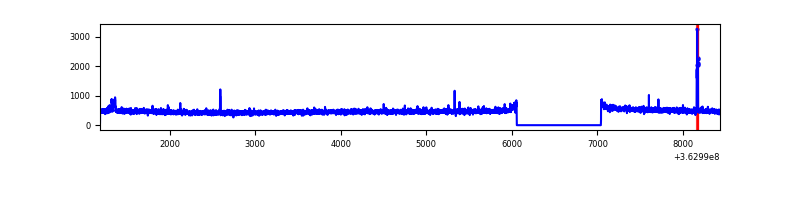 |
| B | 7247 | 6263 | 10 | 10 | 0.14% | 0.16% | 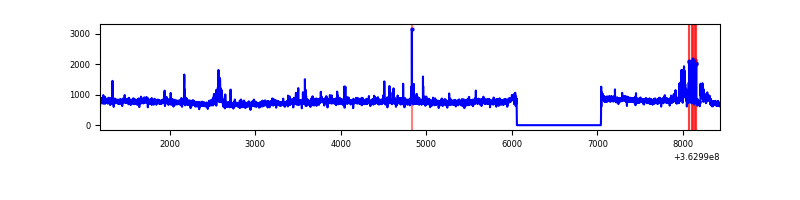 |
| C | 7247 | 6263 | 25 | 25 | 0.34% | 0.40% | 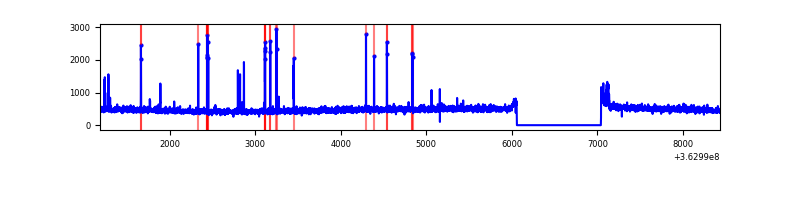 |
| D | 7246 | 6262 | 865 | 865 | 11.94% | 13.81% | 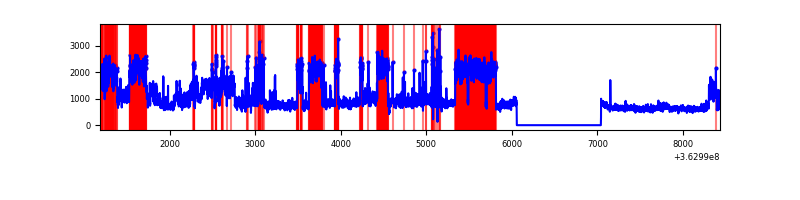 |
Top three noisy pixels from each quadrant. If the there are fewer than three noisy pixels in the level2.evt file, extra rows are filled as -1
| Pixel properties | Quadrant properties | ||||||
|---|---|---|---|---|---|---|---|
| Quadrant | DetID | PixID | Counts | Sigma | Mean | Median | Sigma |
| A | 15 | 174 | 30149 | 195.28 | 753 | 738 | 150.6 |
| A | 3 | 247 | 15422 | 97.5 | 753 | 738 | 150.6 |
| A | 13 | 254 | 10964 | 67.9 | 753 | 738 | 150.6 |
| B | 6 | 159 | 1758745 | 12524.09 | 740 | 721 | 140.4 |
| B | 15 | 33 | 146621 | 1039.39 | 740 | 721 | 140.4 |
| B | 0 | 190 | 48014 | 336.91 | 740 | 721 | 140.4 |
| C | 0 | 10 | 126457 | 754.57 | 711 | 714 | 166.6 |
| C | 14 | 238 | 118789 | 708.56 | 711 | 714 | 166.6 |
| C | 3 | 233 | 16736 | 96.15 | 711 | 714 | 166.6 |
| D | 8 | 195 | 3382628 | 19022.88 | 708 | 694 | 177.8 |
| D | 13 | 174 | 768304 | 4317.69 | 708 | 694 | 177.8 |
| D | 12 | 233 | 148447 | 831.09 | 708 | 694 | 177.8 |
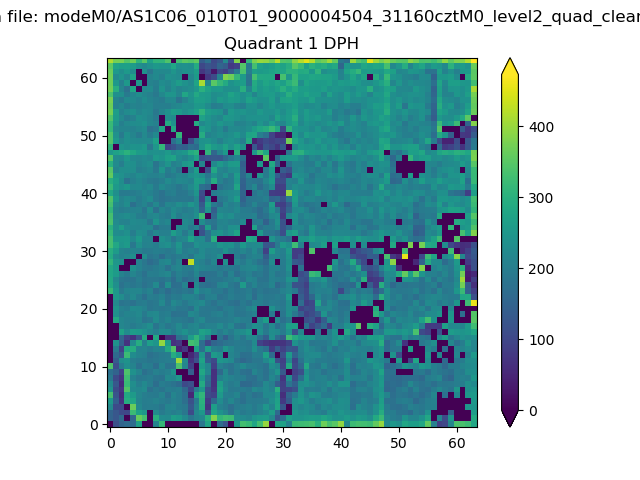
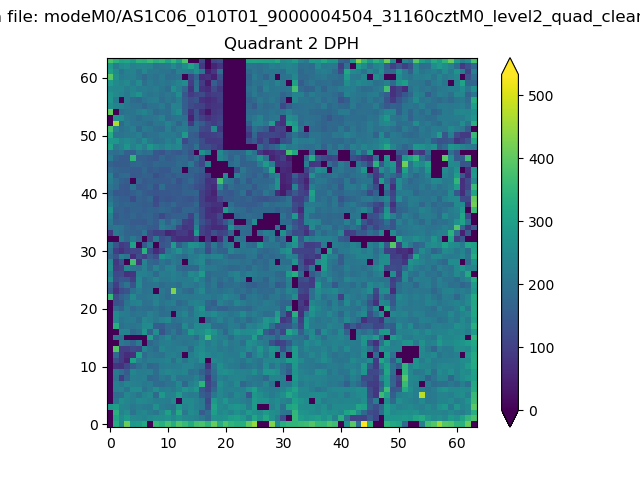
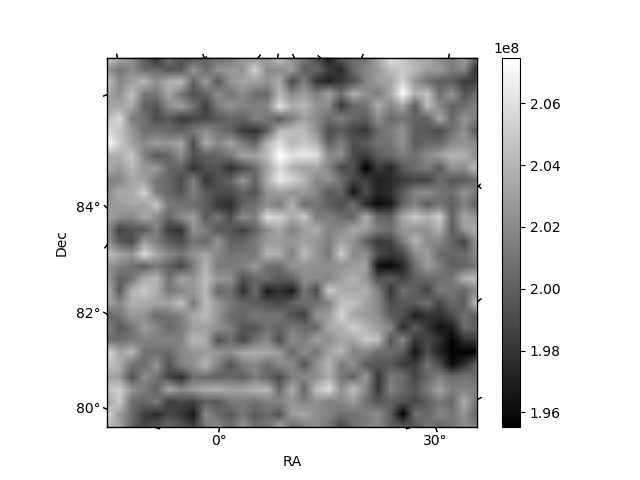
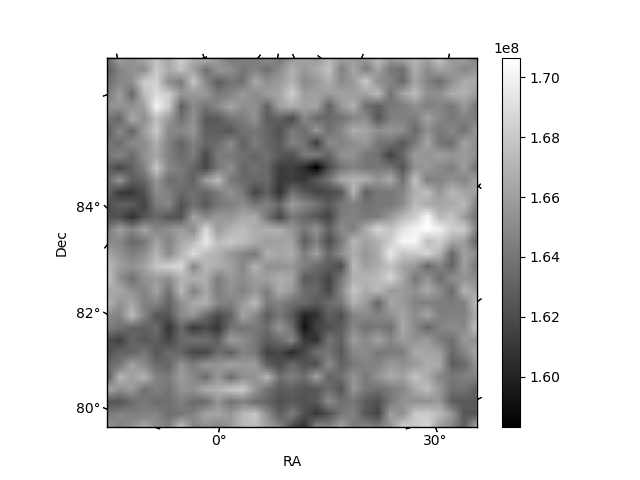
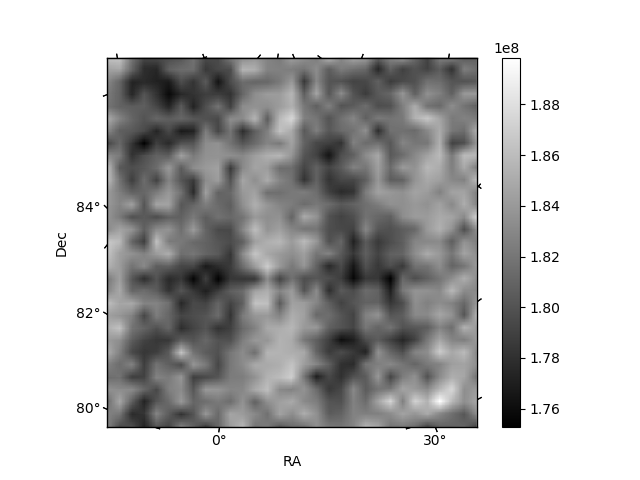
Histogram calculated using DETX and DETY for each event in the final _common_clean file
| Quadrant A |  |
 |
Quadrant B |
|---|---|---|---|
| Quadrant D | 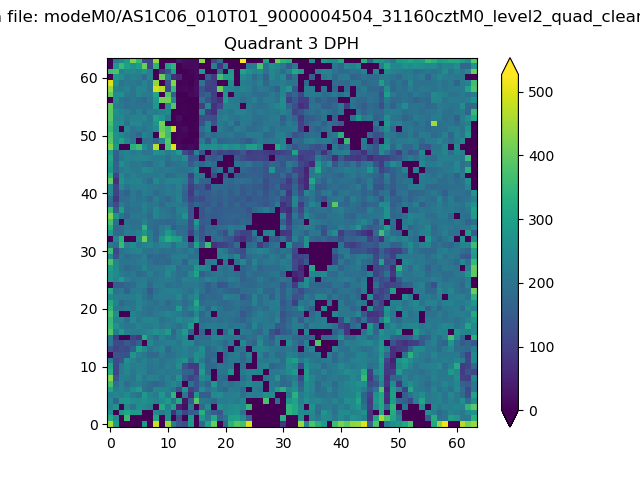 |
 |
Quadrant C |
| Plot type | Count rate plots | Images |
|---|---|---|
| Comparison with Poisson distribution Blue bars denote a histogram of data divided into 1 sec bins. Red curve is a Poisson curve with rate = median count rate of data. |
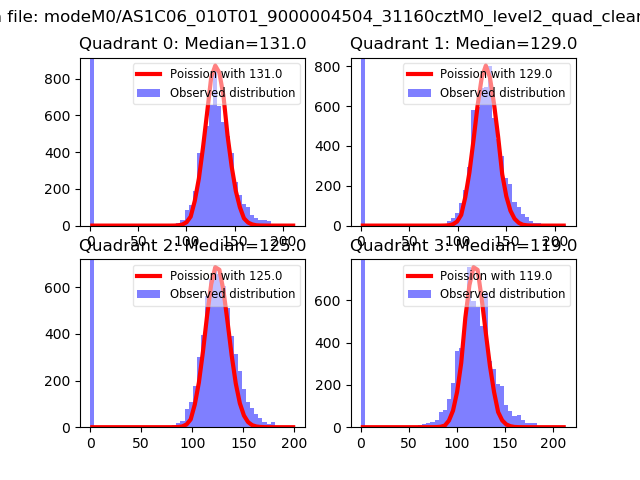 |
 |
| Quadrant-wise count rates Data is divided into 100 sec bins |
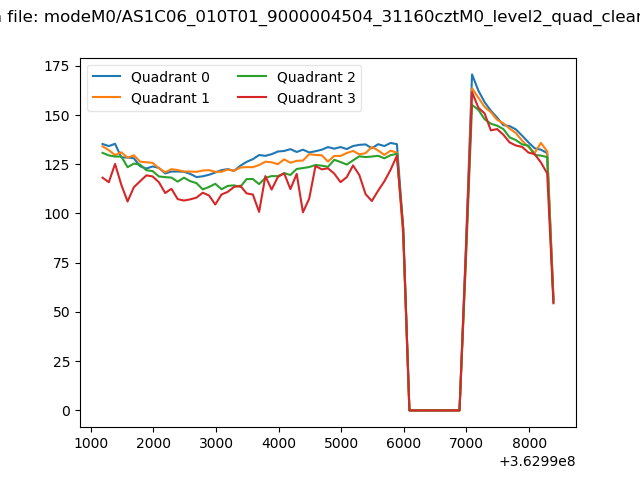 |
|
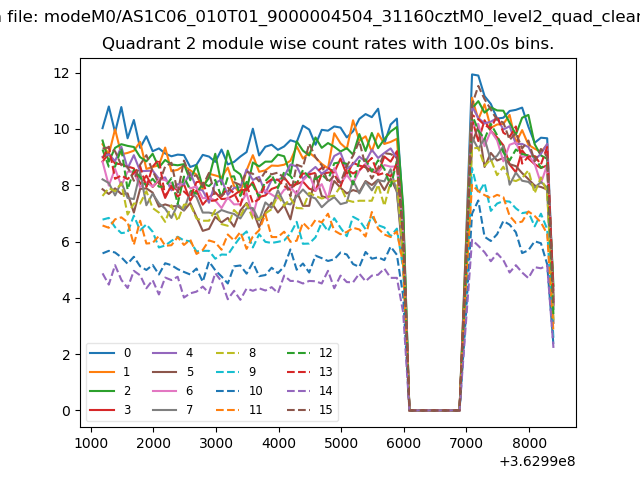
| Module-wise count rates for Quadrant A Data is divided into 100 sec bins |
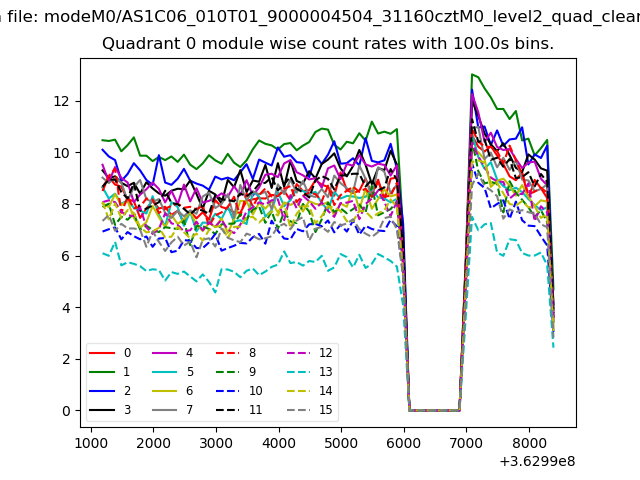 |
 |
| Module-wise count rates for Quadrant B Data is divided into 100 sec bins |
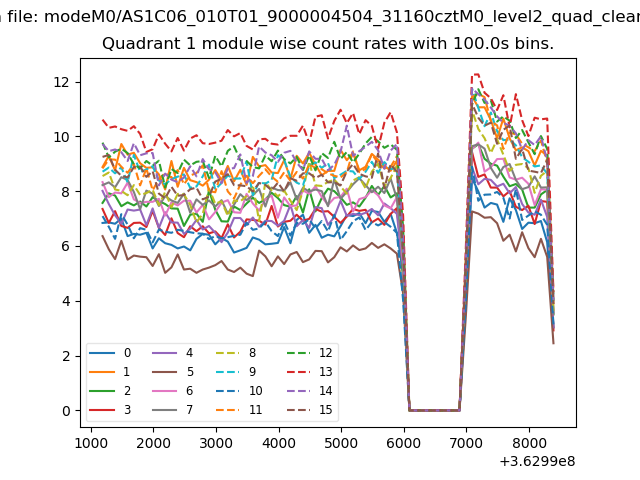 |
 |
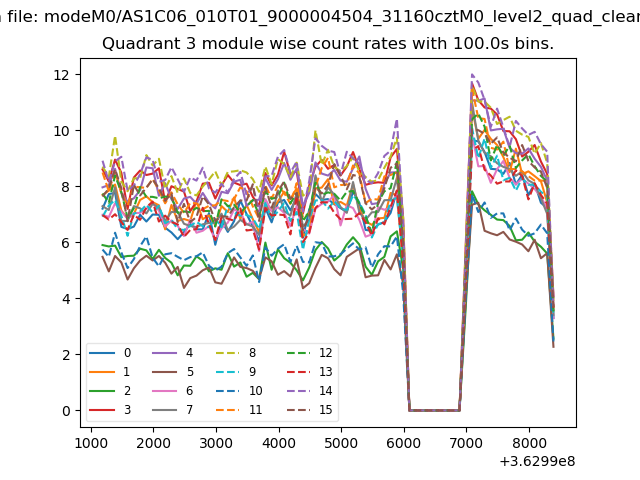
| Module-wise count rates for Quadrant C Data is divided into 100 sec bins |
 |
 |
| Module-wise count rates for Quadrant D Data is divided into 100 sec bins |
 |
 |
| Parameter | Plot |
|---|---|
| CZT HV Monitor | 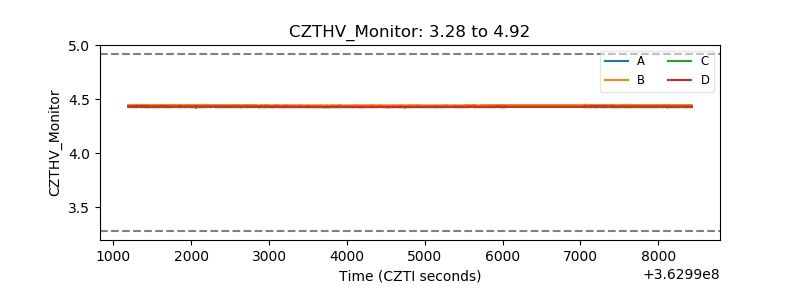 |
| D_VDD | 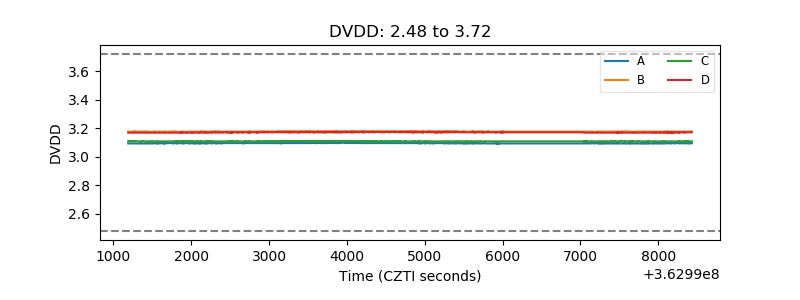 |
| Temperature 1 | 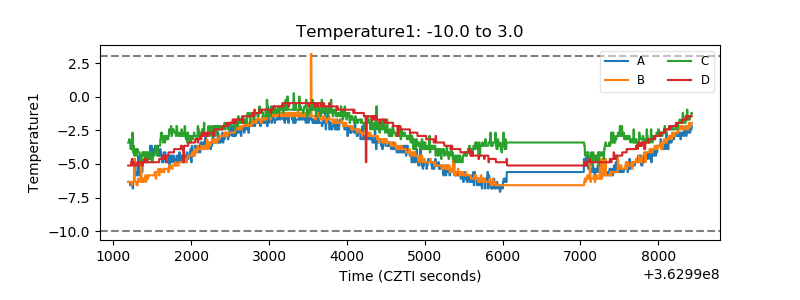 |
| Veto HV Monitor | 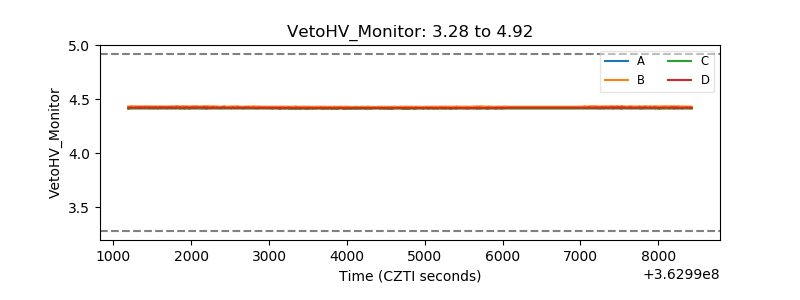 |
| Veto LLD | 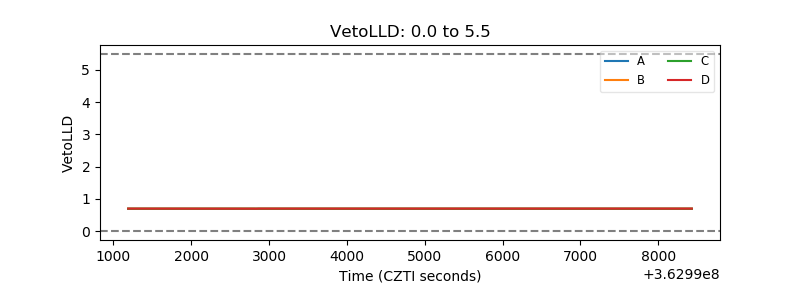 |
| Alpha Counter | 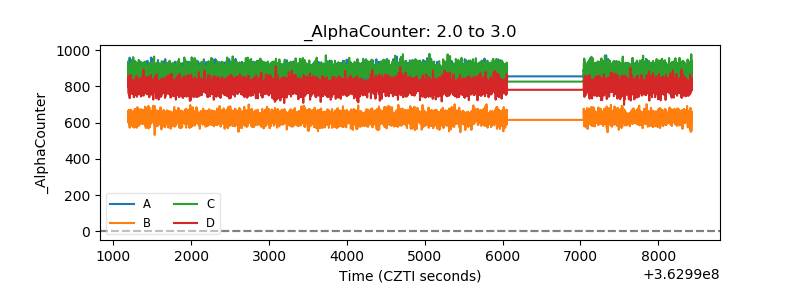 |
| _CPM_Rate | 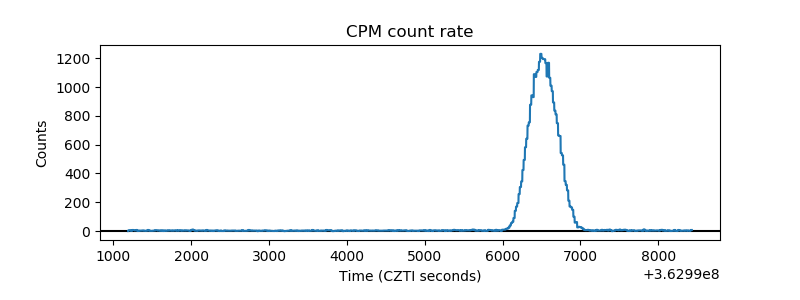 |
| CZT Counter |  |
| +2.5 Volts monitor |  |
| +5 Volts monitor | 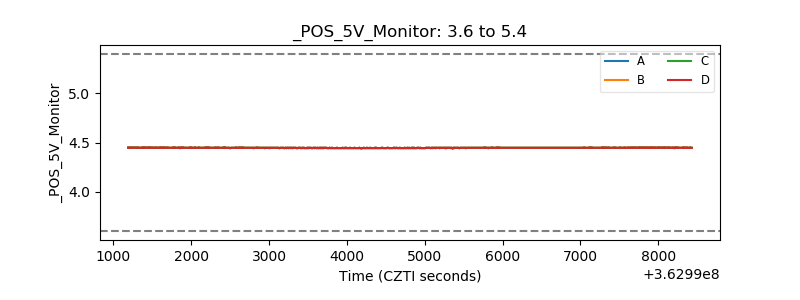 |
| _ROLL_ROT | 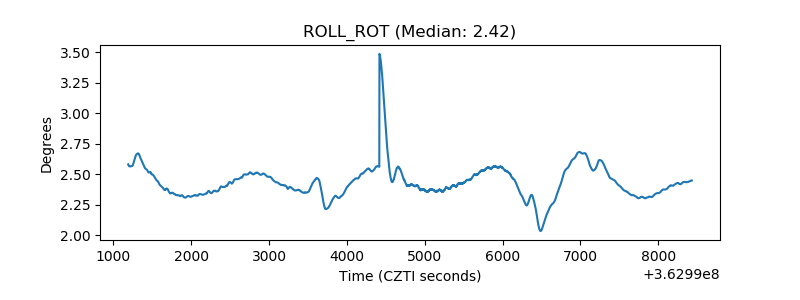 |
| _Roll_DEC | 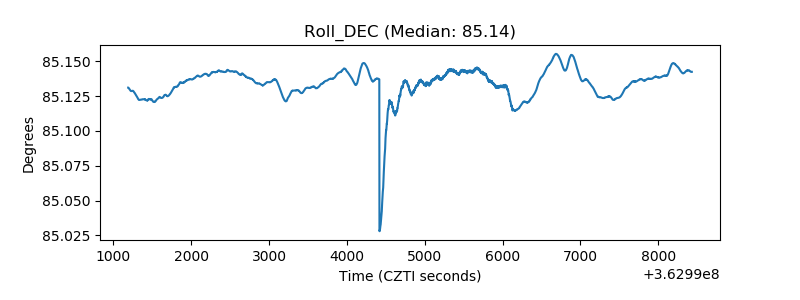 |
| _Roll_RA |  |
| Veto Counter | 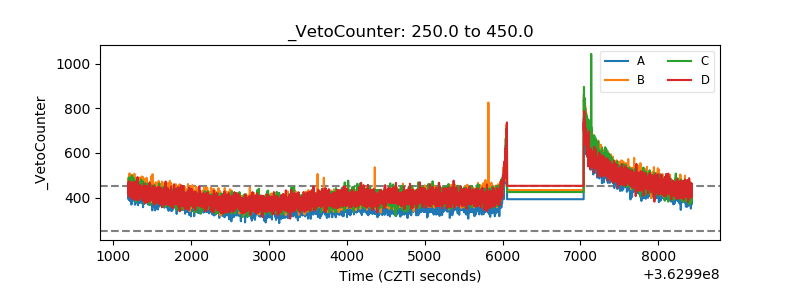 |