| Param | Original file | Final file |
|---|---|---|
| Filename | modeM0/AS1C06_010T01_9000004504_31162cztM0_level2.evt | modeM0/AS1C06_010T01_9000004504_31162cztM0_level2_quad_clean.evt |
| Size (bytes) | 394,896,960 | 84,562,560 |
| Size | 376.6 MB | 80.6 MB |
| Events in quadrant A | 2,048,651 | 587,760 |
| Events in quadrant B | 3,441,978 | 576,243 |
| Events in quadrant C | 2,075,612 | 553,040 |
| Events in quadrant D | 4,101,566 | 541,564 |
| Mode M9 | |||
|---|---|---|---|
| Quadrant | BADHDUFLAG | Total packets | Discarded packets |
| A | 0 | 3 | 0 |
| B | 0 | 4 | 0 |
| C | 0 | 4 | 0 |
| D | 0 | 4 | 0 |
| Mode SS | |||
|---|---|---|---|
| Quadrant | BADHDUFLAG | Total packets | Discarded packets |
| A | 0 | 86 | 0 |
| B | 0 | 86 | 0 |
| C | 0 | 86 | 0 |
| D | 0 | 86 | 0 |
| Mode M0 | |||
|---|---|---|---|
| Quadrant | BADHDUFLAG | Total packets | Discarded packets |
| A | 0 | 8824 | 1 |
| B | 0 | 13348 | 1 |
| C | 0 | 8823 | 1 |
| D | 0 | 15500 | 1 |
| Quadrant | Total seconds | Saturated seconds | Saturation percentage |
|---|---|---|---|
| A | 4295 | 11 | 0.256112% |
| B | 4295 | 54 | 1.257276% |
| C | 4295 | 31 | 0.721769% |
| D | 4295 | 162 | 3.771828% |
Noise dominated data is calculated using 1-second bins in cleaned event files. If a bin has >2000 counts, and if more than 50% of those come from <1% of pixels, then it is considered to be noise-dominated and hence unusable.
| Quadrant | # 1 sec bins | Bins with >0 counts | Bins with >2000 counts | High rate bins dominated by noise | Noise dominated (total time) | Noise dominated (detector-on time) | Marked lightcurve |
|---|---|---|---|---|---|---|---|
| A | 4295 | 4295 | 7 | 7 | 0.16% | 0.16% | 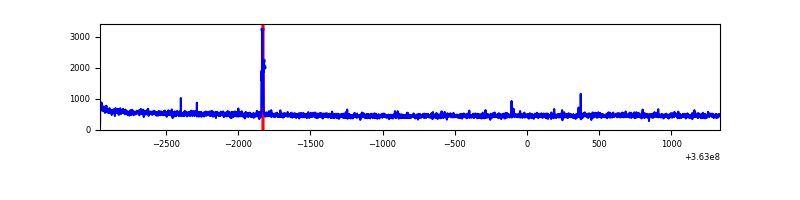 |
| B | 4295 | 4295 | 9 | 9 | 0.21% | 0.21% | 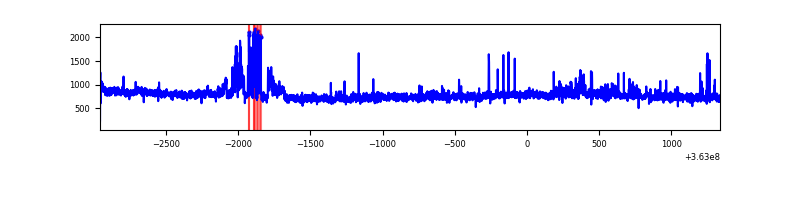 |
| C | 4295 | 4295 | 0 | 0 | 0.00% | 0.00% |  |
| D | 4295 | 4295 | 145 | 145 | 3.38% | 3.38% | 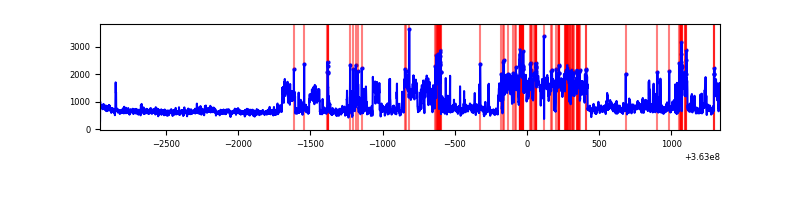 |
Top three noisy pixels from each quadrant. If the there are fewer than three noisy pixels in the level2.evt file, extra rows are filled as -1
| Pixel properties | Quadrant properties | ||||||
|---|---|---|---|---|---|---|---|
| Quadrant | DetID | PixID | Counts | Sigma | Mean | Median | Sigma |
| A | 15 | 174 | 27326 | 257.77 | 521 | 513 | 104.0 |
| A | 11 | 47 | 9804 | 89.32 | 521 | 513 | 104.0 |
| A | 13 | 254 | 8154 | 73.46 | 521 | 513 | 104.0 |
| B | 6 | 159 | 1220344 | 12629.18 | 508 | 495 | 96.6 |
| B | 15 | 33 | 113628 | 1171.27 | 508 | 495 | 96.6 |
| B | 0 | 190 | 55226 | 566.63 | 508 | 495 | 96.6 |
| C | 14 | 238 | 82043 | 713.84 | 489 | 492 | 114.2 |
| C | 0 | 10 | 39749 | 343.63 | 489 | 492 | 114.2 |
| C | 3 | 233 | 12900 | 108.61 | 489 | 492 | 114.2 |
| D | 8 | 195 | 1869860 | 15762.52 | 498 | 485 | 118.6 |
| D | 12 | 233 | 115241 | 967.62 | 498 | 485 | 118.6 |
| D | 13 | 174 | 86101 | 721.91 | 498 | 485 | 118.6 |
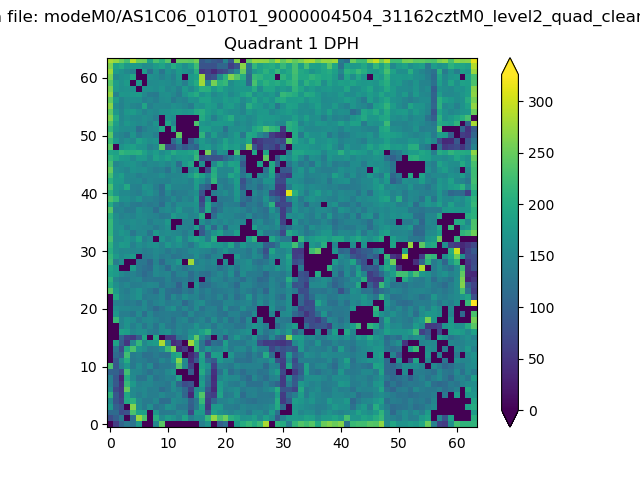
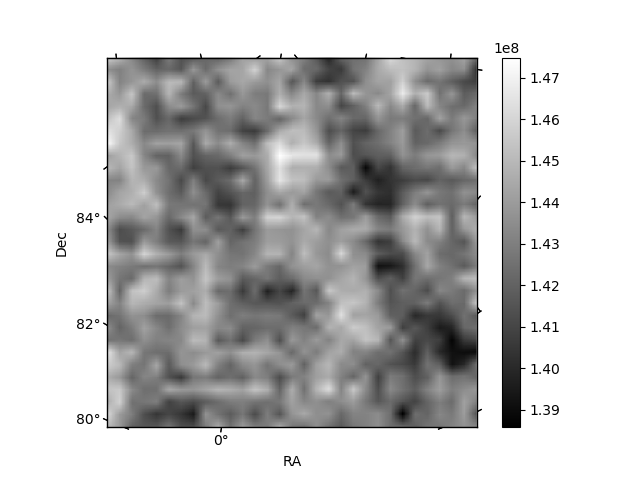
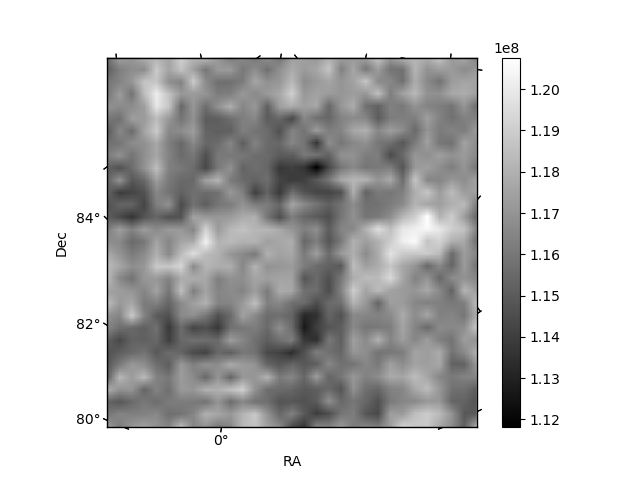
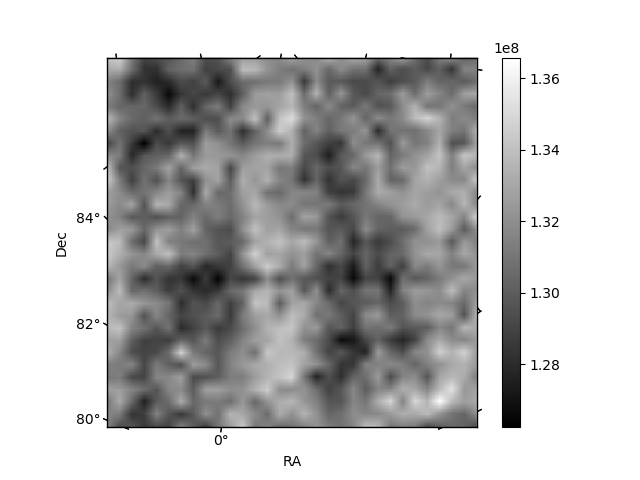
Histogram calculated using DETX and DETY for each event in the final _common_clean file
| Quadrant A | 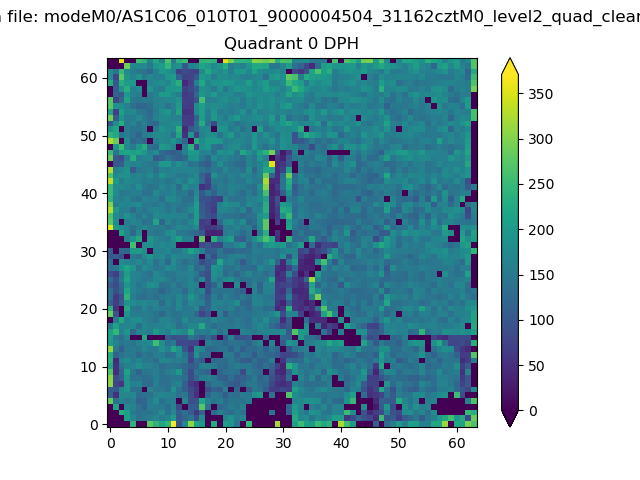 |
 |
Quadrant B |
|---|---|---|---|
| Quadrant D | 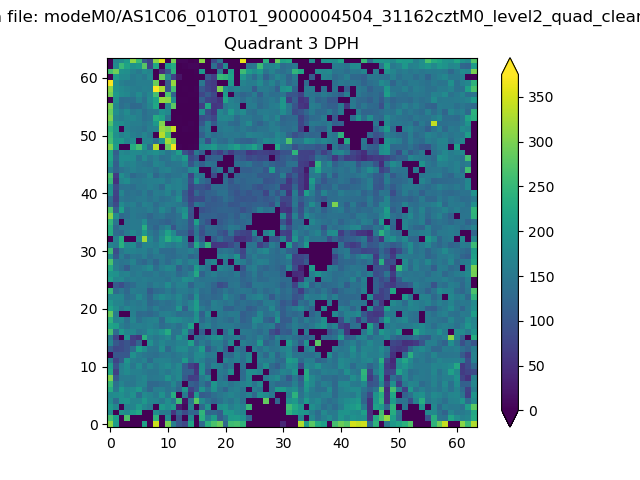 |
 |
Quadrant C |
| Plot type | Count rate plots | Images |
|---|---|---|
| Comparison with Poisson distribution Blue bars denote a histogram of data divided into 1 sec bins. Red curve is a Poisson curve with rate = median count rate of data. |
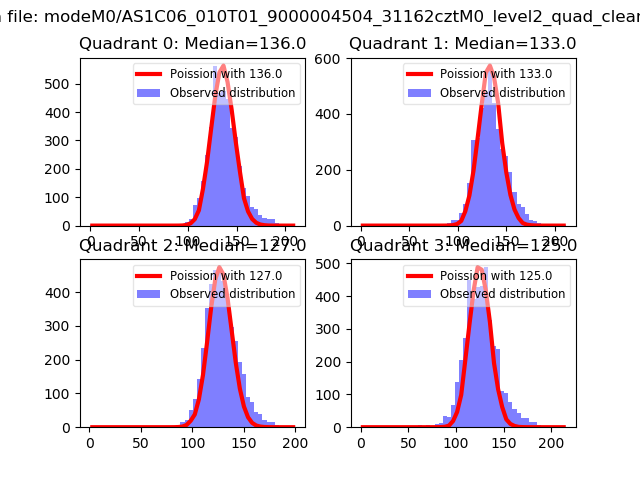 |
 |
| Quadrant-wise count rates Data is divided into 100 sec bins |
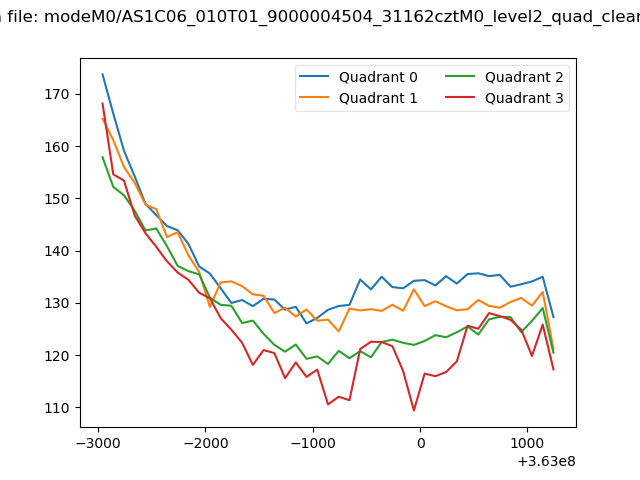 |
|
| Module-wise count rates for Quadrant A Data is divided into 100 sec bins |
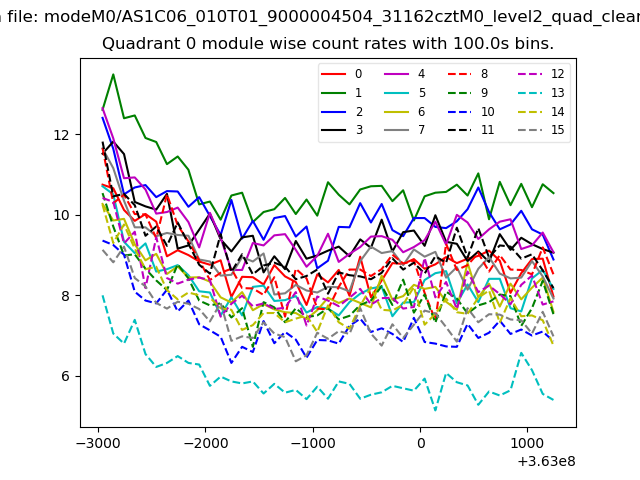 |
 |
| Module-wise count rates for Quadrant B Data is divided into 100 sec bins |
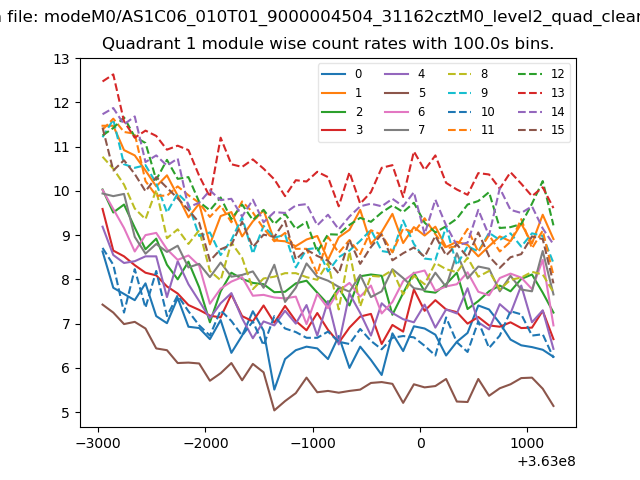 |
 |
| Module-wise count rates for Quadrant C Data is divided into 100 sec bins |
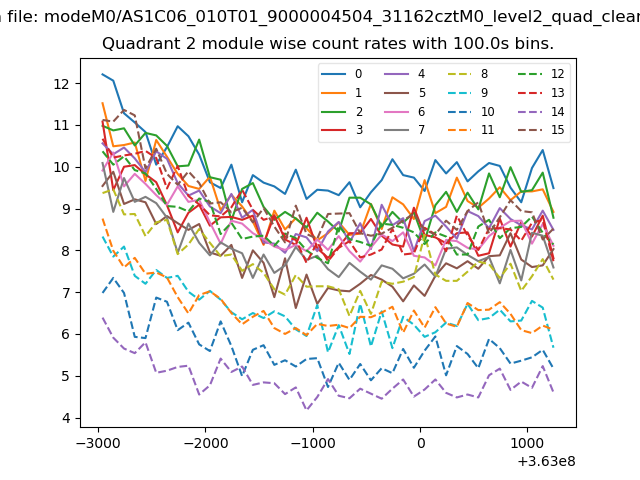 |
 |
| Module-wise count rates for Quadrant D Data is divided into 100 sec bins |
 |
 |
| Parameter | Plot |
|---|---|
| CZT HV Monitor |  |
| D_VDD | 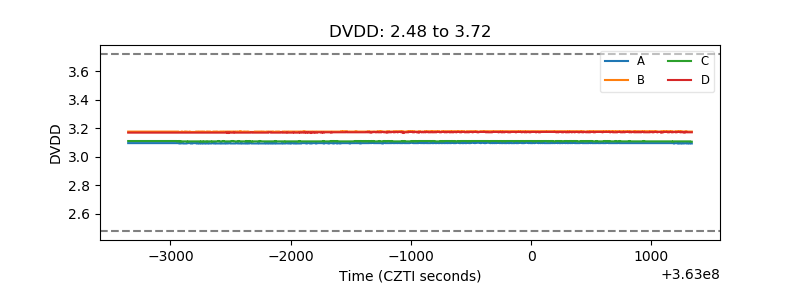 |
| Temperature 1 | 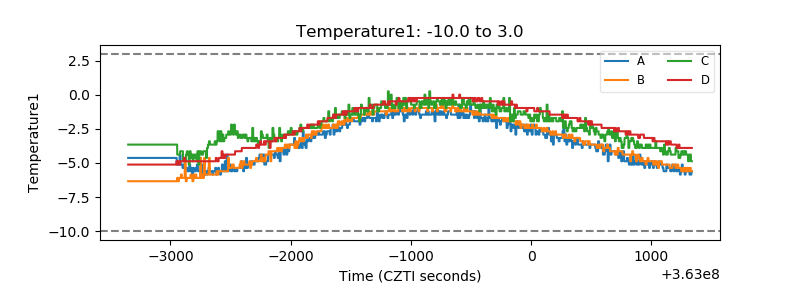 |
| Veto HV Monitor | 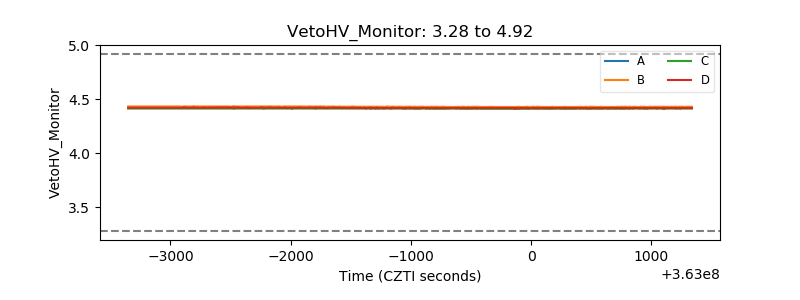 |
| Veto LLD | 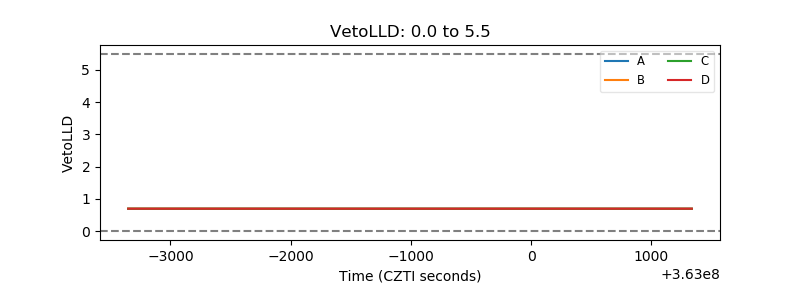 |
| Alpha Counter | 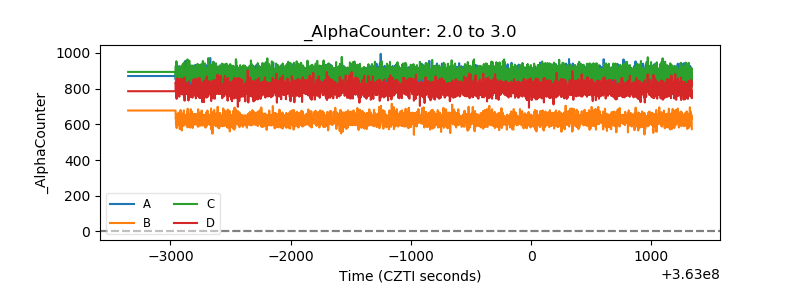 |
| _CPM_Rate | 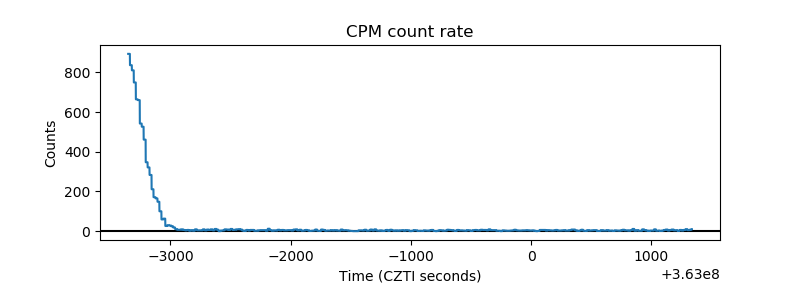 |
| CZT Counter |  |
| +2.5 Volts monitor |  |
| +5 Volts monitor | 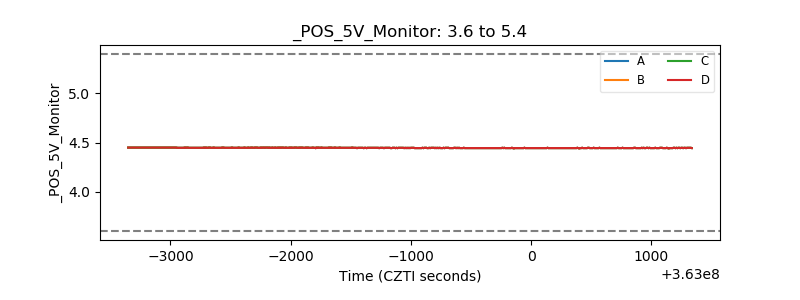 |
| _ROLL_ROT | 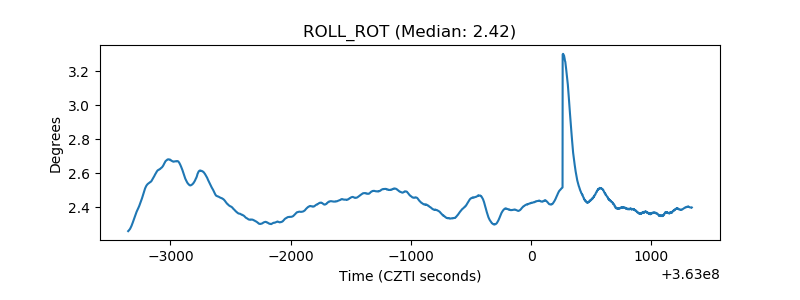 |
| _Roll_DEC | 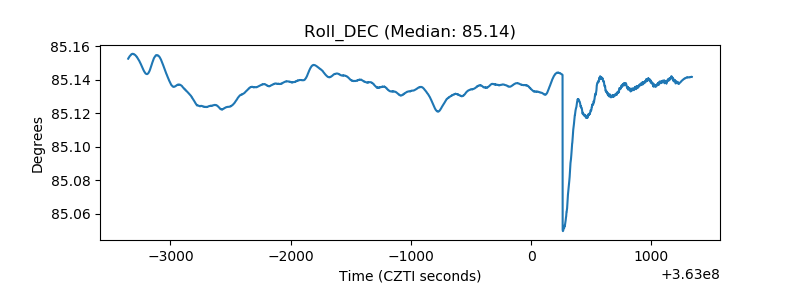 |
| _Roll_RA | 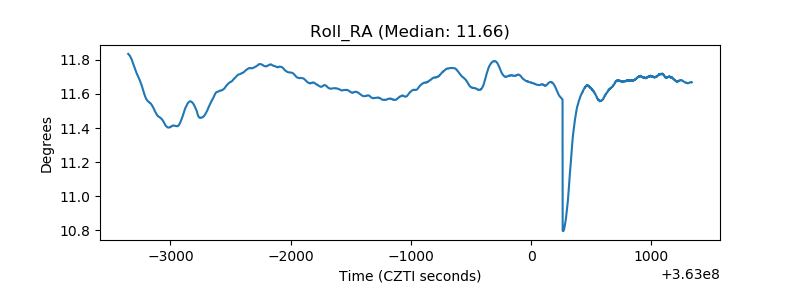 |
| Veto Counter | 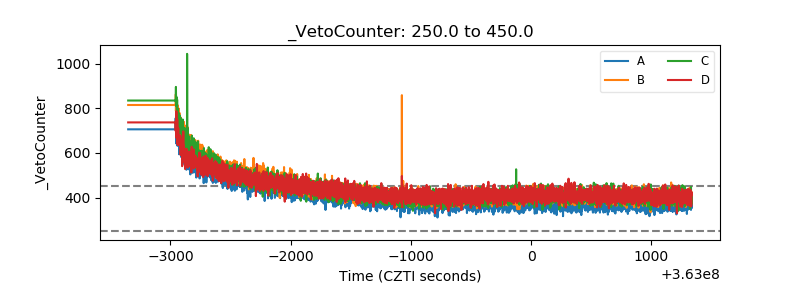 |