| Param | Original file | Final file |
|---|---|---|
| Filename | modeM0/AS1A10_082T10_9000004512cztM0_level2.fits | modeM0/AS1A10_082T10_9000004512cztM0_level2_quad_clean.evt |
| Size (bytes) | 293,022,720 | 214,168,320 |
| Size | 279.4 MB | 204.2 MB |
| Events in quadrant A | 1,916,428 | 1,261,005 |
| Events in quadrant B | 1,714,628 | 1,161,649 |
| Events in quadrant C | 1,817,886 | 1,175,666 |
| Events in quadrant D | 1,557,856 | 1,019,452 |
| Mode M0 | |||
|---|---|---|---|
| Quadrant | BADHDUFLAG | Total packets | Discarded packets |
| A | 0 | 58330 | 0 |
| B | 0 | 92596 | 0 |
| C | 0 | 61381 | 0 |
| D | 0 | 103315 | 0 |
| Mode SS | |||
|---|---|---|---|
| Quadrant | BADHDUFLAG | Total packets | Discarded packets |
| A | 0 | 556 | 0 |
| B | 0 | 556 | 0 |
| C | 0 | 556 | 0 |
| D | 0 | 556 | 0 |
| Mode M9 | |||
|---|---|---|---|
| Quadrant | BADHDUFLAG | Total packets | Discarded packets |
| A | 0 | 70 | 0 |
| B | 0 | 70 | 0 |
| C | 0 | 70 | 0 |
| D | 0 | 70 | 0 |
| Quadrant | Total seconds | Saturated seconds | Saturation percentage |
|---|---|---|---|
| A | 27130 | 576 | 2.123111% |
| B | 27130 | 2196 | 8.094360% |
| C | 27130 | 1000 | 3.685957% |
| D | 27130 | 2314 | 8.529303% |
Noise dominated data is calculated using 1-second bins in cleaned event files. If a bin has >2000 counts, and if more than 50% of those come from <1% of pixels, then it is considered to be noise-dominated and hence unusable.
| Quadrant | # 1 sec bins | Bins with >0 counts | Bins with >2000 counts | High rate bins dominated by noise | Noise dominated (total time) | Noise dominated (detector-on time) | Marked lightcurve |
|---|---|---|---|---|---|---|---|
| A | 34215 | 27130 | 0 | 0 | 0.00% | 0.00% |  |
| B | 34214 | 27125 | 0 | 0 | 0.00% | 0.00% |  |
| C | 34215 | 27129 | 0 | 0 | 0.00% | 0.00% |  |
| D | 34215 | 26929 | 0 | 0 | 0.00% | 0.00% |  |
Top three noisy pixels from each quadrant. If the there are fewer than three noisy pixels in the level2.evt file, extra rows are filled as -1
| Pixel properties | Quadrant properties | ||||||
|---|---|---|---|---|---|---|---|
| Quadrant | DetID | PixID | Counts | Sigma | Mean | Median | Sigma |
| A | 0 | 29 | 1862 | 11.65 | 499 | 473 | 119.2 |
| A | 7 | 110 | 1446 | 8.16 | 499 | 473 | 119.2 |
| A | 0 | 30 | 1411 | 7.87 | 499 | 473 | 119.2 |
| B | 2 | 9 | 1381 | 10.76 | 454 | 439 | 87.6 |
| B | 3 | 80 | 1247 | 9.23 | 454 | 439 | 87.6 |
| B | 5 | 255 | 1137 | 7.97 | 454 | 439 | 87.6 |
| C | 12 | 241 | 1281 | 6.86 | 481 | 456 | 120.3 |
| C | 3 | 187 | 1232 | 6.45 | 481 | 456 | 120.3 |
| C | 3 | 126 | 1213 | 6.29 | 481 | 456 | 120.3 |
| D | 15 | 46 | 1169 | 6.45 | 445 | 409 | 117.8 |
| D | 10 | 189 | 1119 | 6.03 | 445 | 409 | 117.8 |
| D | 7 | 3 | 1091 | 5.79 | 445 | 409 | 117.8 |
Histogram calculated using DETX and DETY for each event in the final _common_clean file
| Quadrant A |  |
 |
Quadrant B |
|---|---|---|---|
| Quadrant D |  |
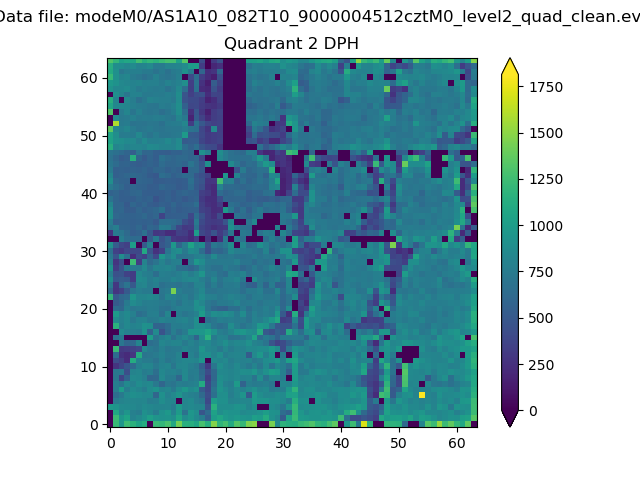 |
Quadrant C |
| Plot type | Count rate plots | Images |
|---|---|---|
| Comparison with Poisson distribution Blue bars denote a histogram of data divided into 1 sec bins. Red curve is a Poisson curve with rate = median count rate of data. |
 |
 |
| Quadrant-wise count rates Data is divided into 100 sec bins |
 |
|
| Module-wise count rates for Quadrant A Data is divided into 100 sec bins |
 |
 |
| Module-wise count rates for Quadrant B Data is divided into 100 sec bins |
 |
 |
| Module-wise count rates for Quadrant C Data is divided into 100 sec bins |
 |
 |
| Module-wise count rates for Quadrant D Data is divided into 100 sec bins |
 |
 |
| Parameter | Plot |
|---|---|
| CZT HV Monitor |  |
| D_VDD |  |
| Temperature 1 |  |
| Veto HV Monitor |  |
| Veto LLD |  |
| Alpha Counter |  |
| _CPM_Rate |  |
| CZT Counter |  |
| +2.5 Volts monitor |  |
| +5 Volts monitor |  |
| _ROLL_ROT |  |
| _Roll_DEC |  |
| _Roll_RA |  |
| Veto Counter |  |