| Param | Original file | Final file |
|---|---|---|
| Filename | modeM0/AS1A10_082T10_9000004512_31191cztM0_level2.evt | modeM0/AS1A10_082T10_9000004512_31191cztM0_level2_quad_clean.evt |
| Size (bytes) | 159,840,000 | 33,433,920 |
| Size | 152.4 MB | 31.9 MB |
| Events in quadrant A | 915,676 | 230,329 |
| Events in quadrant B | 1,463,509 | 227,788 |
| Events in quadrant C | 1,042,640 | 213,874 |
| Events in quadrant D | 1,305,236 | 219,163 |
| Mode M0 | |||
|---|---|---|---|
| Quadrant | BADHDUFLAG | Total packets | Discarded packets |
| A | 0 | 3729 | 1 |
| B | 0 | 5375 | 1 |
| C | 0 | 4077 | 1 |
| D | 0 | 5124 | 1 |
| Mode SS | |||
|---|---|---|---|
| Quadrant | BADHDUFLAG | Total packets | Discarded packets |
| A | 0 | 36 | 0 |
| B | 0 | 36 | 0 |
| C | 0 | 36 | 0 |
| D | 0 | 36 | 0 |
| Mode M9 | |||
|---|---|---|---|
| Quadrant | BADHDUFLAG | Total packets | Discarded packets |
| A | 0 | 11 | 0 |
| B | 0 | 11 | 0 |
| C | 0 | 11 | 0 |
| D | 0 | 11 | 0 |
| Quadrant | Total seconds | Saturated seconds | Saturation percentage |
|---|---|---|---|
| A | 1638 | 59 | 3.601954% |
| B | 1638 | 118 | 7.203907% |
| C | 1637 | 113 | 6.902871% |
| D | 1637 | 45 | 2.748931% |
Noise dominated data is calculated using 1-second bins in cleaned event files. If a bin has >2000 counts, and if more than 50% of those come from <1% of pixels, then it is considered to be noise-dominated and hence unusable.
| Quadrant | # 1 sec bins | Bins with >0 counts | Bins with >2000 counts | High rate bins dominated by noise | Noise dominated (total time) | Noise dominated (detector-on time) | Marked lightcurve |
|---|---|---|---|---|---|---|---|
| A | 2768 | 1639 | 0 | 0 | 0.00% | 0.00% | 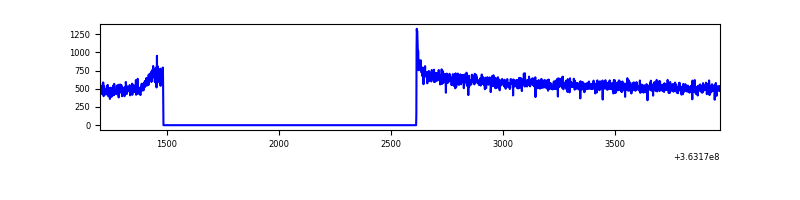 |
| B | 2768 | 1639 | 23 | 23 | 0.83% | 1.40% | 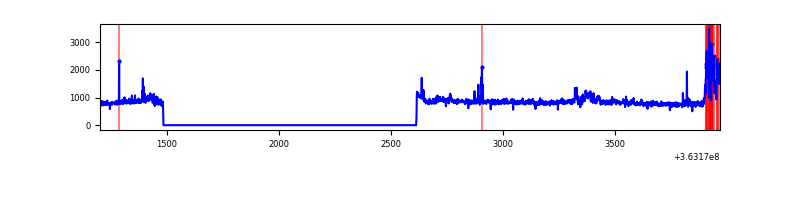 |
| C | 2767 | 1637 | 22 | 22 | 0.80% | 1.34% | 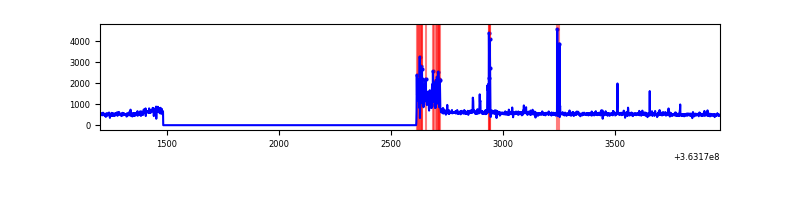 |
| D | 2767 | 1638 | 5 | 5 | 0.18% | 0.31% | 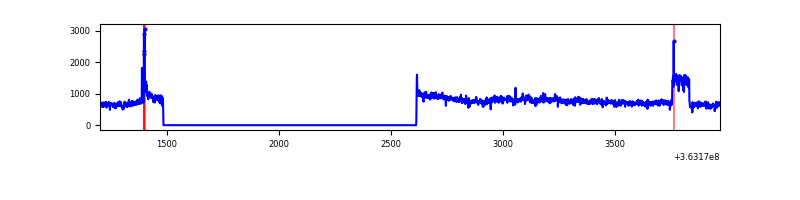 |
Top three noisy pixels from each quadrant. If the there are fewer than three noisy pixels in the level2.evt file, extra rows are filled as -1
| Pixel properties | Quadrant properties | ||||||
|---|---|---|---|---|---|---|---|
| Quadrant | DetID | PixID | Counts | Sigma | Mean | Median | Sigma |
| A | 8 | 160 | 4471 | 87.19 | 235 | 231 | 48.6 |
| A | 13 | 254 | 2739 | 51.57 | 235 | 231 | 48.6 |
| A | 11 | 47 | 2542 | 47.52 | 235 | 231 | 48.6 |
| B | 6 | 159 | 429717 | 9612.05 | 225 | 221 | 44.7 |
| B | 4 | 171 | 109884 | 2454.24 | 225 | 221 | 44.7 |
| B | 0 | 190 | 16242 | 358.55 | 225 | 221 | 44.7 |
| C | 0 | 10 | 149842 | 3000.49 | 213 | 214 | 49.9 |
| C | 14 | 238 | 38491 | 767.57 | 213 | 214 | 49.9 |
| C | 4 | 175 | 11782 | 231.97 | 213 | 214 | 49.9 |
| D | 8 | 195 | 442412 | 8230.55 | 222 | 217 | 53.7 |
| D | 12 | 79 | 18150 | 333.79 | 222 | 217 | 53.7 |
| D | 2 | 234 | 4501 | 79.74 | 222 | 217 | 53.7 |
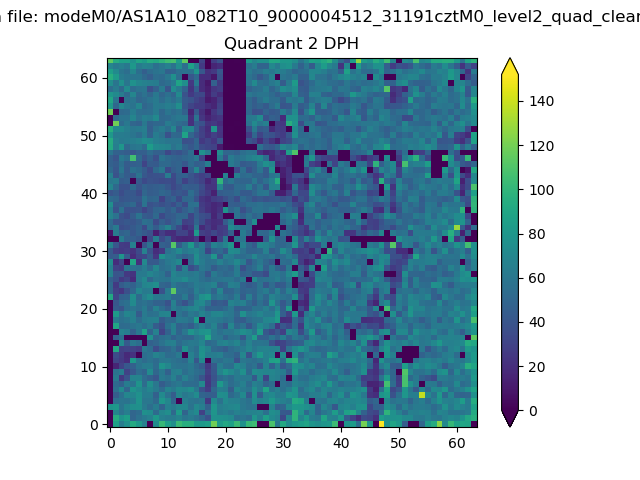
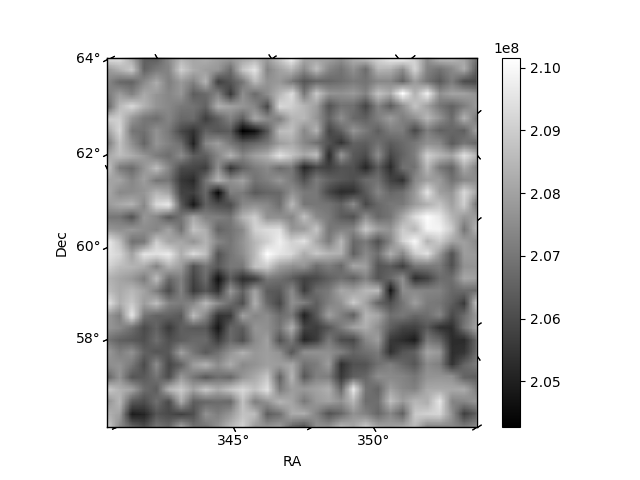
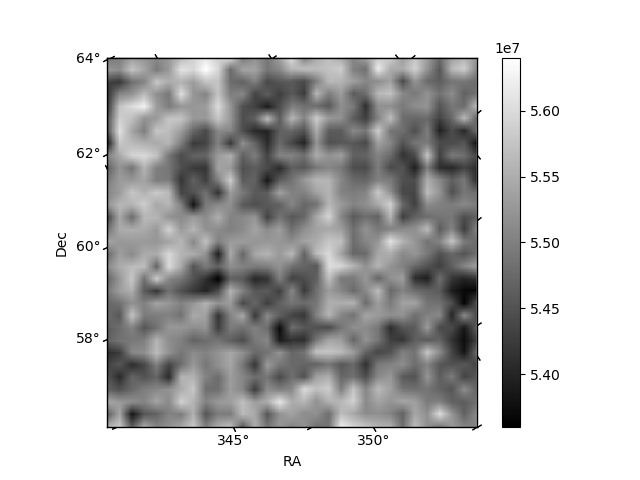
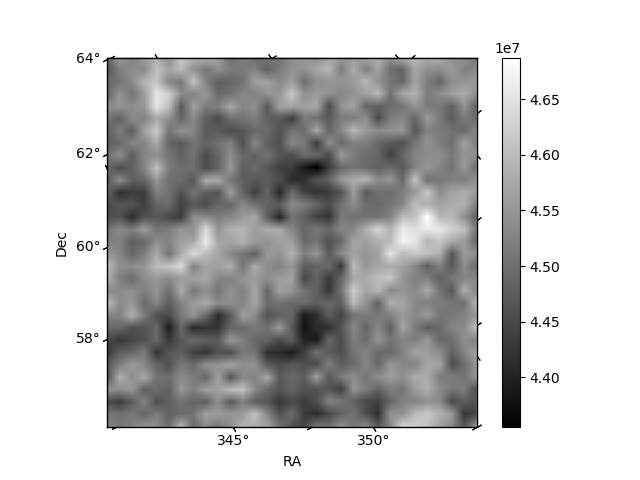
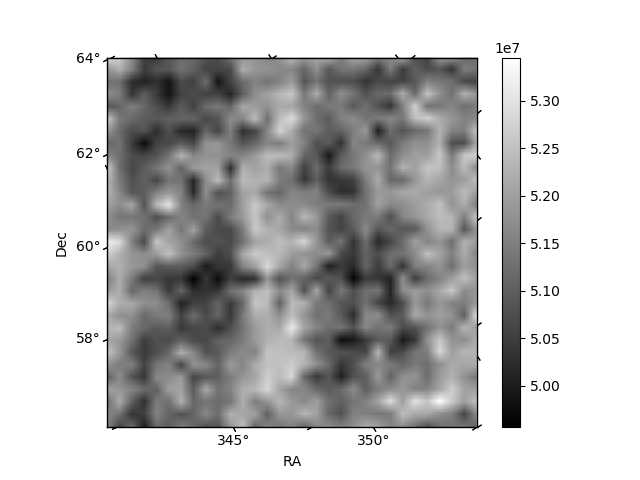
Histogram calculated using DETX and DETY for each event in the final _common_clean file
| Quadrant A | 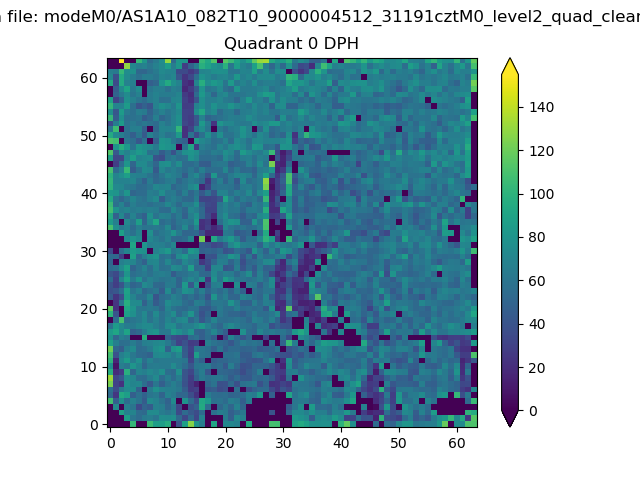 |
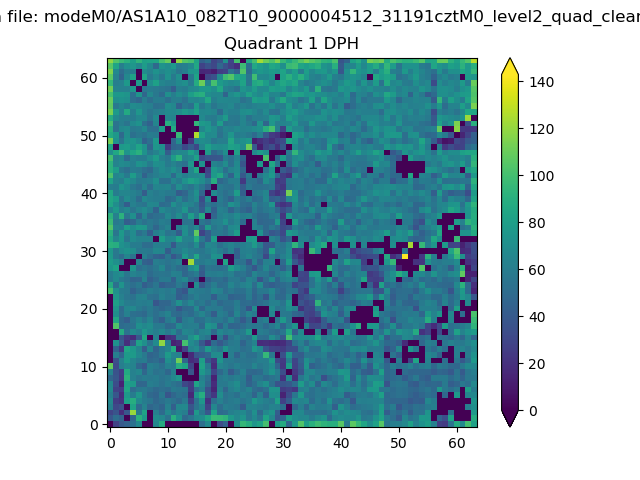 |
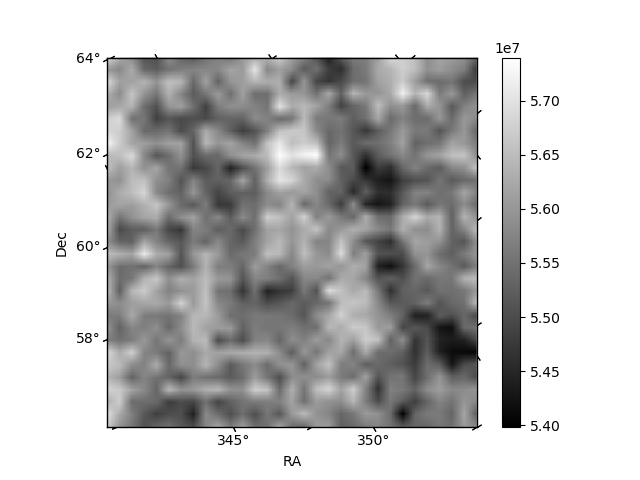
Quadrant B |
|---|---|---|---|
| Quadrant D | 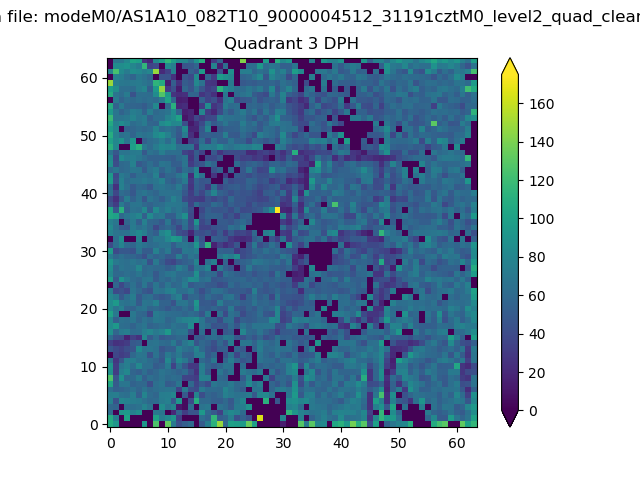 |
 |
Quadrant C |
| Plot type | Count rate plots | Images |
|---|---|---|
| Comparison with Poisson distribution Blue bars denote a histogram of data divided into 1 sec bins. Red curve is a Poisson curve with rate = median count rate of data. |
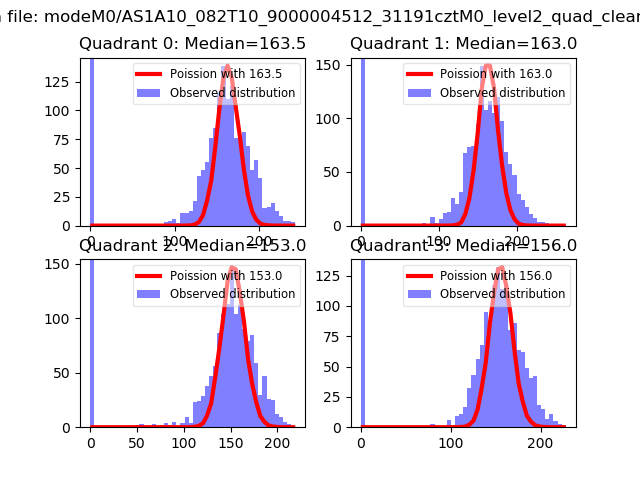 |
 |
| Quadrant-wise count rates Data is divided into 100 sec bins |
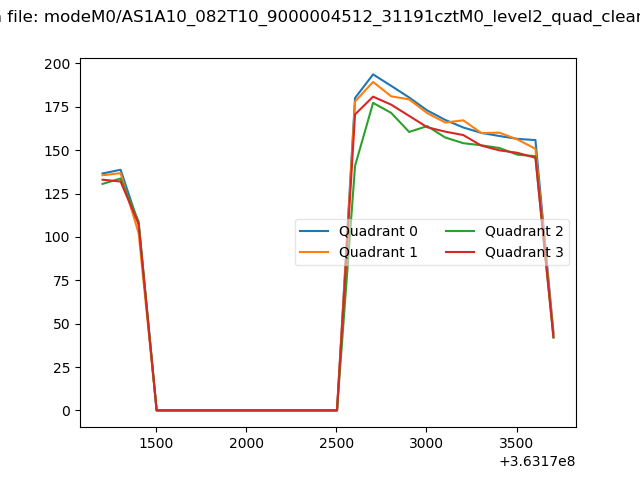 |
|
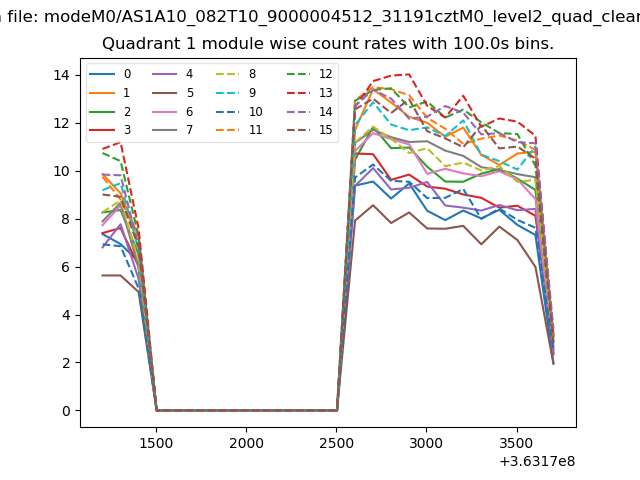
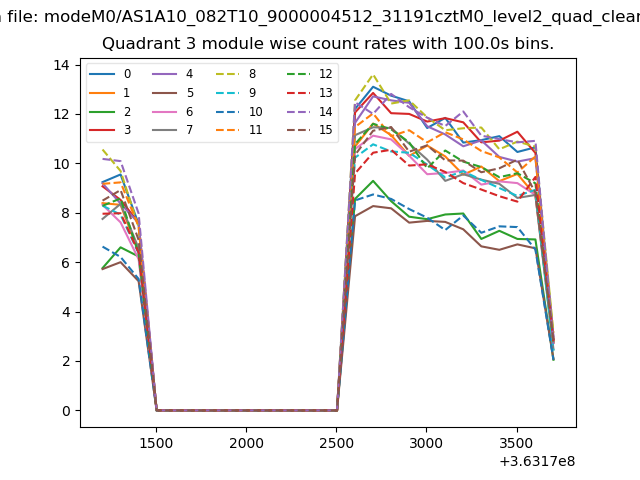
| Module-wise count rates for Quadrant A Data is divided into 100 sec bins |
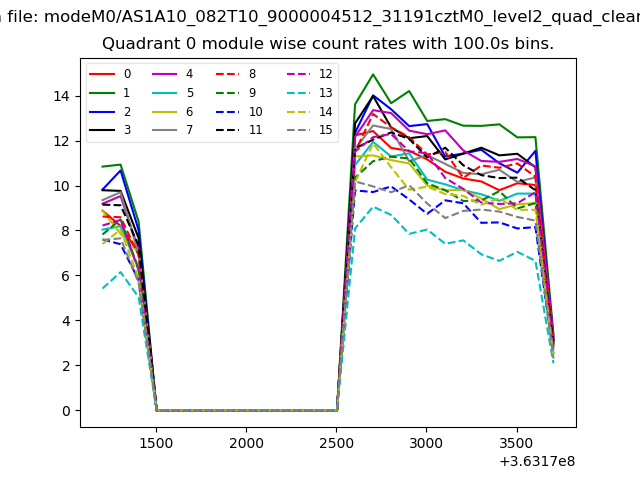 |
 |
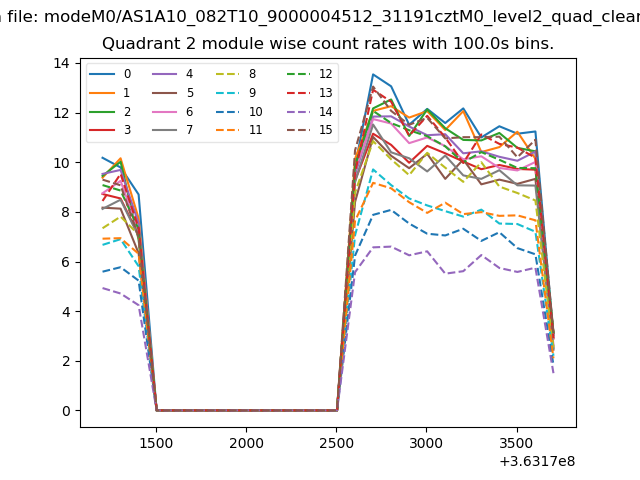
| Module-wise count rates for Quadrant B Data is divided into 100 sec bins |
 |
 |
| Module-wise count rates for Quadrant C Data is divided into 100 sec bins |
 |
 |
| Module-wise count rates for Quadrant D Data is divided into 100 sec bins |
 |
 |
| Parameter | Plot |
|---|---|
| CZT HV Monitor |  |
| D_VDD | 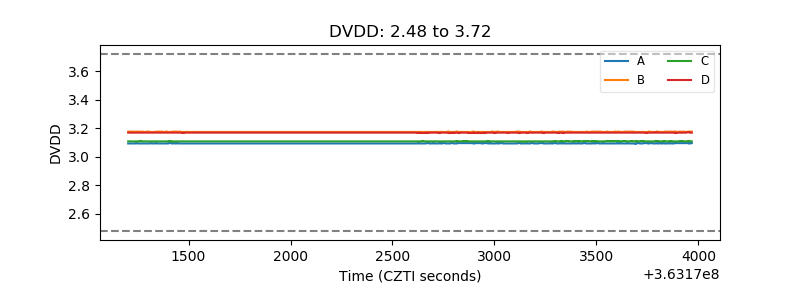 |
| Temperature 1 | 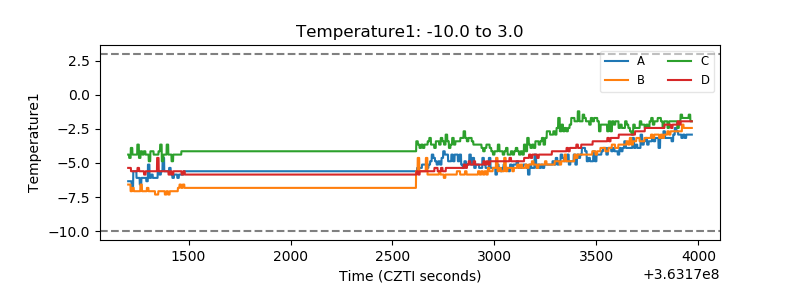 |
| Veto HV Monitor | 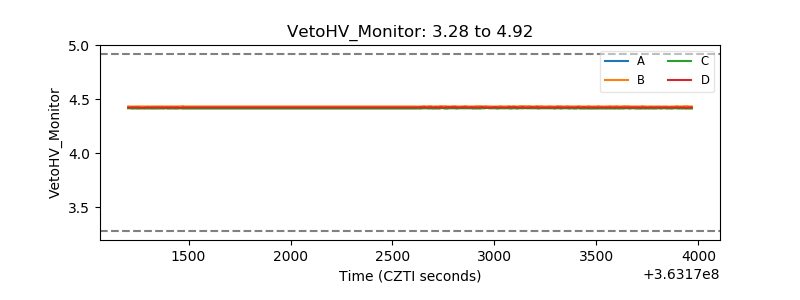 |
| Veto LLD | 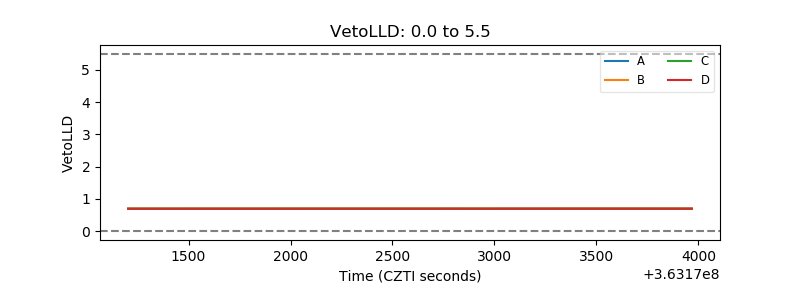 |
| Alpha Counter | 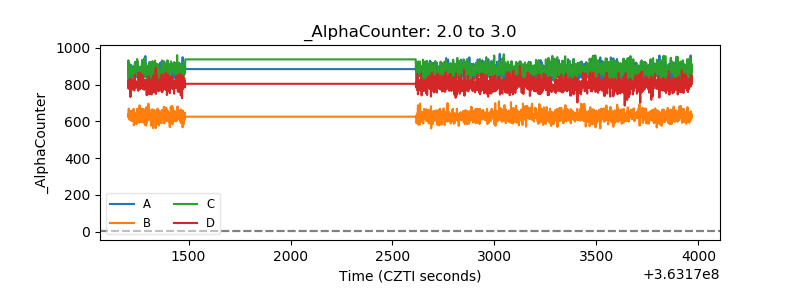 |
| _CPM_Rate | 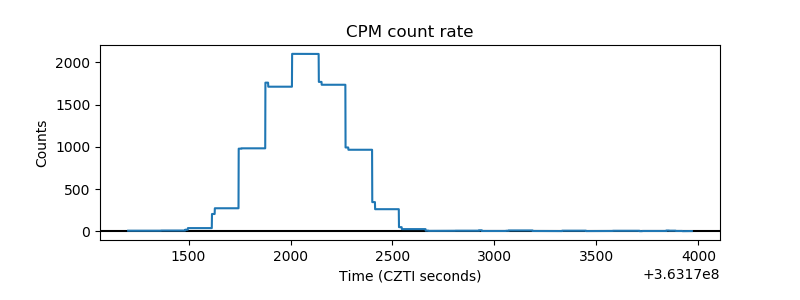 |
| CZT Counter | 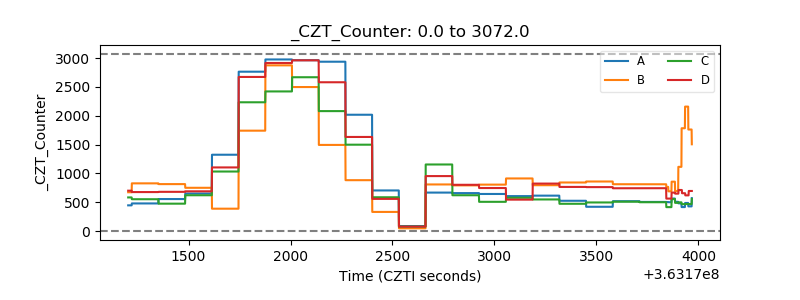 |
| +2.5 Volts monitor |  |
| +5 Volts monitor |  |
| _ROLL_ROT | 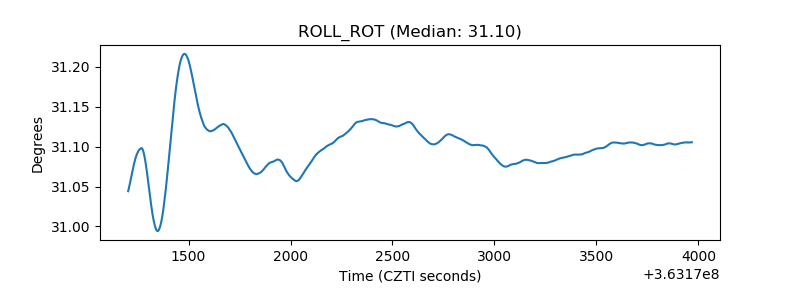 |
| _Roll_DEC | 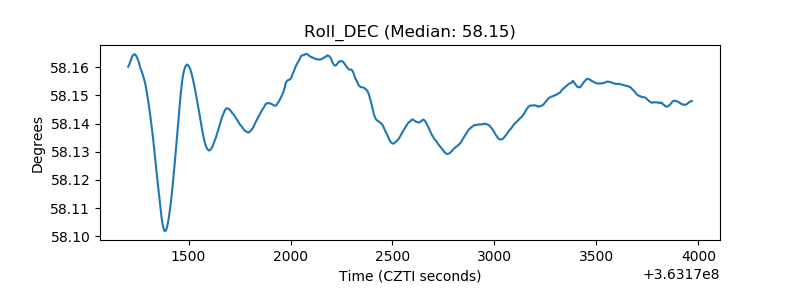 |
| _Roll_RA | 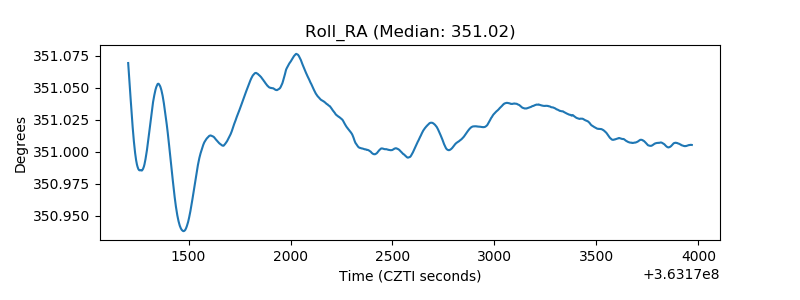 |
| Veto Counter | 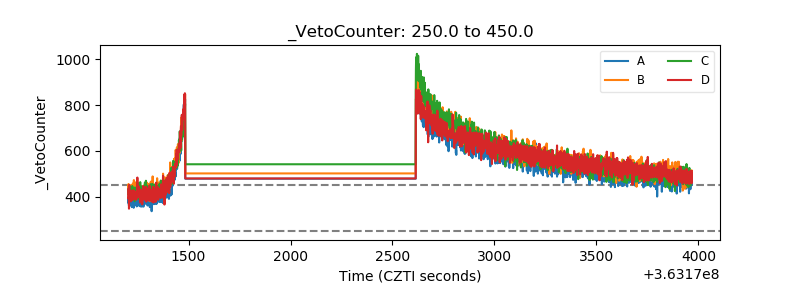 |