| Param | Original file | Final file |
|---|---|---|
| Filename | modeM0/AS1A10_082T10_9000004512_31192cztM0_level2.evt | modeM0/AS1A10_082T10_9000004512_31192cztM0_level2_quad_clean.evt |
| Size (bytes) | 615,303,360 | 93,473,280 |
| Size | 586.8 MB | 89.1 MB |
| Events in quadrant A | 3,282,649 | 620,090 |
| Events in quadrant B | 5,435,015 | 608,707 |
| Events in quadrant C | 3,515,858 | 580,709 |
| Events in quadrant D | 5,973,378 | 579,239 |
| Mode M0 | |||
|---|---|---|---|
| Quadrant | BADHDUFLAG | Total packets | Discarded packets |
| A | 0 | 13606 | 1 |
| B | 0 | 20354 | 1 |
| C | 0 | 14172 | 1 |
| D | 0 | 22554 | 1 |
| Mode SS | |||
|---|---|---|---|
| Quadrant | BADHDUFLAG | Total packets | Discarded packets |
| A | 0 | 130 | 0 |
| B | 0 | 130 | 0 |
| C | 0 | 130 | 0 |
| D | 0 | 130 | 0 |
| Mode M9 | |||
|---|---|---|---|
| Quadrant | BADHDUFLAG | Total packets | Discarded packets |
| A | 0 | 12 | 0 |
| B | 0 | 12 | 0 |
| C | 0 | 12 | 0 |
| D | 0 | 12 | 0 |
| Quadrant | Total seconds | Saturated seconds | Saturation percentage |
|---|---|---|---|
| A | 6328 | 81 | 1.280025% |
| B | 6329 | 231 | 3.649866% |
| C | 6329 | 168 | 2.654448% |
| D | 6329 | 149 | 2.354242% |
Noise dominated data is calculated using 1-second bins in cleaned event files. If a bin has >2000 counts, and if more than 50% of those come from <1% of pixels, then it is considered to be noise-dominated and hence unusable.
| Quadrant | # 1 sec bins | Bins with >0 counts | Bins with >2000 counts | High rate bins dominated by noise | Noise dominated (total time) | Noise dominated (detector-on time) | Marked lightcurve |
|---|---|---|---|---|---|---|---|
| A | 7533 | 6329 | 0 | 0 | 0.00% | 0.00% |  |
| B | 7534 | 6330 | 48 | 48 | 0.64% | 0.76% | 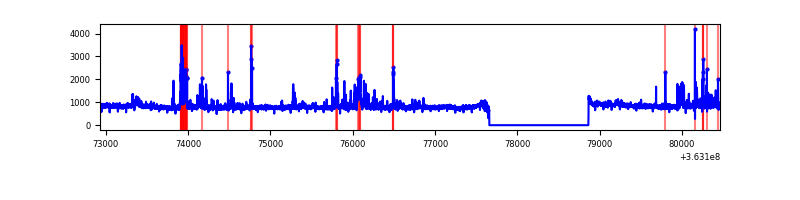 |
| C | 7534 | 6330 | 31 | 31 | 0.41% | 0.49% | 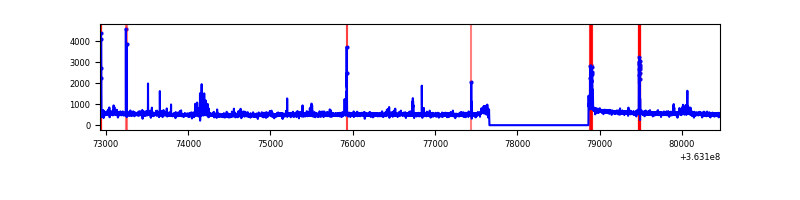 |
| D | 7534 | 6330 | 46 | 46 | 0.61% | 0.73% | 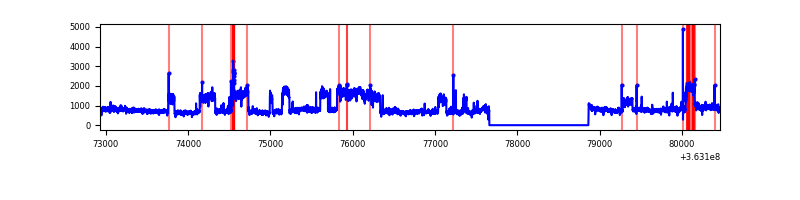 |
Top three noisy pixels from each quadrant. If the there are fewer than three noisy pixels in the level2.evt file, extra rows are filled as -1
| Pixel properties | Quadrant properties | ||||||
|---|---|---|---|---|---|---|---|
| Quadrant | DetID | PixID | Counts | Sigma | Mean | Median | Sigma |
| A | 13 | 254 | 11767 | 65.77 | 849 | 837 | 166.2 |
| A | 3 | 137 | 7916 | 42.6 | 849 | 837 | 166.2 |
| A | 0 | 226 | 7254 | 38.61 | 849 | 837 | 166.2 |
| B | 6 | 159 | 1704905 | 11029.52 | 822 | 804 | 154.5 |
| B | 4 | 80 | 189273 | 1219.84 | 822 | 804 | 154.5 |
| B | 0 | 190 | 132631 | 853.23 | 822 | 804 | 154.5 |
| C | 0 | 10 | 182669 | 1005.24 | 790 | 796 | 180.9 |
| C | 14 | 238 | 133138 | 731.47 | 790 | 796 | 180.9 |
| C | 10 | 22 | 86837 | 475.56 | 790 | 796 | 180.9 |
| D | 8 | 195 | 2806455 | 13561.32 | 809 | 794 | 206.9 |
| D | 2 | 250 | 42170 | 199.99 | 809 | 794 | 206.9 |
| D | 2 | 234 | 23161 | 108.11 | 809 | 794 | 206.9 |
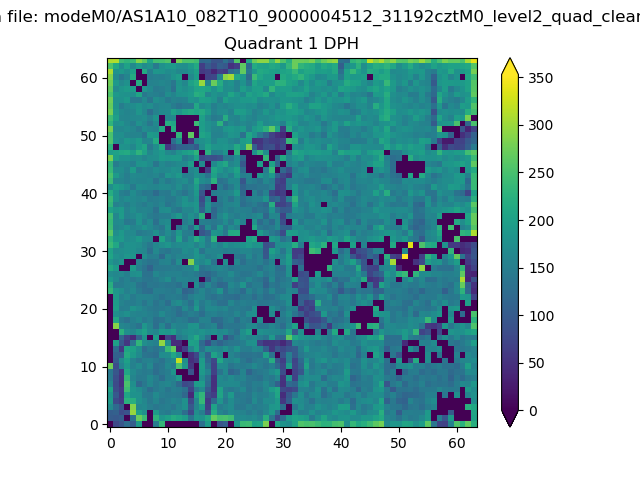
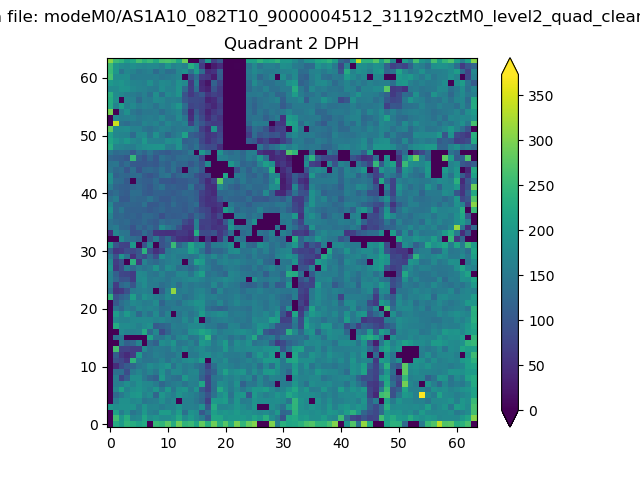
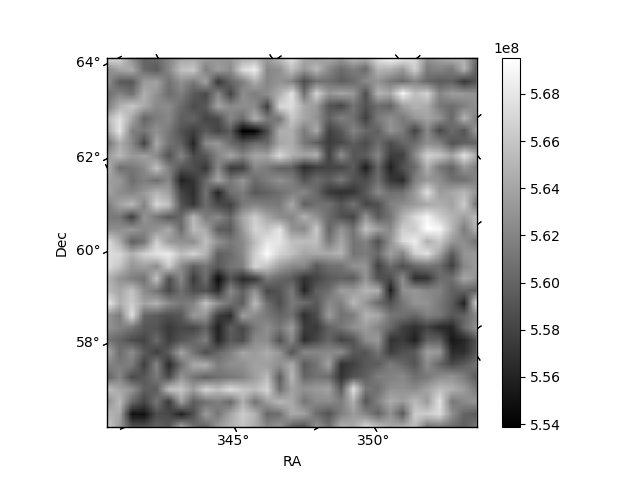
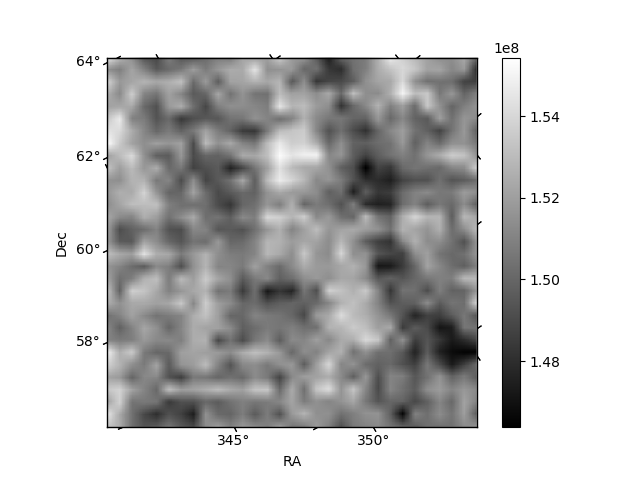
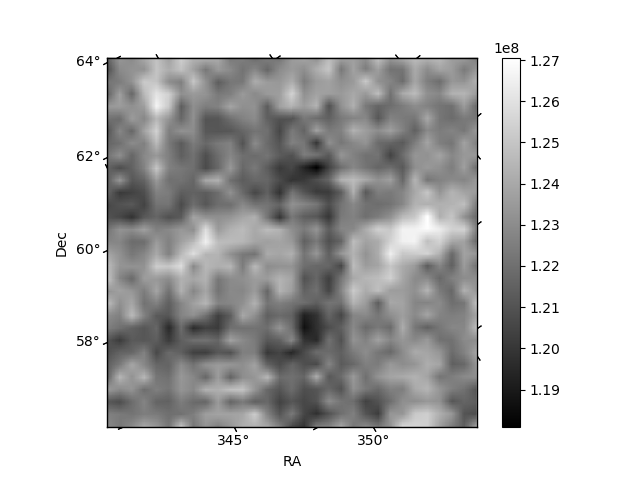
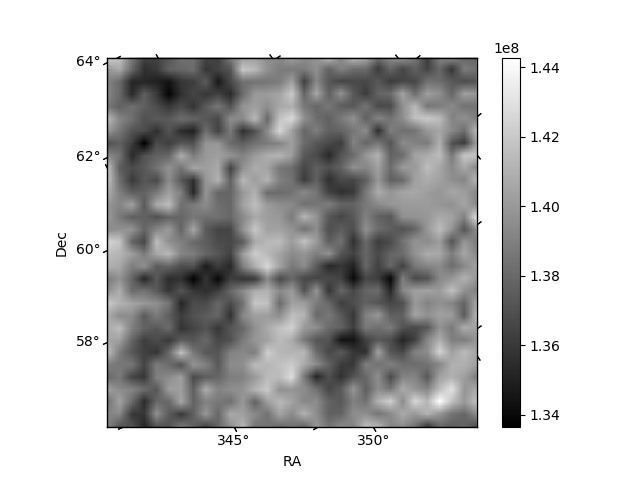
Histogram calculated using DETX and DETY for each event in the final _common_clean file
| Quadrant A | 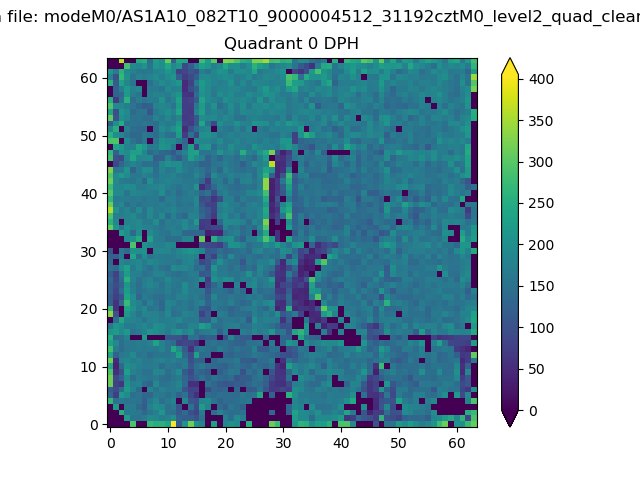 |
 |
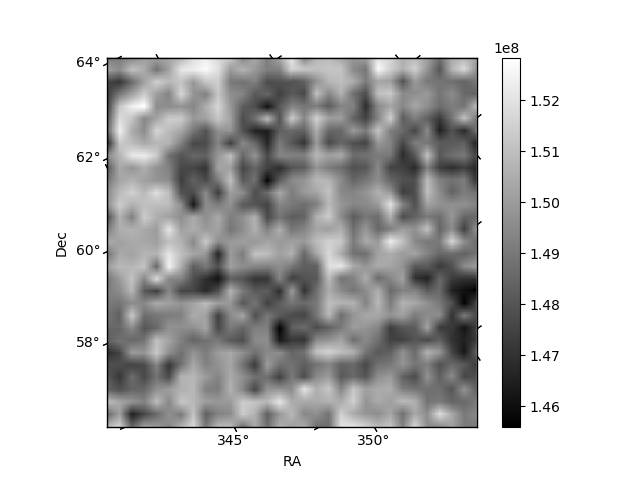
Quadrant B |
|---|---|---|---|
| Quadrant D | 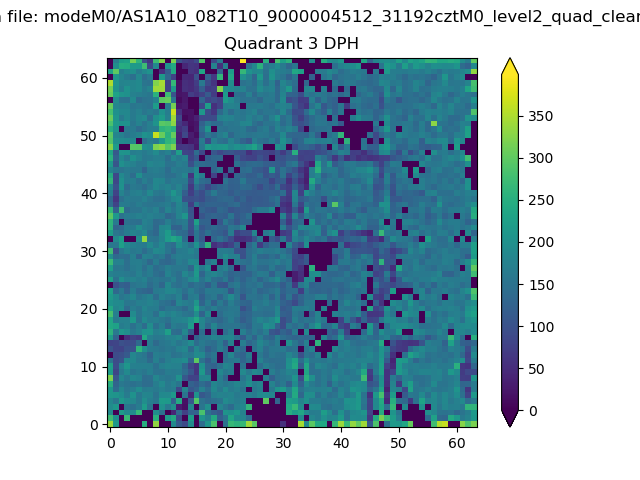 |
 |
Quadrant C |
| Plot type | Count rate plots | Images |
|---|---|---|
| Comparison with Poisson distribution Blue bars denote a histogram of data divided into 1 sec bins. Red curve is a Poisson curve with rate = median count rate of data. |
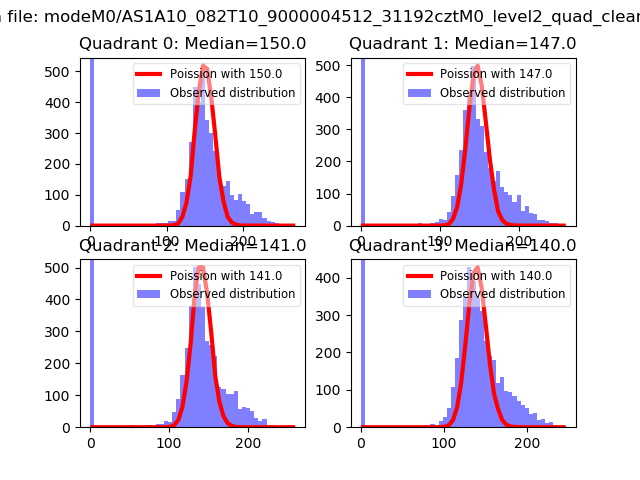 |
 |
| Quadrant-wise count rates Data is divided into 100 sec bins |
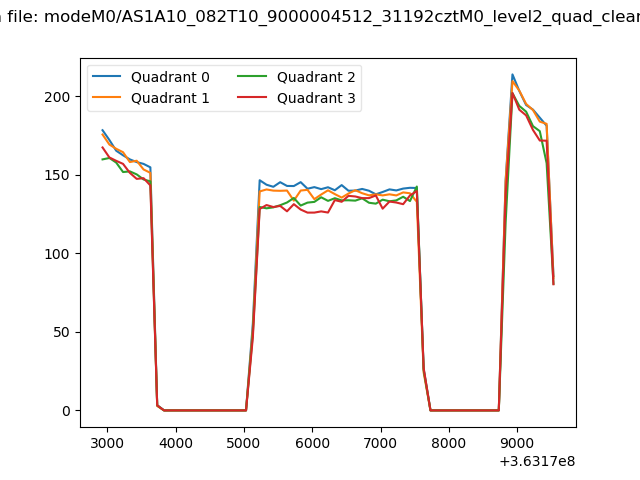 |
|
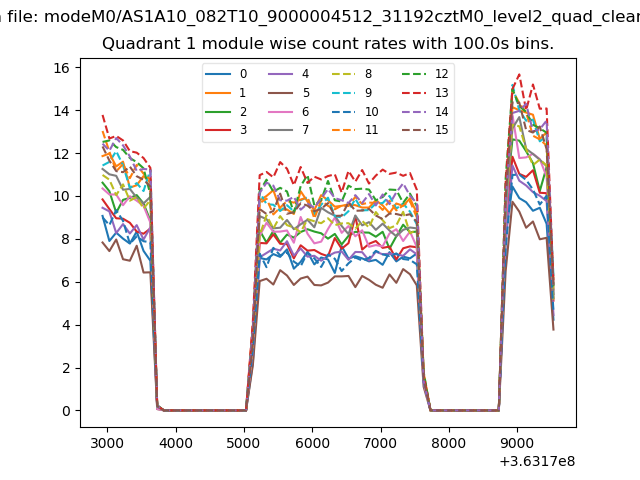
| Module-wise count rates for Quadrant A Data is divided into 100 sec bins |
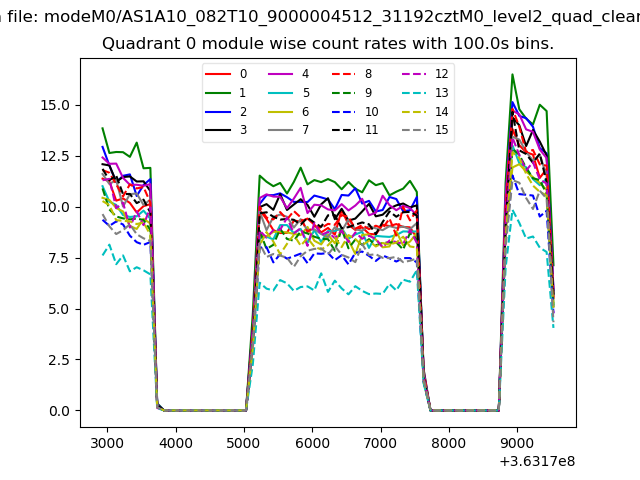 |
 |
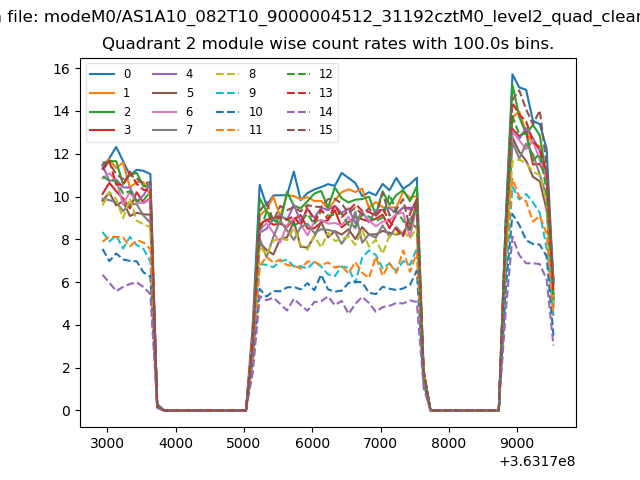
| Module-wise count rates for Quadrant B Data is divided into 100 sec bins |
 |
 |
| Module-wise count rates for Quadrant C Data is divided into 100 sec bins |
 |
 |
| Module-wise count rates for Quadrant D Data is divided into 100 sec bins |
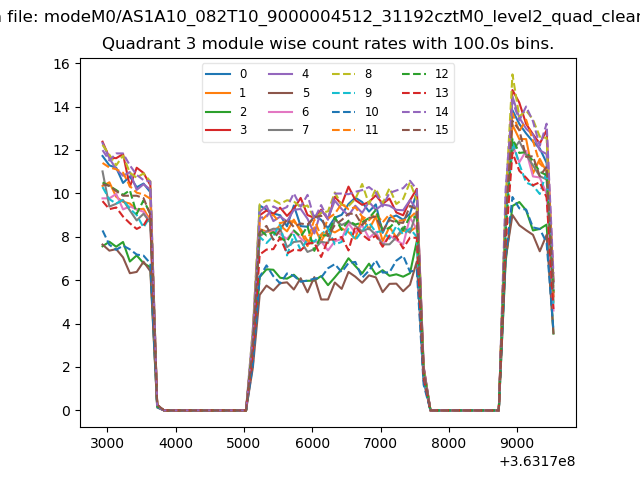 |
 |
| Parameter | Plot |
|---|---|
| CZT HV Monitor | 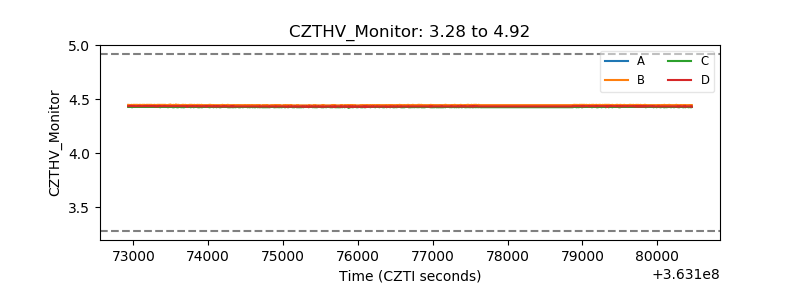 |
| D_VDD | 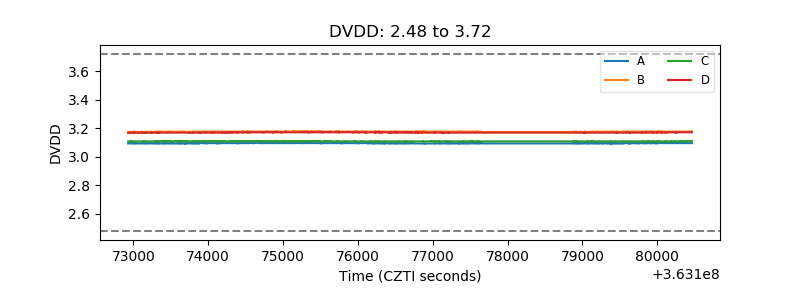 |
| Temperature 1 | 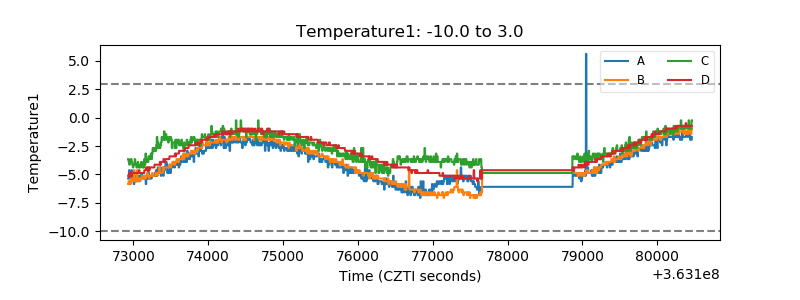 |
| Veto HV Monitor | 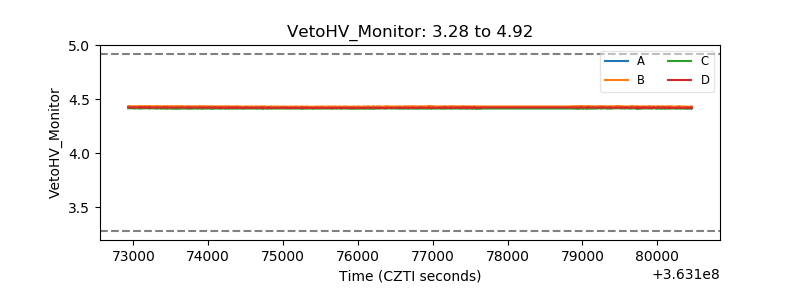 |
| Veto LLD | 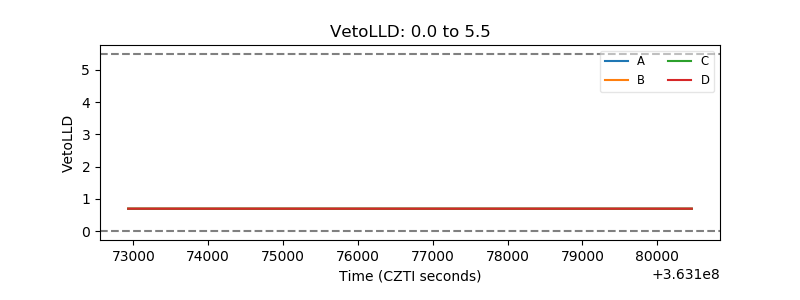 |
| Alpha Counter | 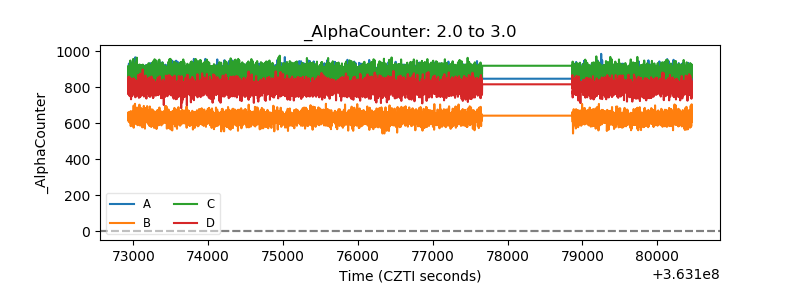 |
| _CPM_Rate | 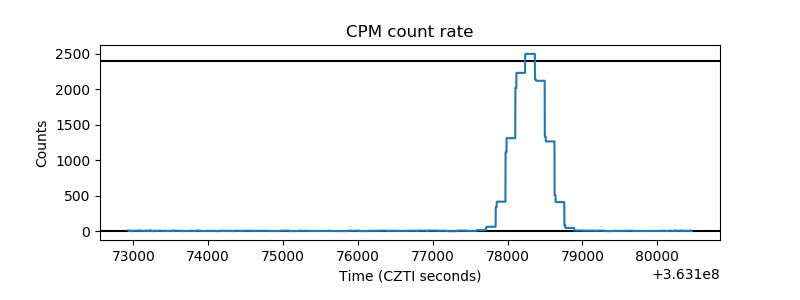 |
| CZT Counter | 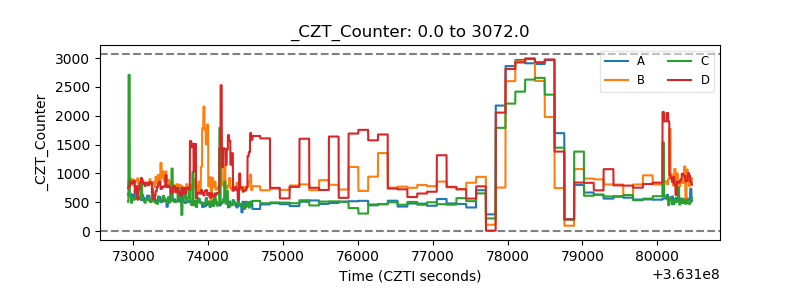 |
| +2.5 Volts monitor | 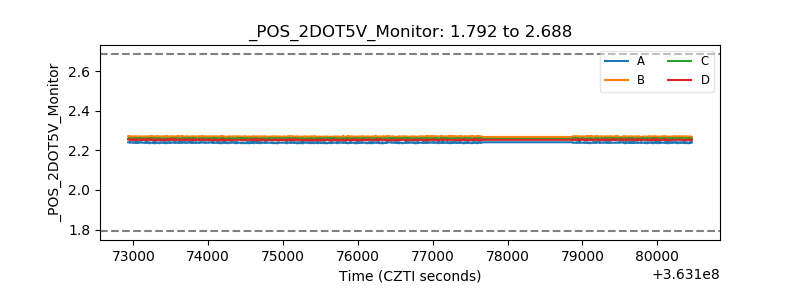 |
| +5 Volts monitor |  |
| _ROLL_ROT | 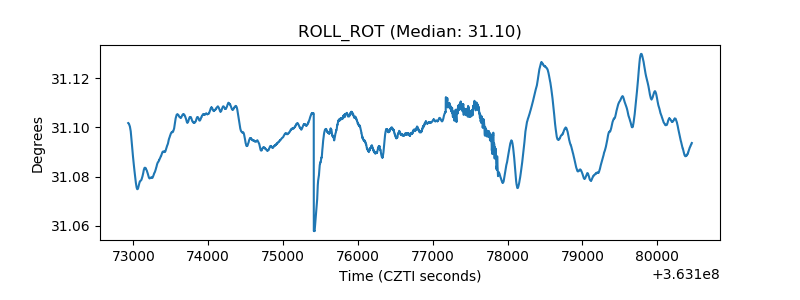 |
| _Roll_DEC | 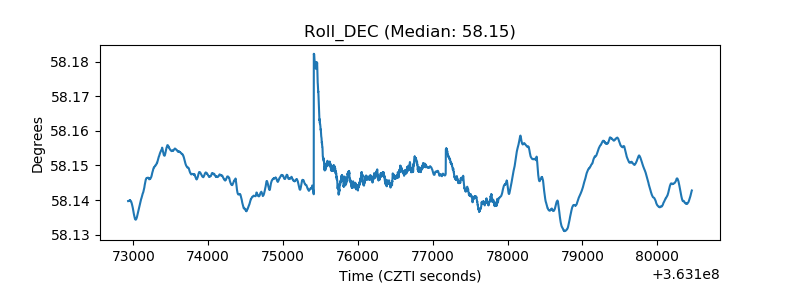 |
| _Roll_RA | 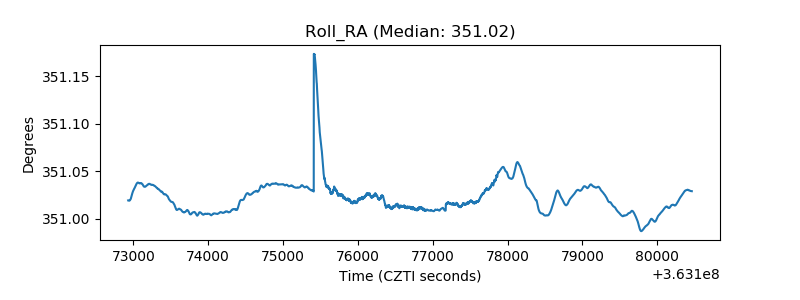 |
| Veto Counter | 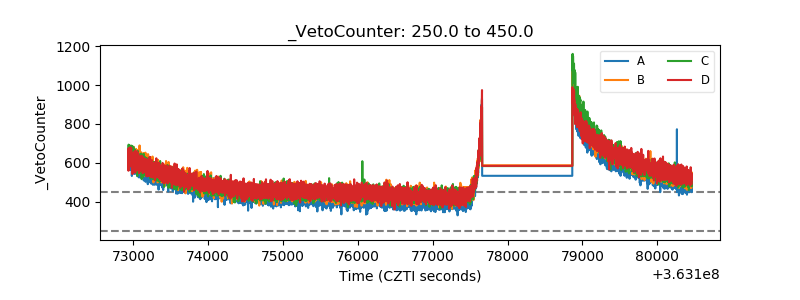 |