| Param | Original file | Final file |
|---|---|---|
| Filename | modeM0/AS1A10_082T10_9000004512_31193cztM0_level2.evt | modeM0/AS1A10_082T10_9000004512_31193cztM0_level2_quad_clean.evt |
| Size (bytes) | 637,545,600 | 81,561,600 |
| Size | 608.0 MB | 77.8 MB |
| Events in quadrant A | 3,305,384 | 537,844 |
| Events in quadrant B | 5,787,408 | 511,754 |
| Events in quadrant C | 3,465,706 | 503,474 |
| Events in quadrant D | 6,334,485 | 487,329 |
| Mode M0 | |||
|---|---|---|---|
| Quadrant | BADHDUFLAG | Total packets | Discarded packets |
| A | 0 | 13588 | 1 |
| B | 0 | 21087 | 1 |
| C | 0 | 13994 | 1 |
| D | 0 | 22905 | 1 |
| Mode SS | |||
|---|---|---|---|
| Quadrant | BADHDUFLAG | Total packets | Discarded packets |
| A | 0 | 124 | 0 |
| B | 0 | 124 | 0 |
| C | 0 | 124 | 0 |
| D | 0 | 124 | 0 |
| Mode M9 | |||
|---|---|---|---|
| Quadrant | BADHDUFLAG | Total packets | Discarded packets |
| A | 0 | 13 | 0 |
| B | 0 | 13 | 0 |
| C | 0 | 13 | 0 |
| D | 0 | 13 | 0 |
| Quadrant | Total seconds | Saturated seconds | Saturation percentage |
|---|---|---|---|
| A | 6153 | 90 | 1.462701% |
| B | 6154 | 428 | 6.954826% |
| C | 6154 | 160 | 2.599935% |
| D | 6154 | 357 | 5.801105% |
Noise dominated data is calculated using 1-second bins in cleaned event files. If a bin has >2000 counts, and if more than 50% of those come from <1% of pixels, then it is considered to be noise-dominated and hence unusable.
| Quadrant | # 1 sec bins | Bins with >0 counts | Bins with >2000 counts | High rate bins dominated by noise | Noise dominated (total time) | Noise dominated (detector-on time) | Marked lightcurve |
|---|---|---|---|---|---|---|---|
| A | 7428 | 6154 | 0 | 0 | 0.00% | 0.00% |  |
| B | 7429 | 6155 | 166 | 166 | 2.23% | 2.70% |  |
| C | 7429 | 6155 | 20 | 20 | 0.27% | 0.32% | 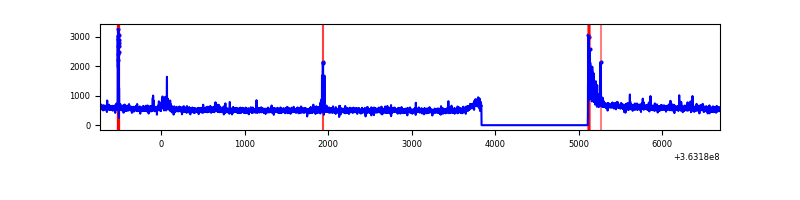 |
| D | 7429 | 6155 | 341 | 341 | 4.59% | 5.54% | 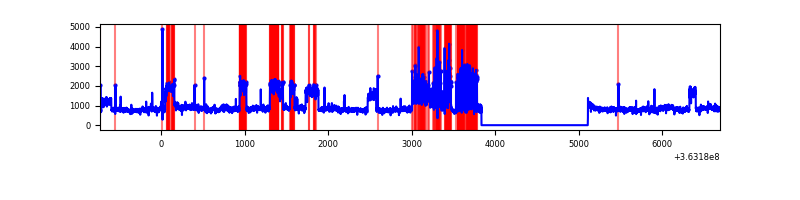 |
Top three noisy pixels from each quadrant. If the there are fewer than three noisy pixels in the level2.evt file, extra rows are filled as -1
| Pixel properties | Quadrant properties | ||||||
|---|---|---|---|---|---|---|---|
| Quadrant | DetID | PixID | Counts | Sigma | Mean | Median | Sigma |
| A | 13 | 254 | 11382 | 62.81 | 855 | 842 | 167.8 |
| A | 3 | 137 | 7680 | 40.75 | 855 | 842 | 167.8 |
| A | 0 | 226 | 7507 | 39.72 | 855 | 842 | 167.8 |
| B | 6 | 159 | 1668740 | 10960.81 | 818 | 800 | 152.2 |
| B | 4 | 80 | 576595 | 3783.82 | 818 | 800 | 152.2 |
| B | 0 | 190 | 200734 | 1313.86 | 818 | 800 | 152.2 |
| C | 14 | 238 | 132303 | 717.34 | 803 | 811 | 183.3 |
| C | 0 | 10 | 81103 | 438.03 | 803 | 811 | 183.3 |
| C | 10 | 22 | 78799 | 425.46 | 803 | 811 | 183.3 |
| D | 8 | 195 | 2444774 | 12036.31 | 808 | 792 | 203.1 |
| D | 12 | 218 | 517397 | 2544.21 | 808 | 792 | 203.1 |
| D | 2 | 69 | 131211 | 642.3 | 808 | 792 | 203.1 |
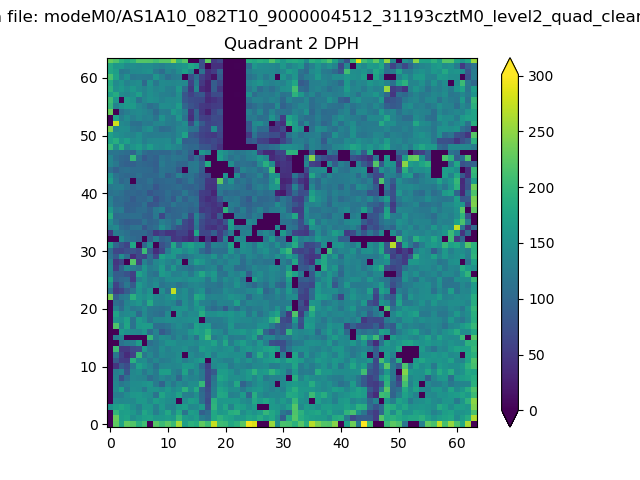
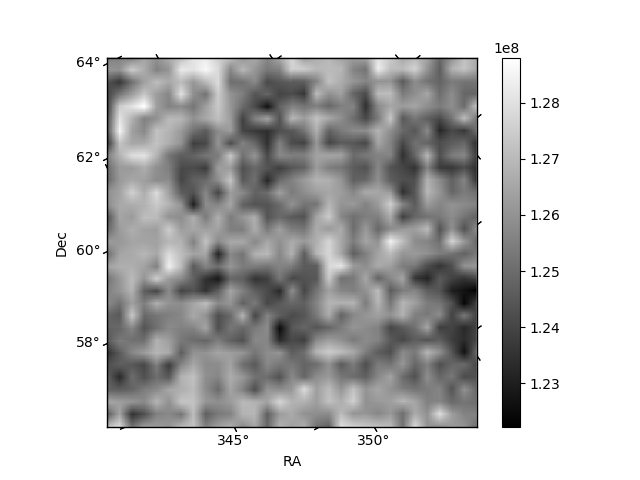
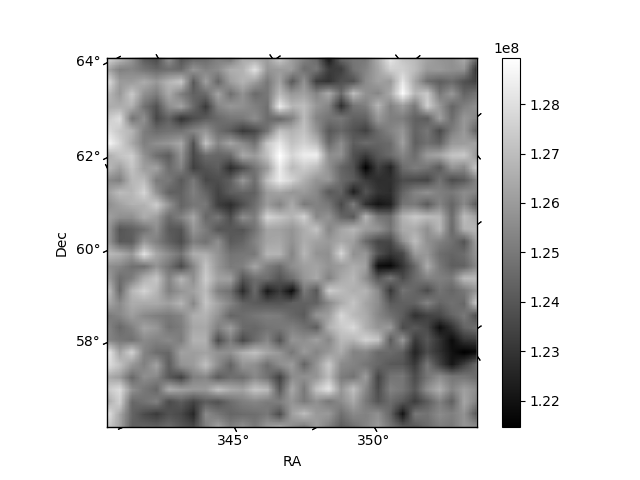
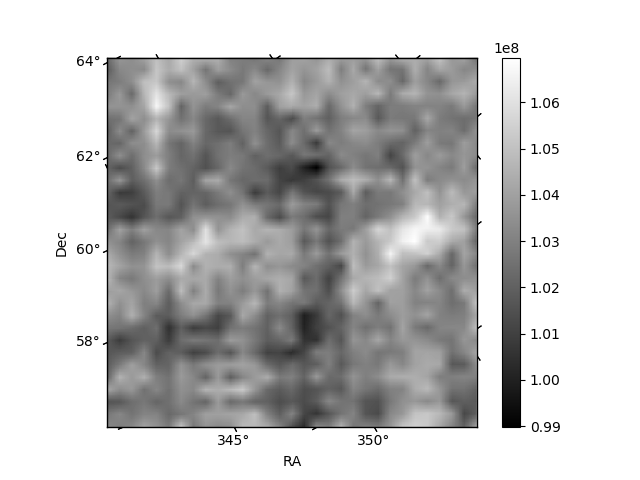
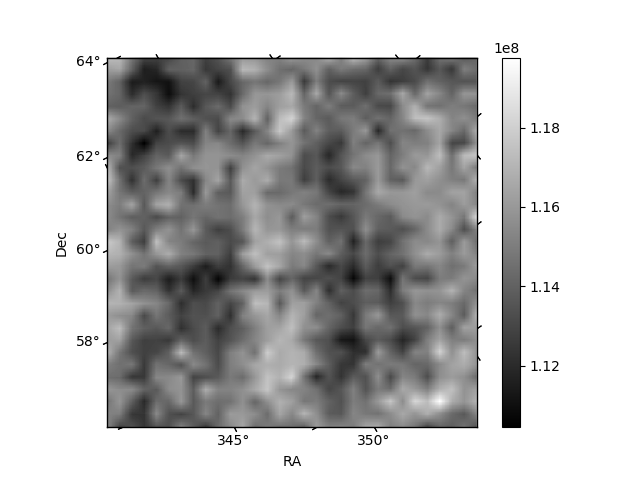
Histogram calculated using DETX and DETY for each event in the final _common_clean file
| Quadrant A | 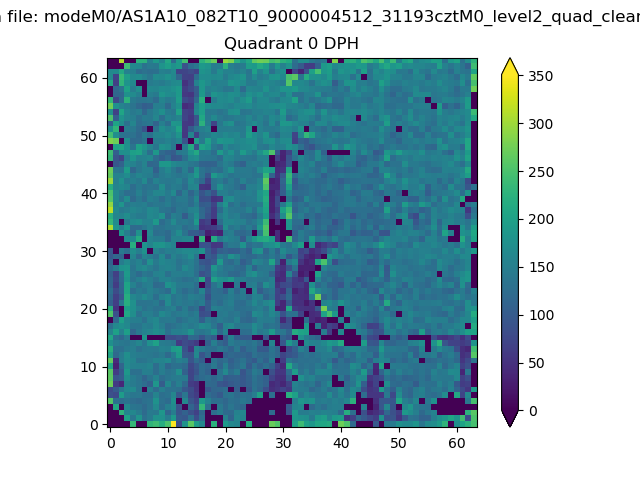 |
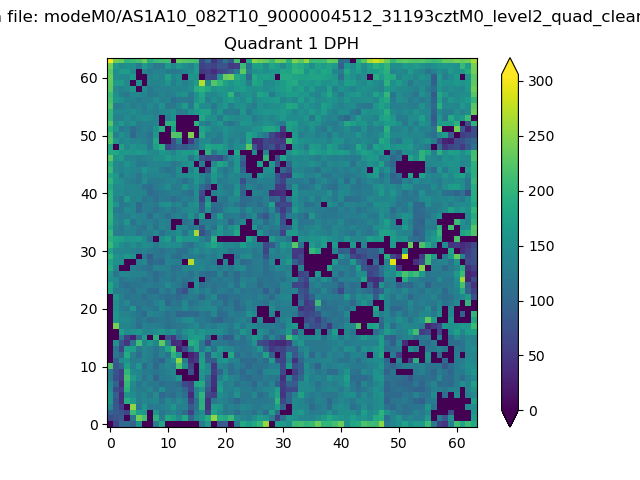 |
Quadrant B |
|---|---|---|---|
| Quadrant D | 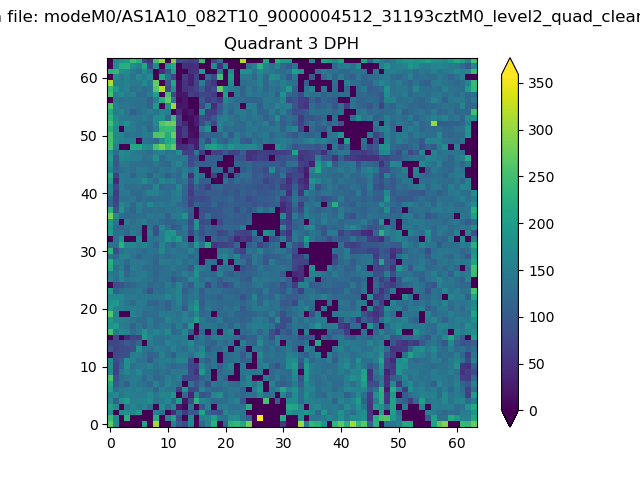 |
 |
Quadrant C |
| Plot type | Count rate plots | Images |
|---|---|---|
| Comparison with Poisson distribution Blue bars denote a histogram of data divided into 1 sec bins. Red curve is a Poisson curve with rate = median count rate of data. |
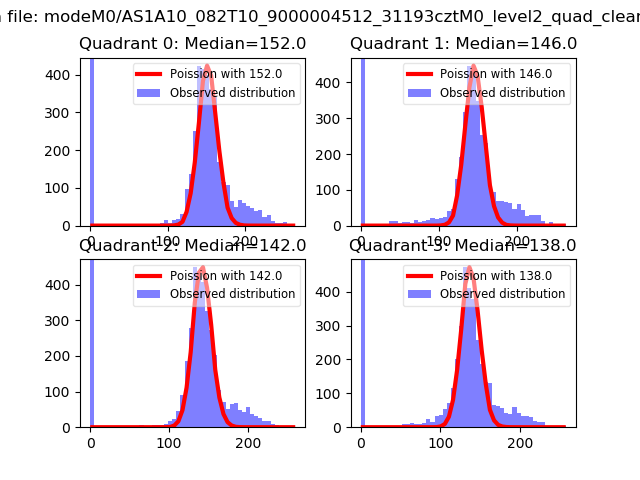 |
 |
| Quadrant-wise count rates Data is divided into 100 sec bins |
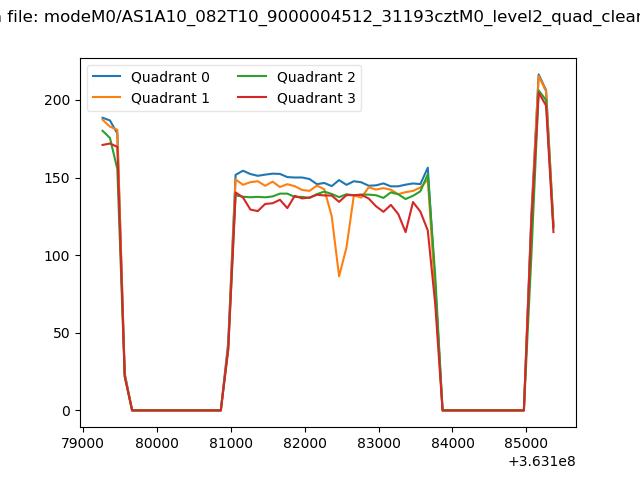 |
|
| Module-wise count rates for Quadrant A Data is divided into 100 sec bins |
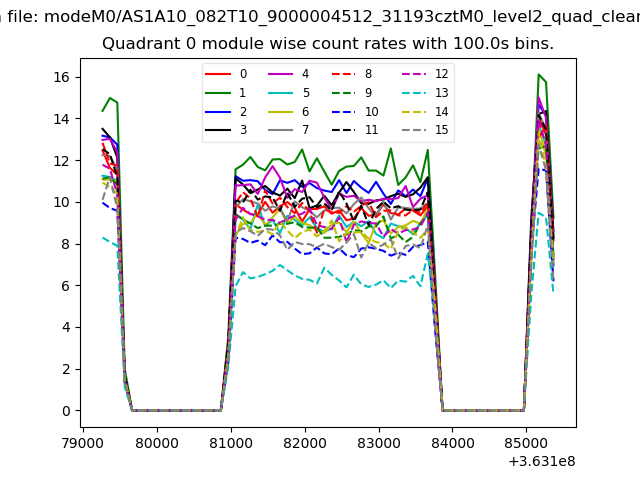 |
 |
| Module-wise count rates for Quadrant B Data is divided into 100 sec bins |
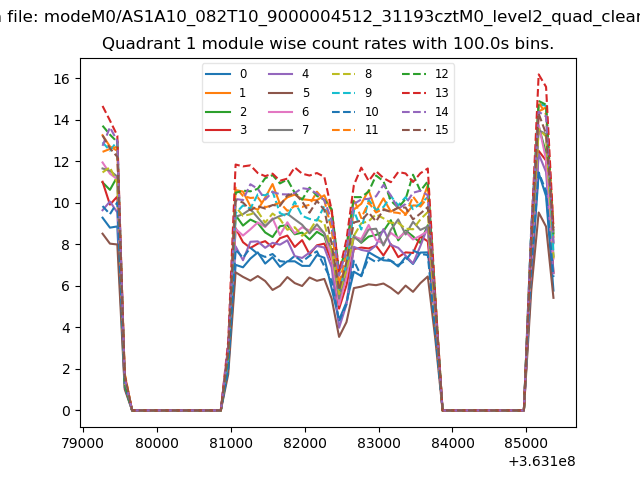 |
 |
| Module-wise count rates for Quadrant C Data is divided into 100 sec bins |
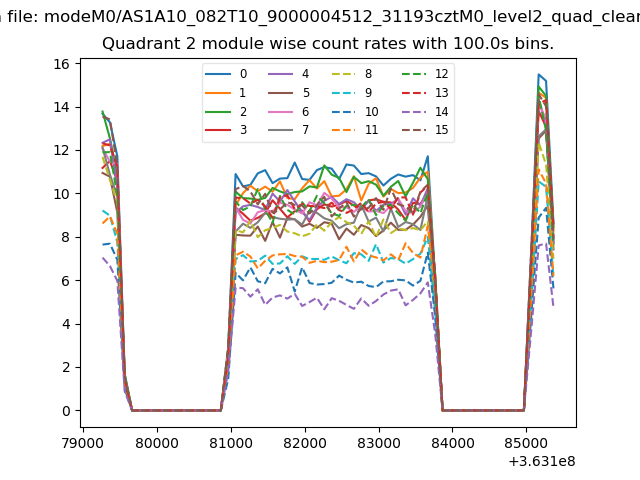 |
 |
| Module-wise count rates for Quadrant D Data is divided into 100 sec bins |
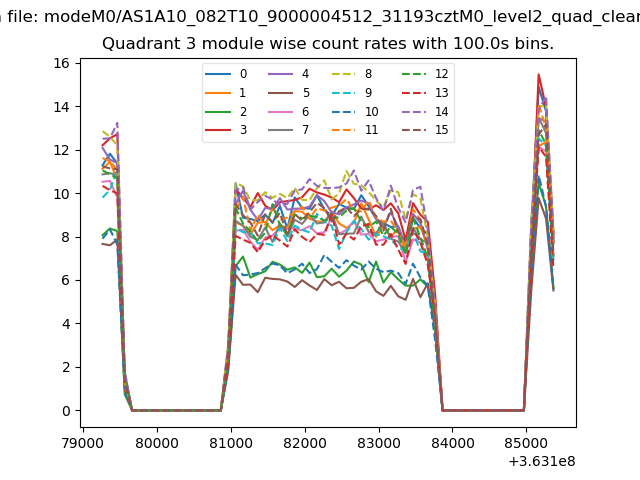 |
 |
| Parameter | Plot |
|---|---|
| CZT HV Monitor | 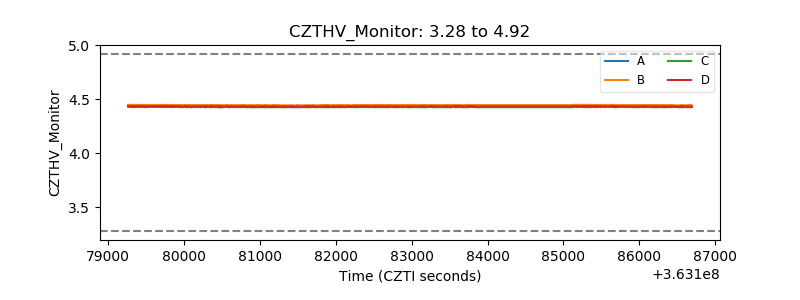 |
| D_VDD | 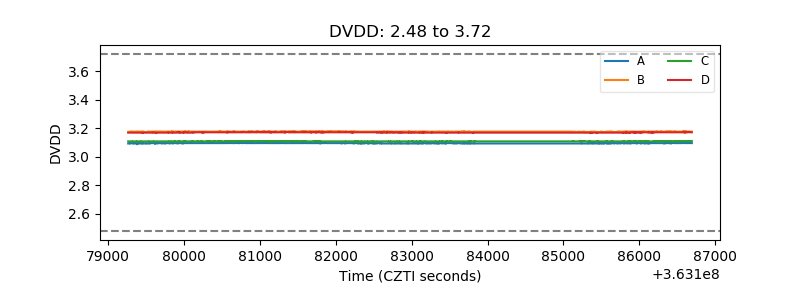 |
| Temperature 1 | 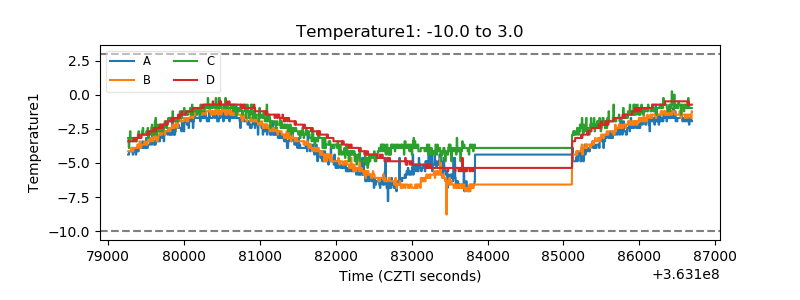 |
| Veto HV Monitor | 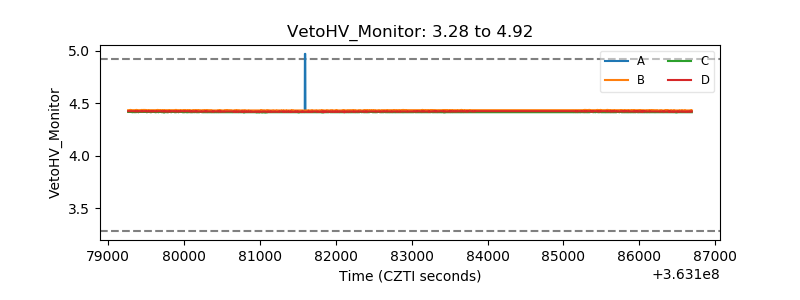 |
| Veto LLD | 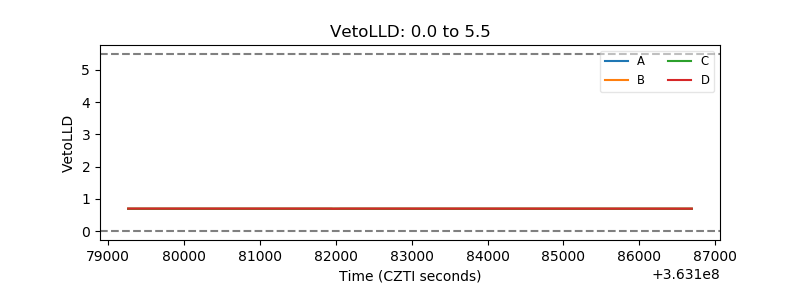 |
| Alpha Counter | 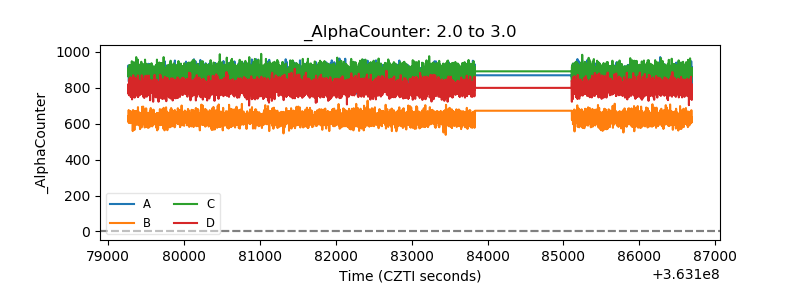 |
| _CPM_Rate | 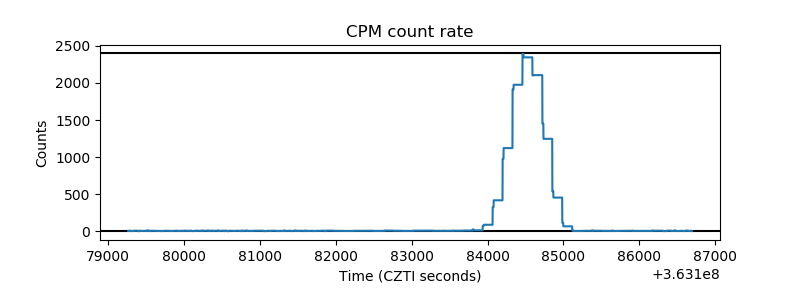 |
| CZT Counter | 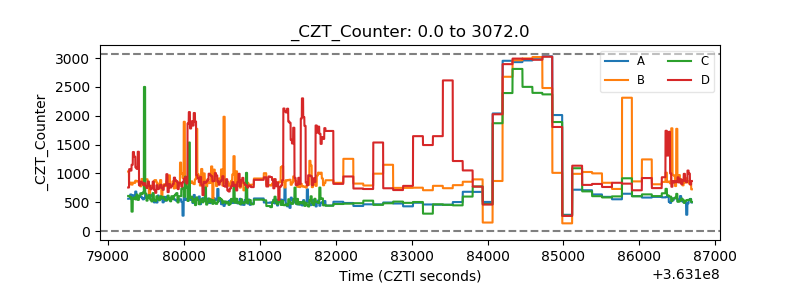 |
| +2.5 Volts monitor |  |
| +5 Volts monitor |  |
| _ROLL_ROT | 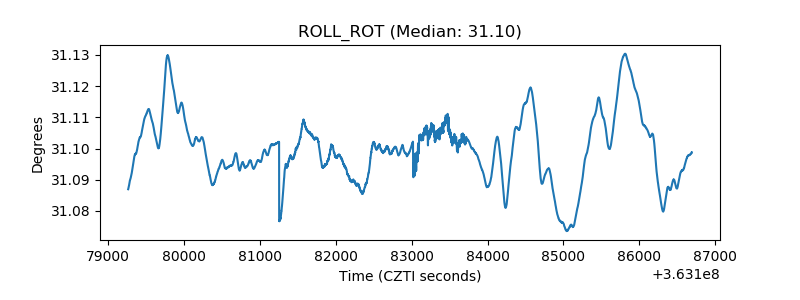 |
| _Roll_DEC | 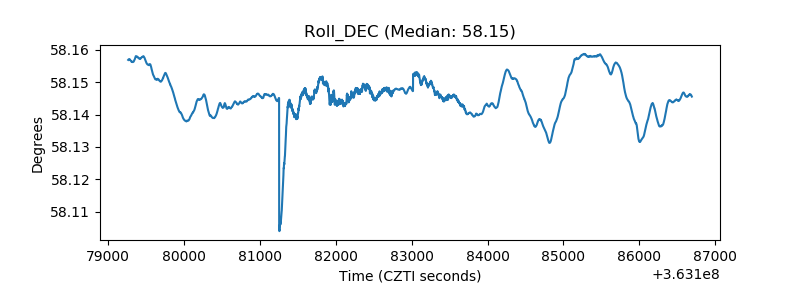 |
| _Roll_RA | 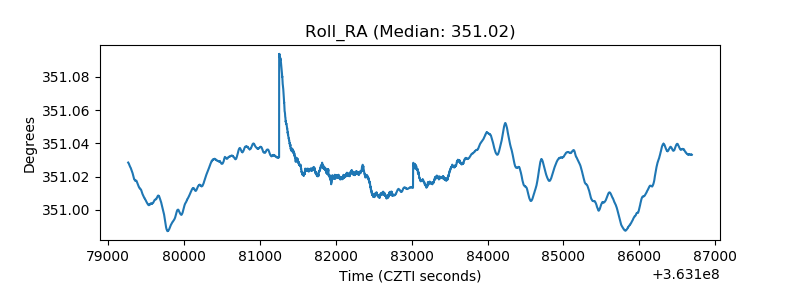 |
| Veto Counter | 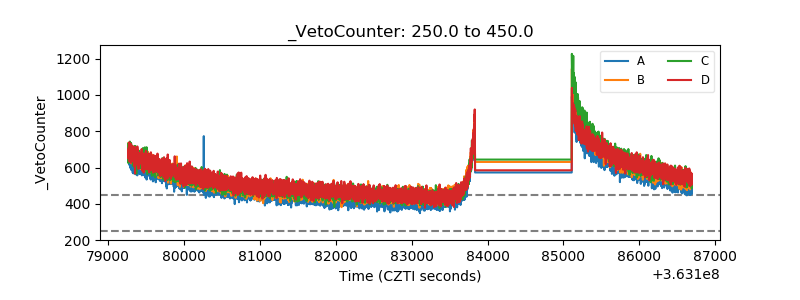 |