| Param | Original file | Final file |
|---|---|---|
| Filename | modeM0/AS1A10_082T10_9000004512_31194cztM0_level2.evt | modeM0/AS1A10_082T10_9000004512_31194cztM0_level2_quad_clean.evt |
| Size (bytes) | 674,055,360 | 87,770,880 |
| Size | 642.8 MB | 83.7 MB |
| Events in quadrant A | 3,550,861 | 574,896 |
| Events in quadrant B | 6,239,486 | 561,014 |
| Events in quadrant C | 3,788,336 | 542,822 |
| Events in quadrant D | 6,396,710 | 525,783 |
| Mode M0 | |||
|---|---|---|---|
| Quadrant | BADHDUFLAG | Total packets | Discarded packets |
| A | 0 | 14654 | 3 |
| B | 0 | 22695 | 2 |
| C | 0 | 15327 | 2 |
| D | 0 | 23571 | 2 |
| Mode SS | |||
|---|---|---|---|
| Quadrant | BADHDUFLAG | Total packets | Discarded packets |
| A | 0 | 132 | 0 |
| B | 0 | 132 | 0 |
| C | 0 | 132 | 0 |
| D | 0 | 132 | 0 |
| Mode M9 | |||
|---|---|---|---|
| Quadrant | BADHDUFLAG | Total packets | Discarded packets |
| A | 0 | 15 | 0 |
| B | 0 | 16 | 0 |
| C | 0 | 16 | 0 |
| D | 0 | 16 | 0 |
| Quadrant | Total seconds | Saturated seconds | Saturation percentage |
|---|---|---|---|
| A | 6497 | 108 | 1.662306% |
| B | 6497 | 595 | 9.158073% |
| C | 6497 | 211 | 3.247653% |
| D | 6497 | 348 | 5.356318% |
Noise dominated data is calculated using 1-second bins in cleaned event files. If a bin has >2000 counts, and if more than 50% of those come from <1% of pixels, then it is considered to be noise-dominated and hence unusable.
| Quadrant | # 1 sec bins | Bins with >0 counts | Bins with >2000 counts | High rate bins dominated by noise | Noise dominated (total time) | Noise dominated (detector-on time) | Marked lightcurve |
|---|---|---|---|---|---|---|---|
| A | 7802 | 6498 | 0 | 0 | 0.00% | 0.00% | 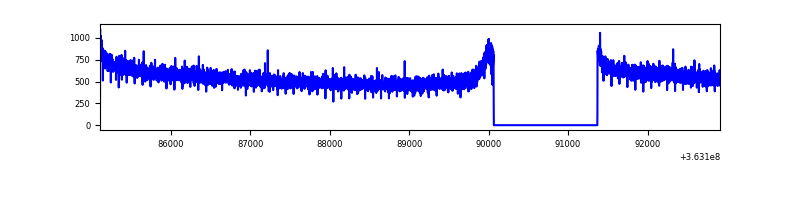 |
| B | 7802 | 6498 | 272 | 272 | 3.49% | 4.19% | 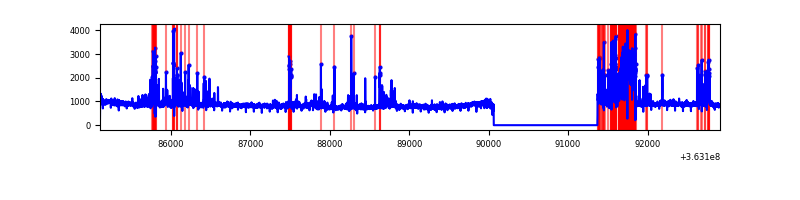 |
| C | 7802 | 6498 | 15 | 15 | 0.19% | 0.23% | 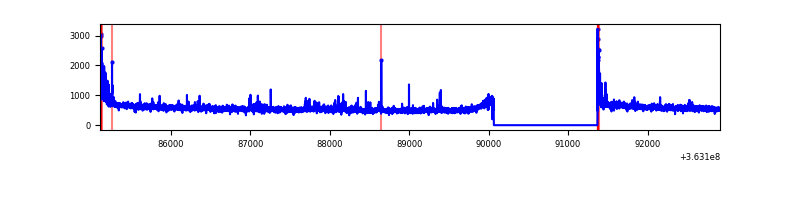 |
| D | 7802 | 6498 | 222 | 222 | 2.85% | 3.42% | 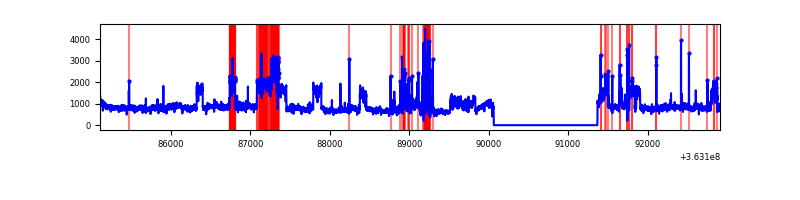 |
Top three noisy pixels from each quadrant. If the there are fewer than three noisy pixels in the level2.evt file, extra rows are filled as -1
| Pixel properties | Quadrant properties | ||||||
|---|---|---|---|---|---|---|---|
| Quadrant | DetID | PixID | Counts | Sigma | Mean | Median | Sigma |
| A | 13 | 254 | 13010 | 66.64 | 920 | 906 | 181.6 |
| A | 3 | 137 | 8292 | 40.66 | 920 | 906 | 181.6 |
| A | 0 | 226 | 8041 | 39.28 | 920 | 906 | 181.6 |
| B | 6 | 159 | 1769513 | 11075.22 | 866 | 849 | 159.7 |
| B | 4 | 80 | 818673 | 5121.14 | 866 | 849 | 159.7 |
| B | 0 | 190 | 179692 | 1119.9 | 866 | 849 | 159.7 |
| C | 0 | 10 | 177098 | 891.54 | 869 | 877 | 197.7 |
| C | 14 | 238 | 148031 | 744.49 | 869 | 877 | 197.7 |
| C | 4 | 175 | 46406 | 230.34 | 869 | 877 | 197.7 |
| D | 8 | 195 | 2693290 | 11873.61 | 872 | 860 | 226.8 |
| D | 2 | 250 | 239265 | 1051.37 | 872 | 860 | 226.8 |
| D | 2 | 69 | 47542 | 205.87 | 872 | 860 | 226.8 |
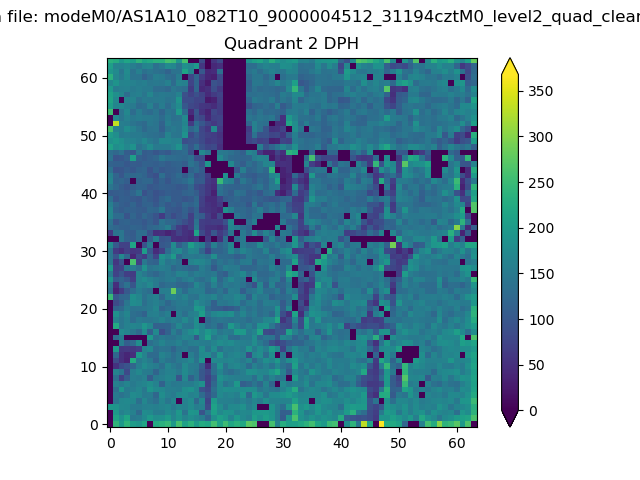
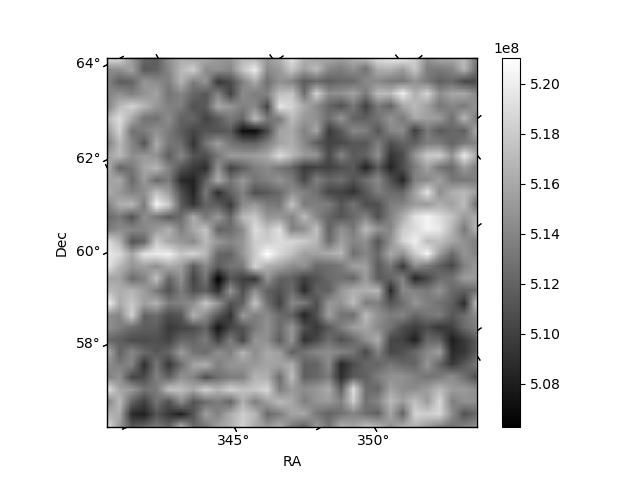
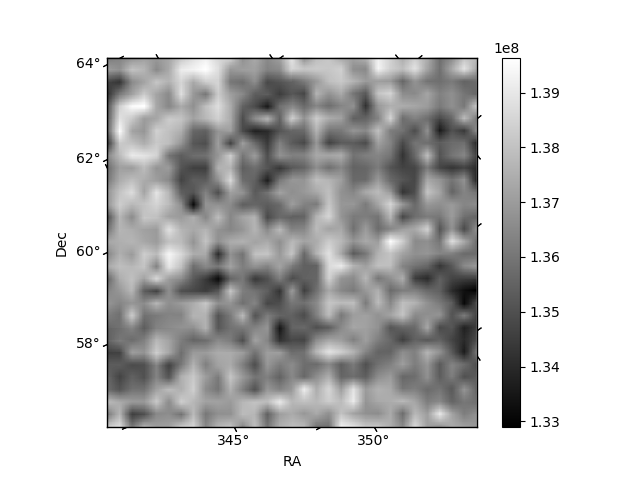
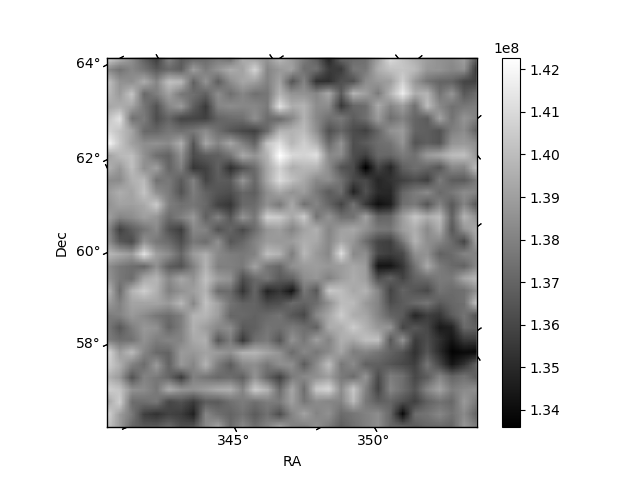
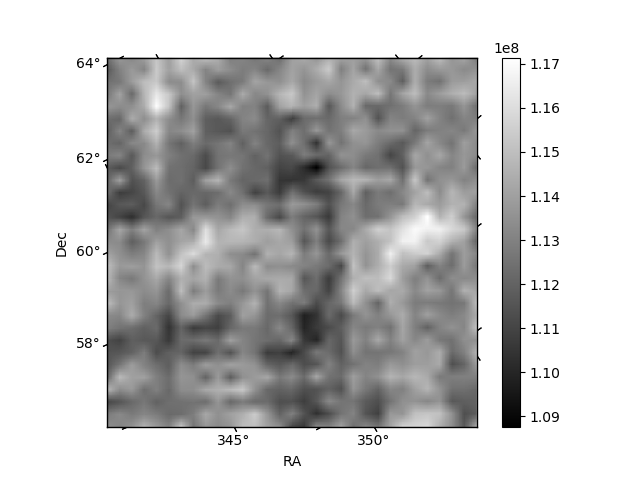
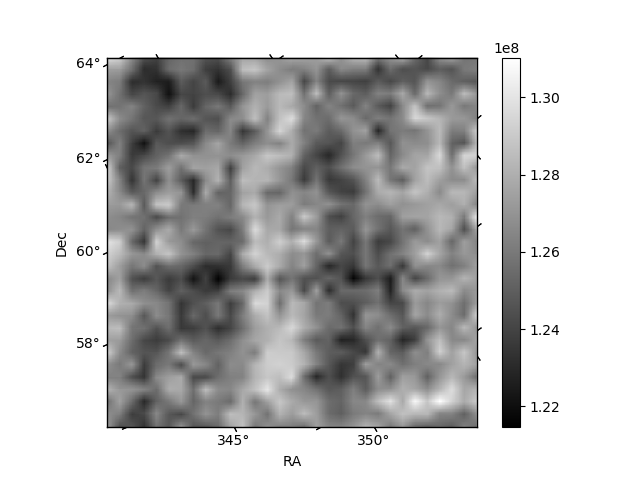
Histogram calculated using DETX and DETY for each event in the final _common_clean file
| Quadrant A | 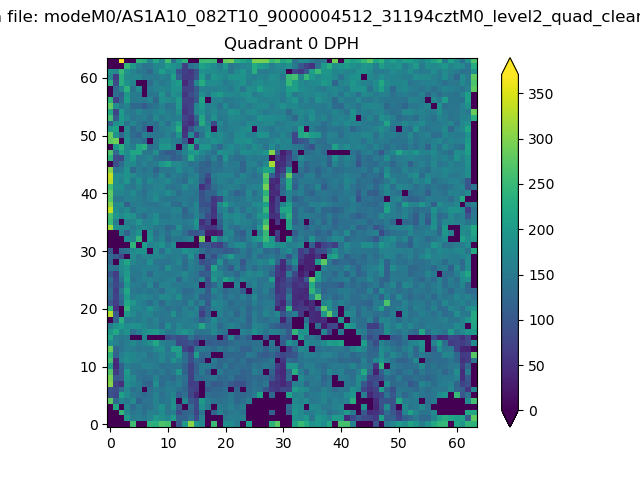 |
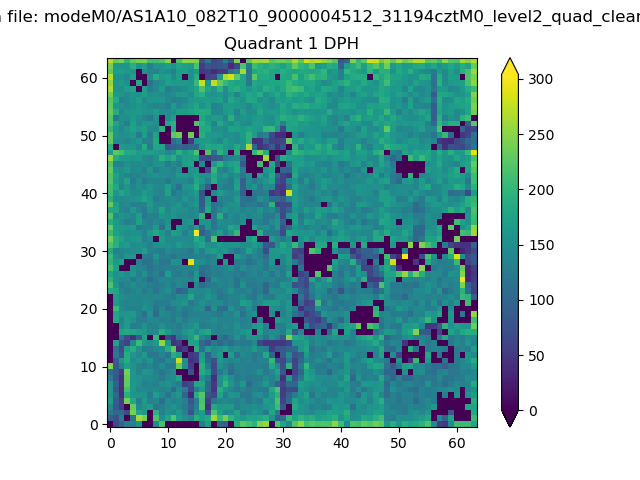 |
Quadrant B |
|---|---|---|---|
| Quadrant D | 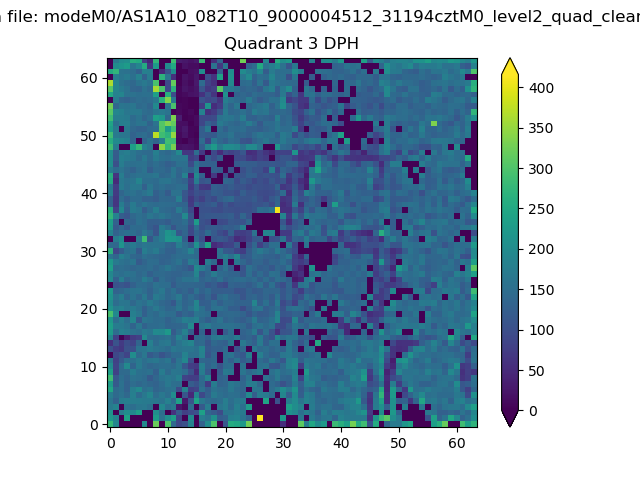 |
 |
Quadrant C |
| Plot type | Count rate plots | Images |
|---|---|---|
| Comparison with Poisson distribution Blue bars denote a histogram of data divided into 1 sec bins. Red curve is a Poisson curve with rate = median count rate of data. |
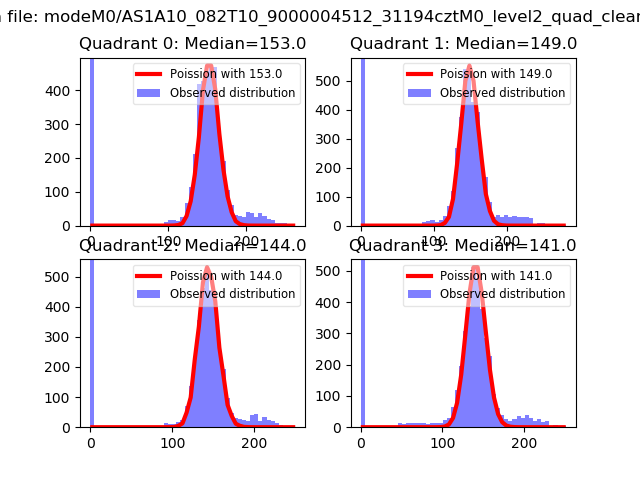 |
 |
| Quadrant-wise count rates Data is divided into 100 sec bins |
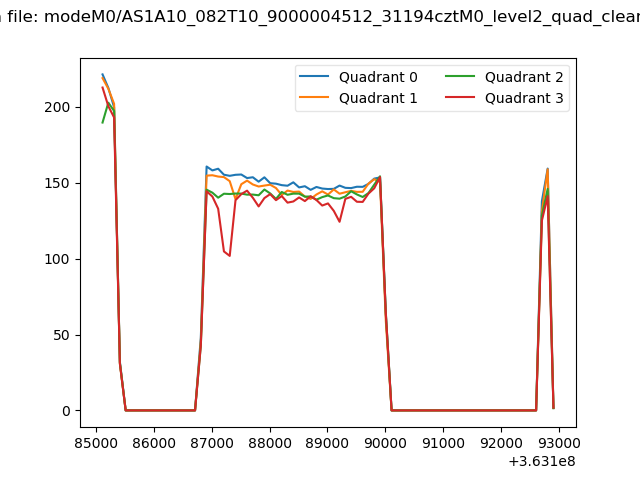 |
|
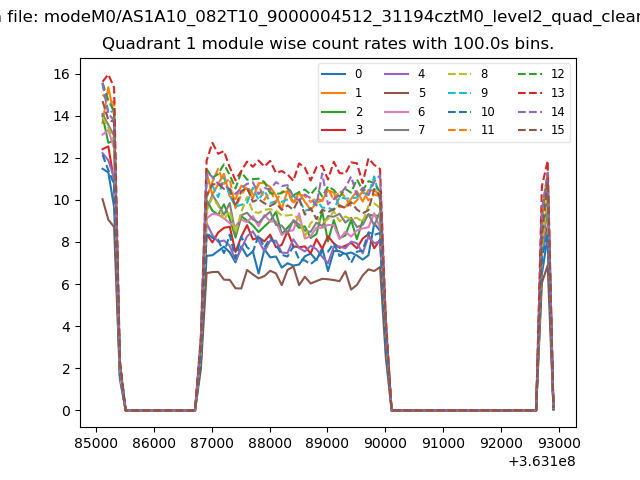
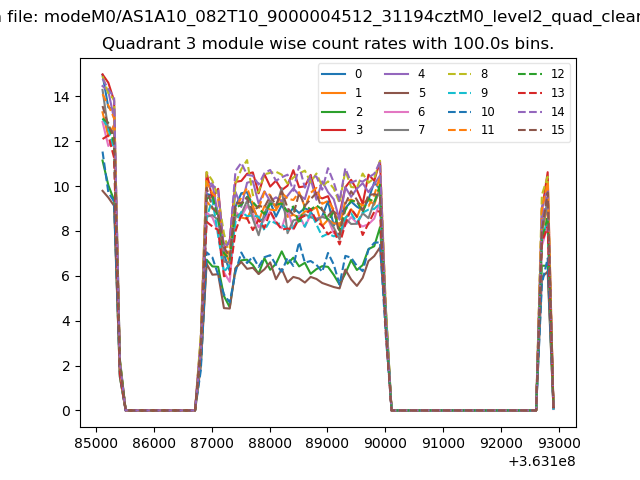
| Module-wise count rates for Quadrant A Data is divided into 100 sec bins |
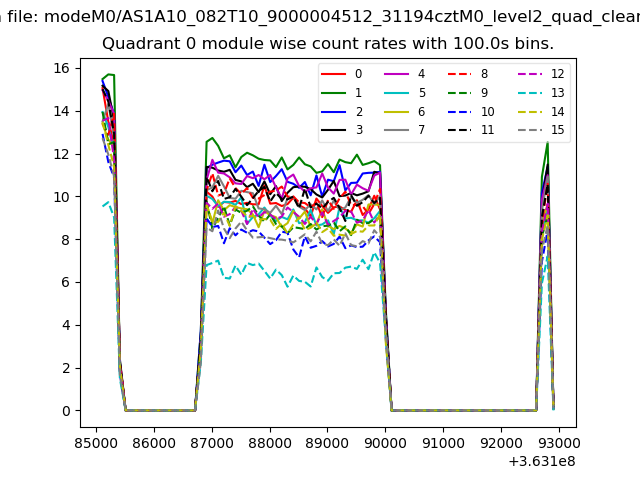 |
 |
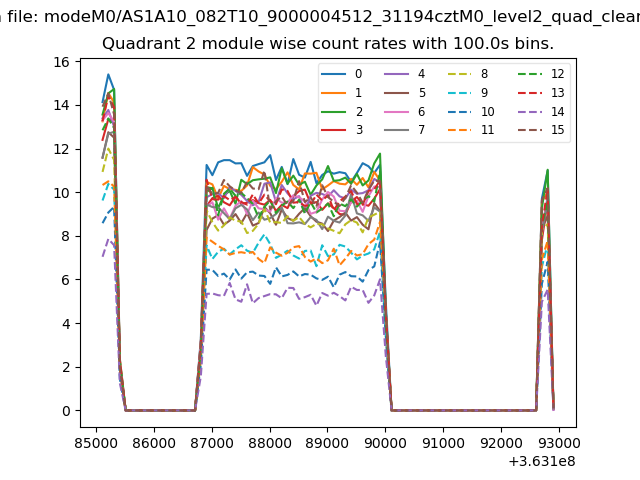
| Module-wise count rates for Quadrant B Data is divided into 100 sec bins |
 |
 |
| Module-wise count rates for Quadrant C Data is divided into 100 sec bins |
 |
 |
| Module-wise count rates for Quadrant D Data is divided into 100 sec bins |
 |
 |
| Parameter | Plot |
|---|---|
| CZT HV Monitor | 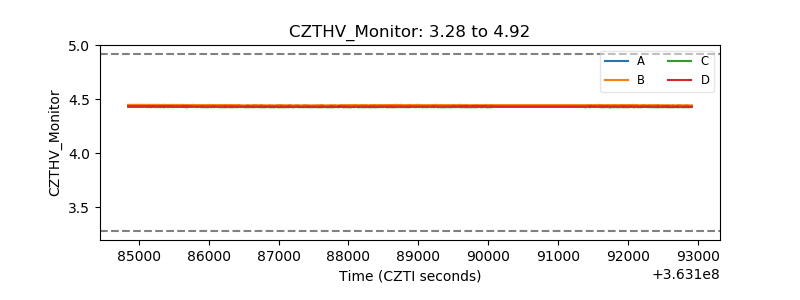 |
| D_VDD |  |
| Temperature 1 | 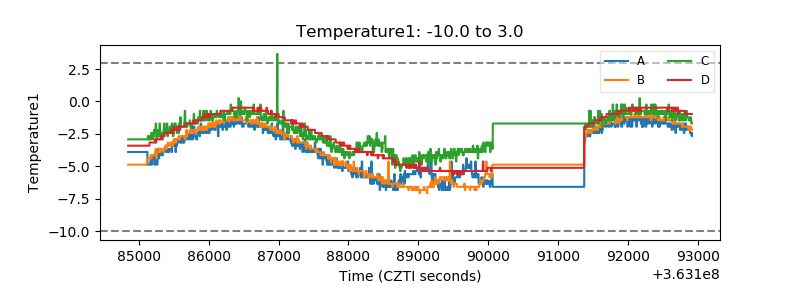 |
| Veto HV Monitor |  |
| Veto LLD | 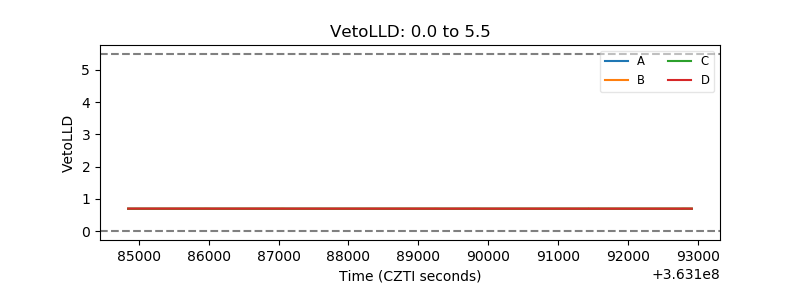 |
| Alpha Counter | 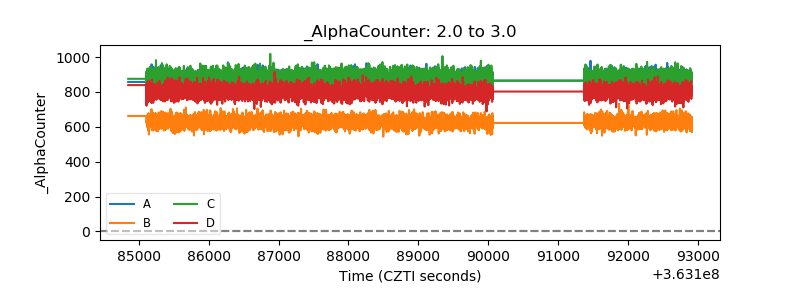 |
| _CPM_Rate | 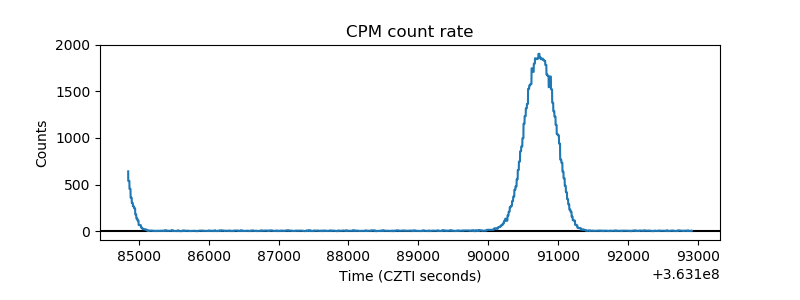 |
| CZT Counter | 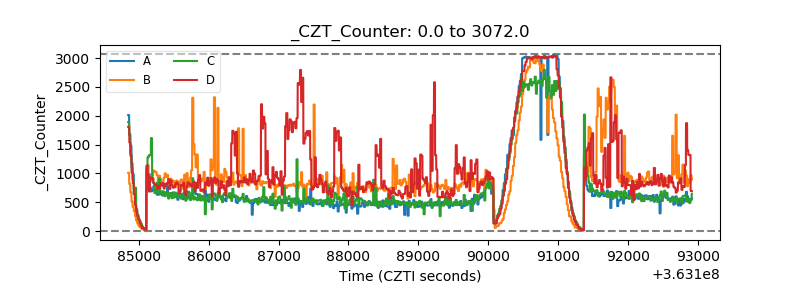 |
| +2.5 Volts monitor |  |
| +5 Volts monitor |  |
| _ROLL_ROT | 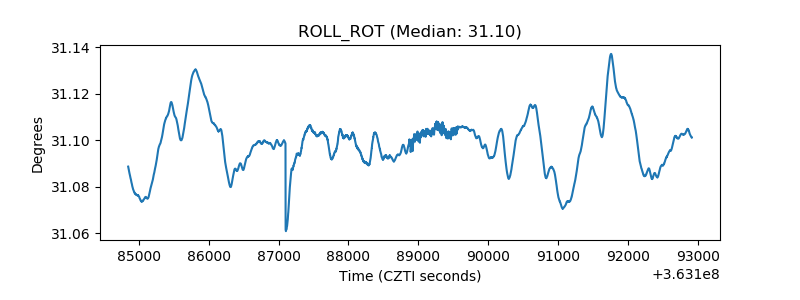 |
| _Roll_DEC | 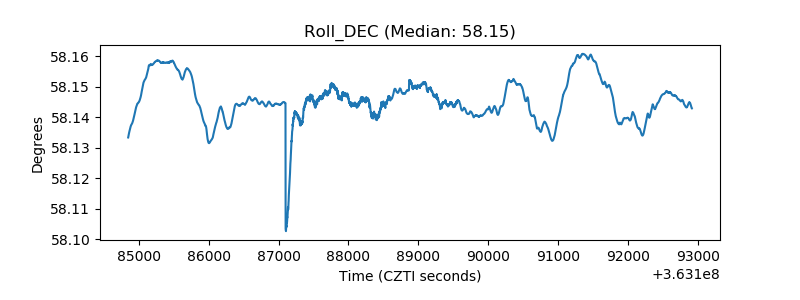 |
| _Roll_RA | 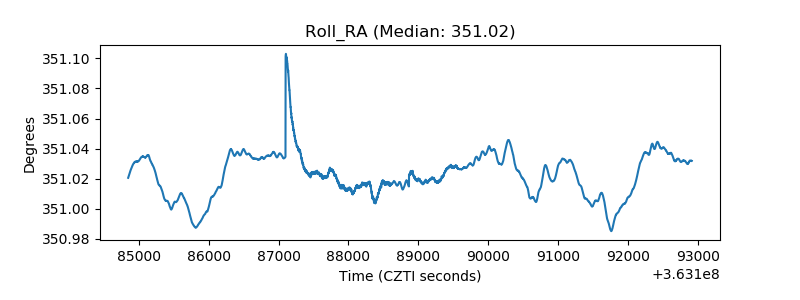 |
| Veto Counter | 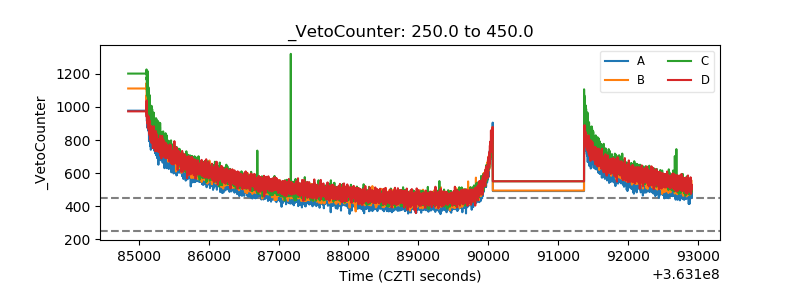 |