| Param | Original file | Final file |
|---|---|---|
| Filename | modeM0/AS1A10_082T10_9000004512_31195cztM0_level2.evt | modeM0/AS1A10_082T10_9000004512_31195cztM0_level2_quad_clean.evt |
| Size (bytes) | 640,192,320 | 91,840,320 |
| Size | 610.5 MB | 87.6 MB |
| Events in quadrant A | 3,379,816 | 606,953 |
| Events in quadrant B | 6,385,297 | 584,329 |
| Events in quadrant C | 3,664,395 | 577,234 |
| Events in quadrant D | 5,526,311 | 565,803 |
| Mode M0 | |||
|---|---|---|---|
| Quadrant | BADHDUFLAG | Total packets | Discarded packets |
| A | 0 | 14018 | 2 |
| B | 0 | 23050 | 2 |
| C | 0 | 14814 | 2 |
| D | 0 | 21131 | 2 |
| Mode SS | |||
|---|---|---|---|
| Quadrant | BADHDUFLAG | Total packets | Discarded packets |
| A | 0 | 130 | 0 |
| B | 0 | 130 | 0 |
| C | 0 | 130 | 0 |
| D | 0 | 130 | 0 |
| Mode M9 | |||
|---|---|---|---|
| Quadrant | BADHDUFLAG | Total packets | Discarded packets |
| A | 0 | 13 | 0 |
| B | 0 | 14 | 0 |
| C | 0 | 14 | 0 |
| D | 0 | 14 | 0 |
| Quadrant | Total seconds | Saturated seconds | Saturation percentage |
|---|---|---|---|
| A | 6400 | 133 | 2.078125% |
| B | 6400 | 755 | 11.796875% |
| C | 6400 | 261 | 4.078125% |
| D | 6399 | 231 | 3.609939% |
Noise dominated data is calculated using 1-second bins in cleaned event files. If a bin has >2000 counts, and if more than 50% of those come from <1% of pixels, then it is considered to be noise-dominated and hence unusable.
| Quadrant | # 1 sec bins | Bins with >0 counts | Bins with >2000 counts | High rate bins dominated by noise | Noise dominated (total time) | Noise dominated (detector-on time) | Marked lightcurve |
|---|---|---|---|---|---|---|---|
| A | 7620 | 6401 | 0 | 0 | 0.00% | 0.00% |  |
| B | 7620 | 6401 | 370 | 370 | 4.86% | 5.78% | 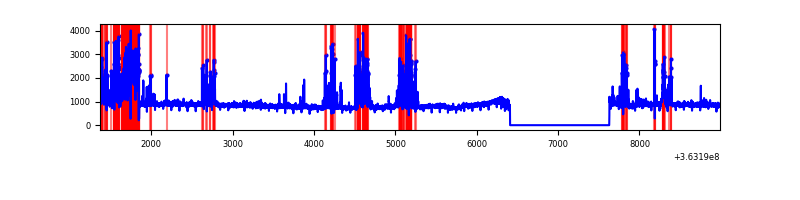 |
| C | 7620 | 6401 | 29 | 29 | 0.38% | 0.45% | 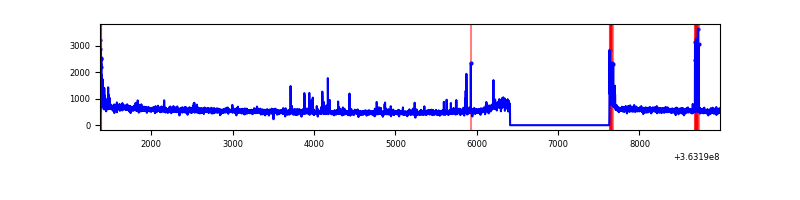 |
| D | 7619 | 6400 | 71 | 71 | 0.93% | 1.11% | 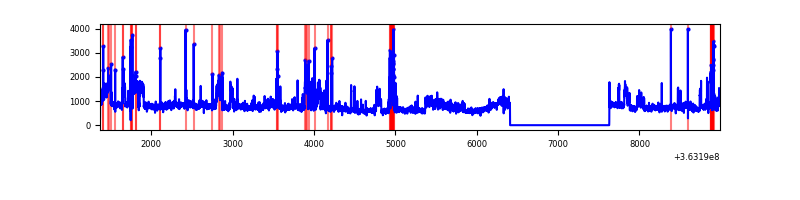 |
Top three noisy pixels from each quadrant. If the there are fewer than three noisy pixels in the level2.evt file, extra rows are filled as -1
| Pixel properties | Quadrant properties | ||||||
|---|---|---|---|---|---|---|---|
| Quadrant | DetID | PixID | Counts | Sigma | Mean | Median | Sigma |
| A | 13 | 254 | 12982 | 69.7 | 875 | 862 | 173.9 |
| A | 3 | 137 | 8138 | 41.84 | 875 | 862 | 173.9 |
| A | 0 | 226 | 7429 | 37.76 | 875 | 862 | 173.9 |
| B | 6 | 159 | 1827274 | 11994.33 | 820 | 801 | 152.3 |
| B | 4 | 80 | 1098178 | 7206.41 | 820 | 801 | 152.3 |
| B | 0 | 190 | 87165 | 567.15 | 820 | 801 | 152.3 |
| C | 0 | 10 | 209667 | 1097.85 | 831 | 835 | 190.2 |
| C | 14 | 238 | 138662 | 724.57 | 831 | 835 | 190.2 |
| C | 4 | 175 | 52126 | 269.64 | 831 | 835 | 190.2 |
| D | 8 | 195 | 1889258 | 9081.1 | 843 | 825 | 208.0 |
| D | 12 | 218 | 149565 | 715.26 | 843 | 825 | 208.0 |
| D | 2 | 250 | 149107 | 713.06 | 843 | 825 | 208.0 |
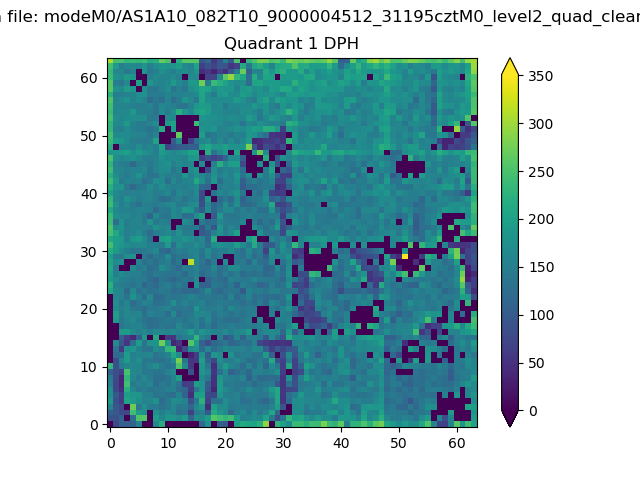
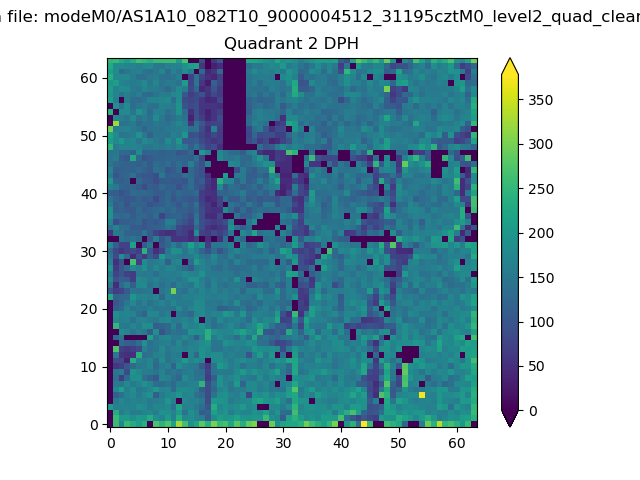
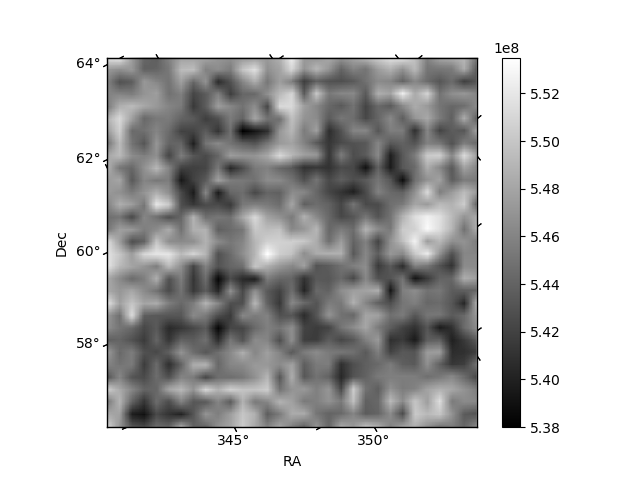
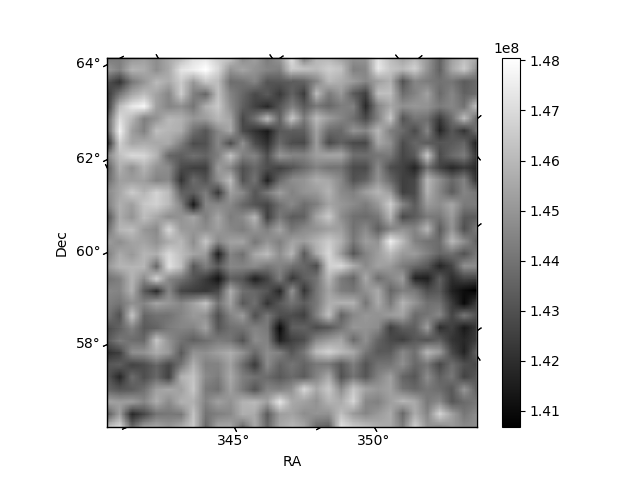
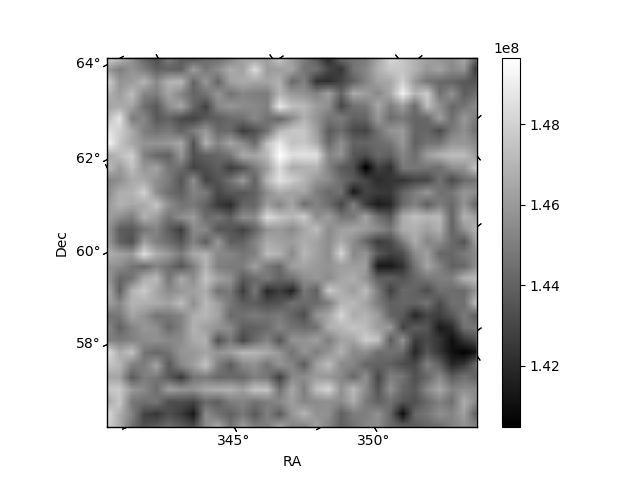
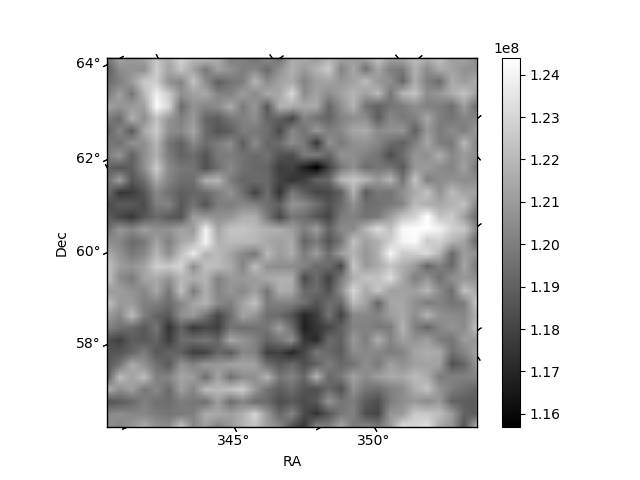
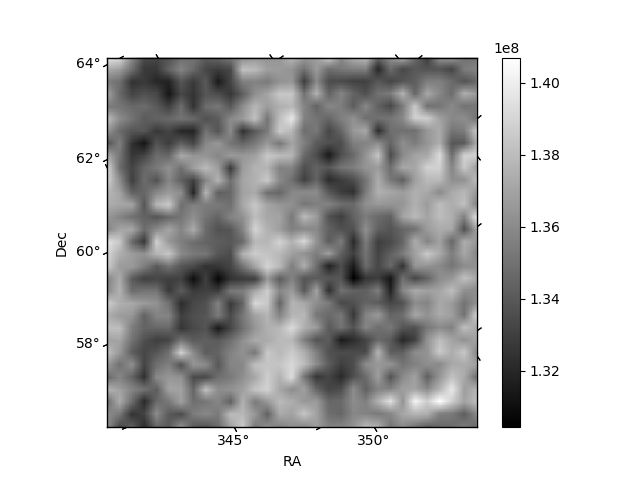
Histogram calculated using DETX and DETY for each event in the final _common_clean file
| Quadrant A | 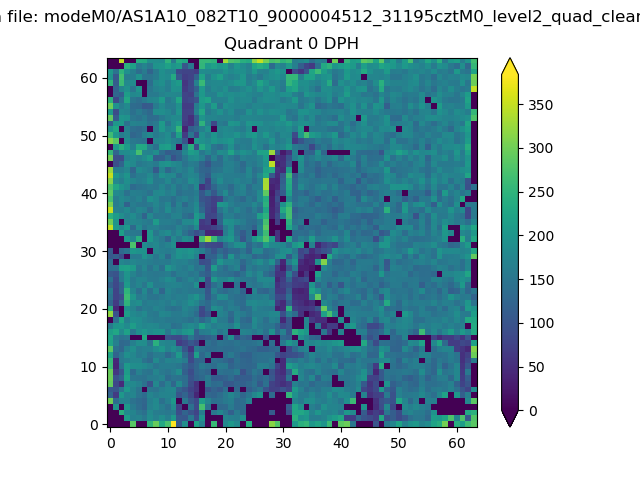 |
 |
Quadrant B |
|---|---|---|---|
| Quadrant D | 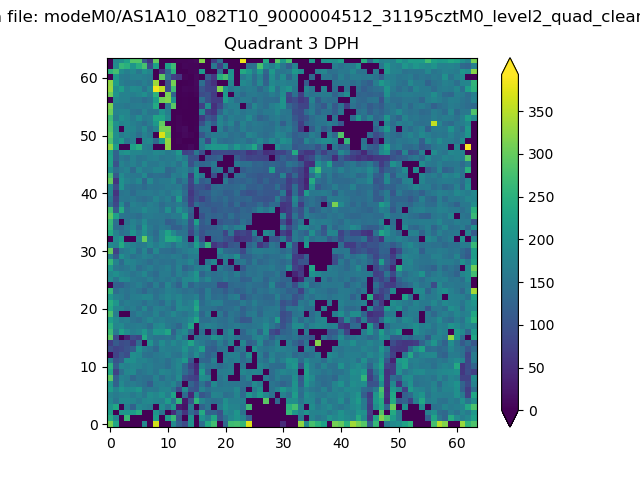 |
 |
Quadrant C |
| Plot type | Count rate plots | Images |
|---|---|---|
| Comparison with Poisson distribution Blue bars denote a histogram of data divided into 1 sec bins. Red curve is a Poisson curve with rate = median count rate of data. |
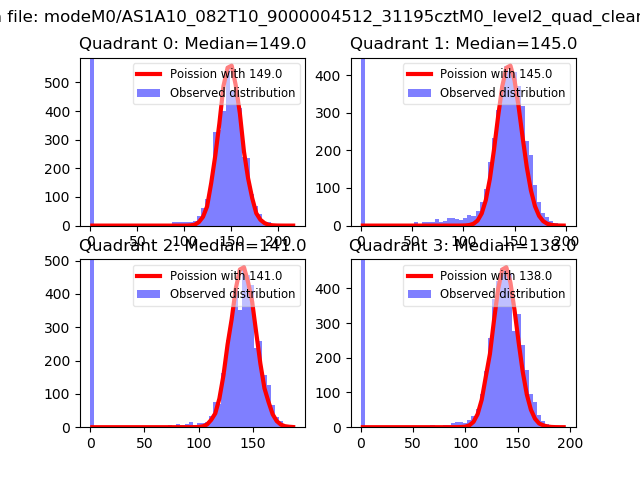 |
 |
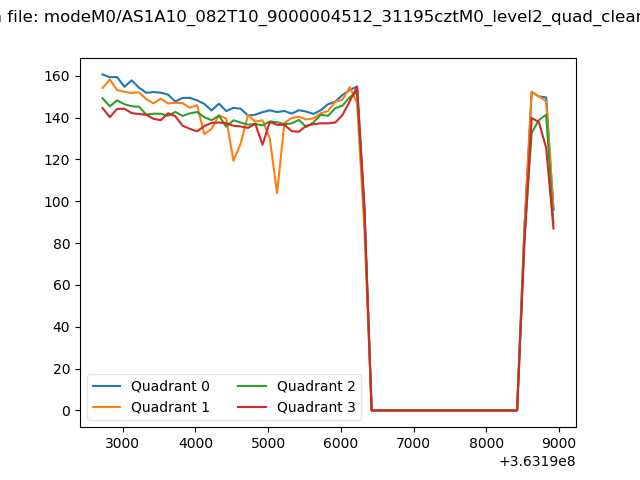
| Quadrant-wise count rates Data is divided into 100 sec bins |
 |
|
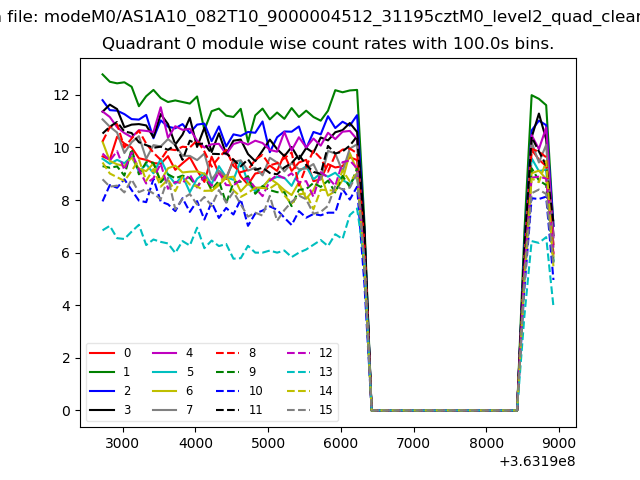
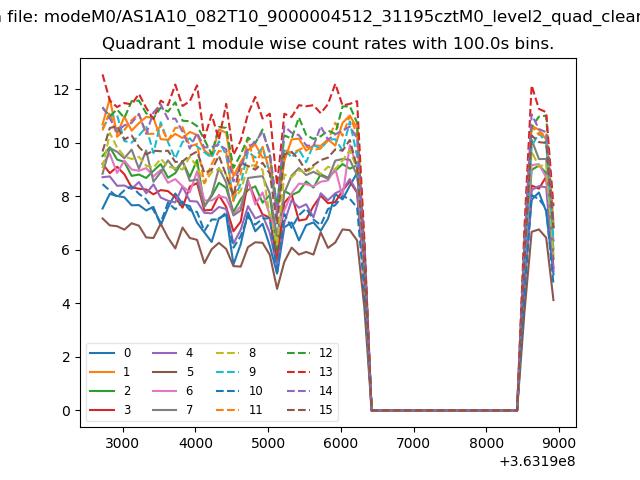
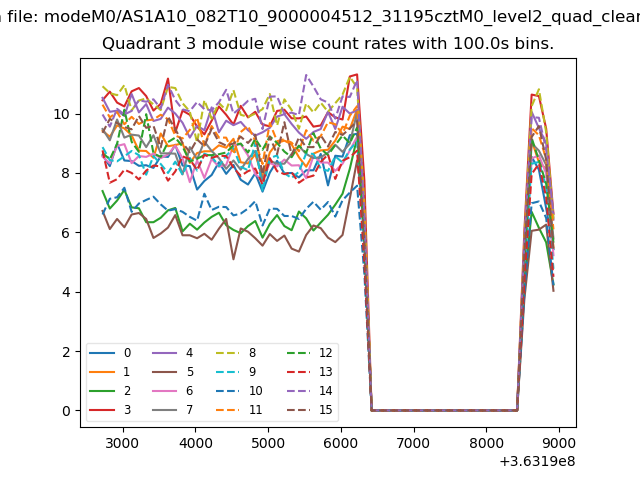
| Module-wise count rates for Quadrant A Data is divided into 100 sec bins |
 |
 |
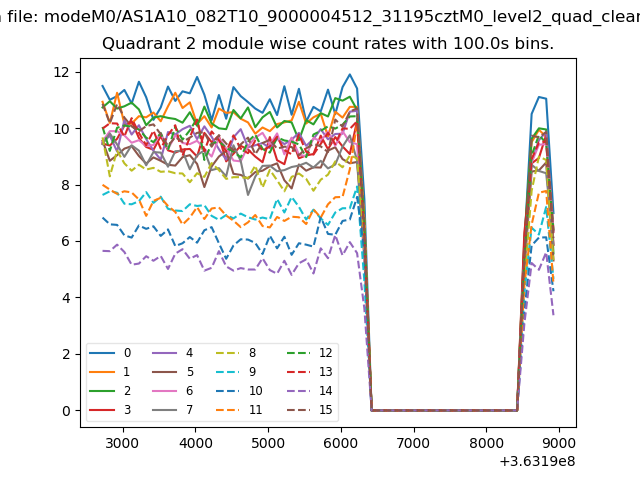
| Module-wise count rates for Quadrant B Data is divided into 100 sec bins |
 |
 |
| Module-wise count rates for Quadrant C Data is divided into 100 sec bins |
 |
 |
| Module-wise count rates for Quadrant D Data is divided into 100 sec bins |
 |
 |
| Parameter | Plot |
|---|---|
| CZT HV Monitor | 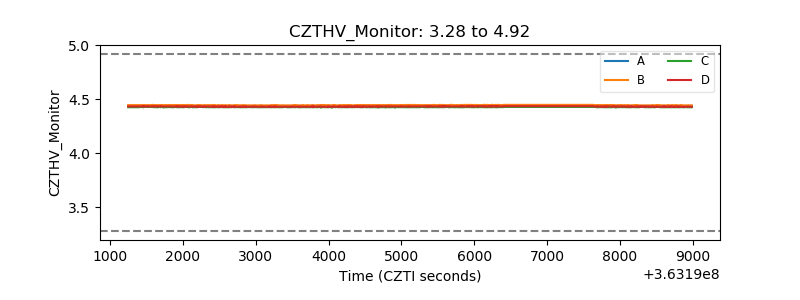 |
| D_VDD |  |
| Temperature 1 | 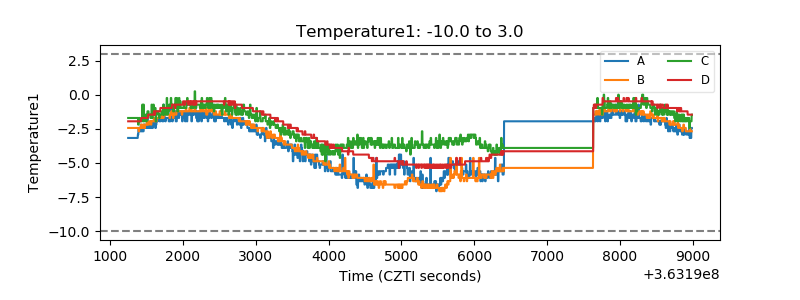 |
| Veto HV Monitor |  |
| Veto LLD | 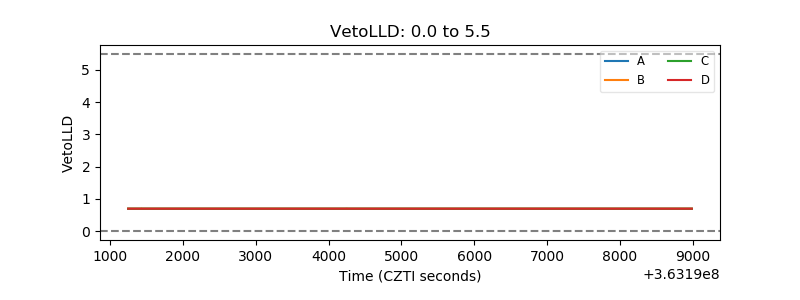 |
| Alpha Counter | 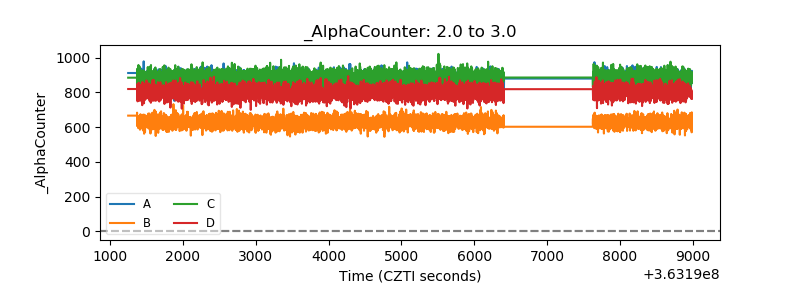 |
| _CPM_Rate | 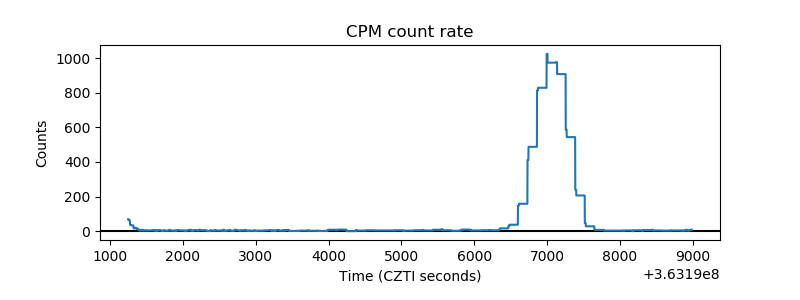 |
| CZT Counter | 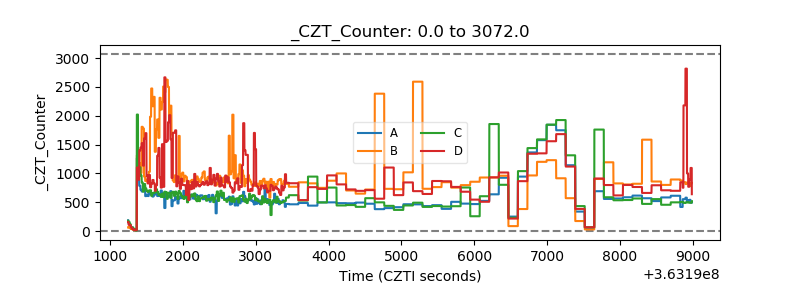 |
| +2.5 Volts monitor |  |
| +5 Volts monitor |  |
| _ROLL_ROT | 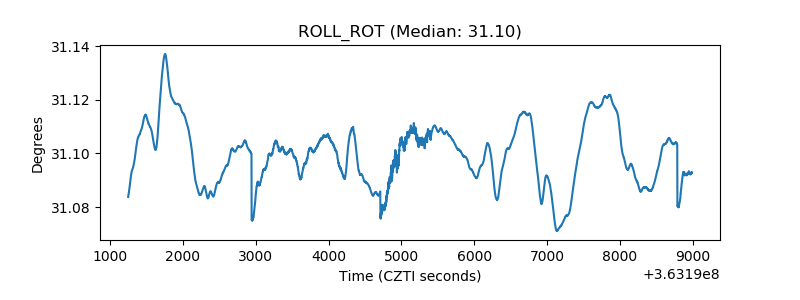 |
| _Roll_DEC | 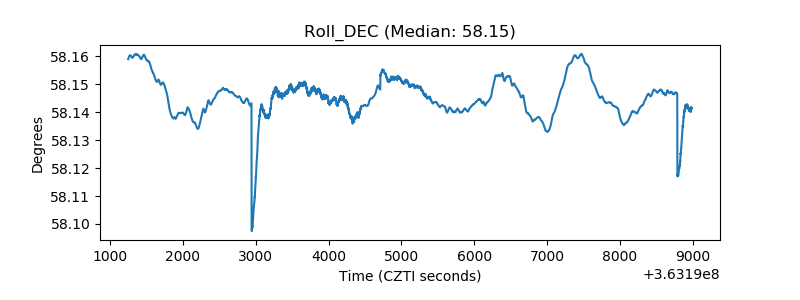 |
| _Roll_RA | 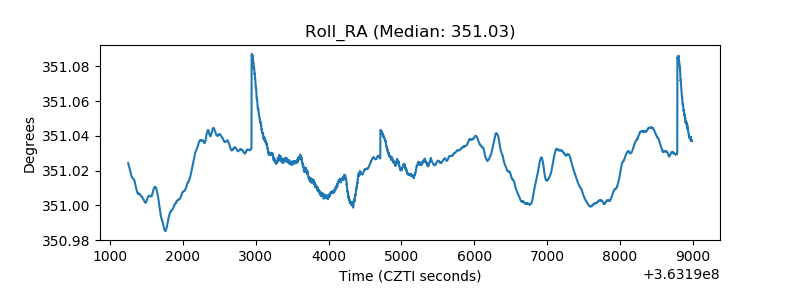 |
| Veto Counter | 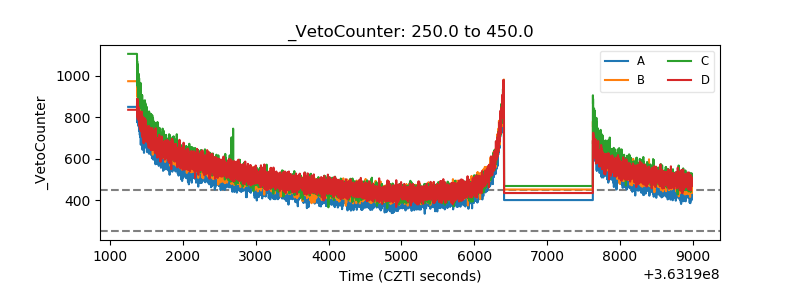 |