| Param | Original file | Final file |
|---|---|---|
| Filename | modeM0/AS1A10_082T10_9000004512_31196cztM0_level2.evt | modeM0/AS1A10_082T10_9000004512_31196cztM0_level2_quad_clean.evt |
| Size (bytes) | 715,798,080 | 105,056,640 |
| Size | 682.6 MB | 100.2 MB |
| Events in quadrant A | 3,219,302 | 725,648 |
| Events in quadrant B | 6,119,794 | 697,286 |
| Events in quadrant C | 3,581,576 | 692,641 |
| Events in quadrant D | 8,316,800 | 610,279 |
| Mode M0 | |||
|---|---|---|---|
| Quadrant | BADHDUFLAG | Total packets | Discarded packets |
| A | 0 | 13599 | 1 |
| B | 0 | 22568 | 1 |
| C | 0 | 14682 | 2 |
| D | 0 | 29501 | 1 |
| Mode SS | |||
|---|---|---|---|
| Quadrant | BADHDUFLAG | Total packets | Discarded packets |
| A | 0 | 134 | 0 |
| B | 0 | 134 | 0 |
| C | 0 | 134 | 0 |
| D | 0 | 134 | 0 |
| Mode M9 | |||
|---|---|---|---|
| Quadrant | BADHDUFLAG | Total packets | Discarded packets |
| A | 0 | 9 | 0 |
| B | 0 | 9 | 0 |
| C | 0 | 9 | 0 |
| D | 0 | 9 | 0 |
| Quadrant | Total seconds | Saturated seconds | Saturation percentage |
|---|---|---|---|
| A | 6523 | 129 | 1.977618% |
| B | 6523 | 548 | 8.401042% |
| C | 6523 | 254 | 3.893914% |
| D | 6523 | 1257 | 19.270274% |
Noise dominated data is calculated using 1-second bins in cleaned event files. If a bin has >2000 counts, and if more than 50% of those come from <1% of pixels, then it is considered to be noise-dominated and hence unusable.
| Quadrant | # 1 sec bins | Bins with >0 counts | Bins with >2000 counts | High rate bins dominated by noise | Noise dominated (total time) | Noise dominated (detector-on time) | Marked lightcurve |
|---|---|---|---|---|---|---|---|
| A | 7473 | 6524 | 0 | 0 | 0.00% | 0.00% | 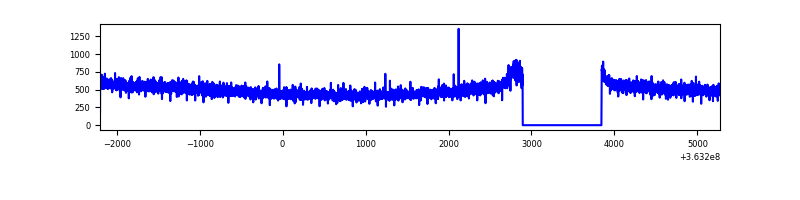 |
| B | 7473 | 6524 | 183 | 183 | 2.45% | 2.81% | 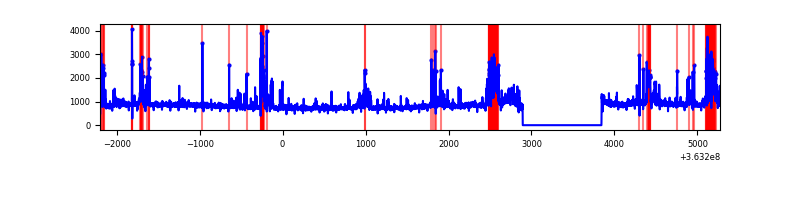 |
| C | 7473 | 6524 | 50 | 50 | 0.67% | 0.77% | 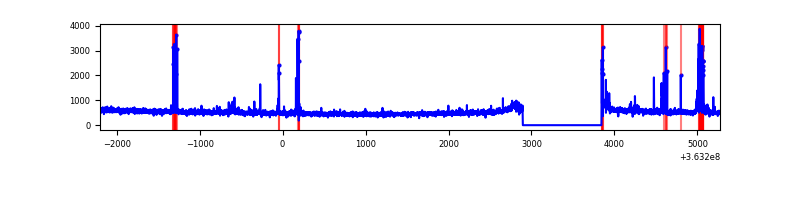 |
| D | 7473 | 6524 | 1054 | 1054 | 14.10% | 16.16% | 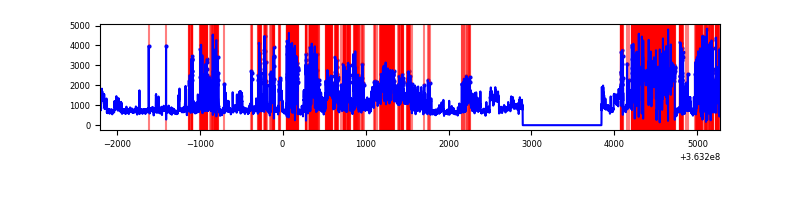 |
Top three noisy pixels from each quadrant. If the there are fewer than three noisy pixels in the level2.evt file, extra rows are filled as -1
| Pixel properties | Quadrant properties | ||||||
|---|---|---|---|---|---|---|---|
| Quadrant | DetID | PixID | Counts | Sigma | Mean | Median | Sigma |
| A | 13 | 254 | 12908 | 73.01 | 833 | 816 | 165.6 |
| A | 3 | 137 | 7933 | 42.97 | 833 | 816 | 165.6 |
| A | 0 | 226 | 7070 | 37.76 | 833 | 816 | 165.6 |
| B | 6 | 159 | 1965167 | 12967.68 | 805 | 786 | 151.5 |
| B | 4 | 80 | 684318 | 4512.27 | 805 | 786 | 151.5 |
| B | 4 | 171 | 86091 | 563.13 | 805 | 786 | 151.5 |
| C | 0 | 10 | 246237 | 1321.17 | 798 | 802 | 185.8 |
| C | 14 | 238 | 131361 | 702.8 | 798 | 802 | 185.8 |
| C | 4 | 175 | 50443 | 267.22 | 798 | 802 | 185.8 |
| D | 8 | 195 | 2160088 | 11552.97 | 723 | 707 | 186.9 |
| D | 12 | 218 | 1701400 | 9098.93 | 723 | 707 | 186.9 |
| D | 12 | 79 | 1536245 | 8215.33 | 723 | 707 | 186.9 |
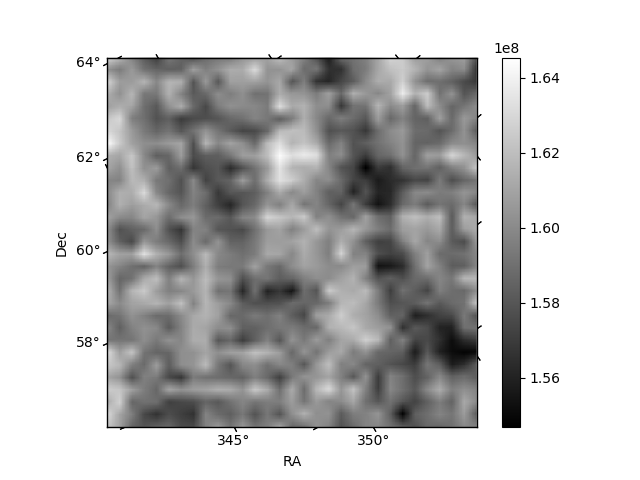
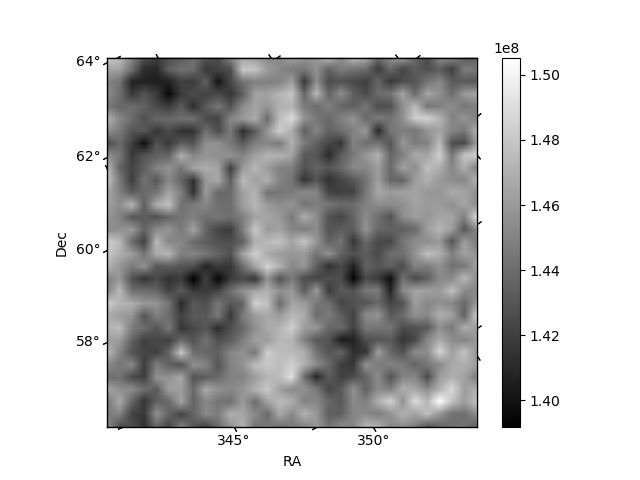
Histogram calculated using DETX and DETY for each event in the final _common_clean file
| Quadrant A | 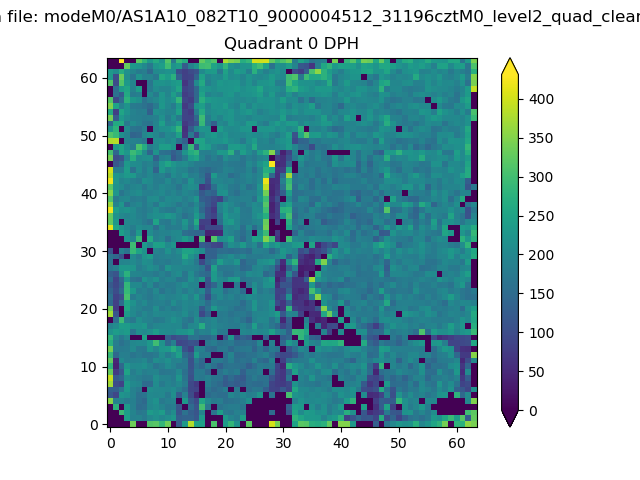 |
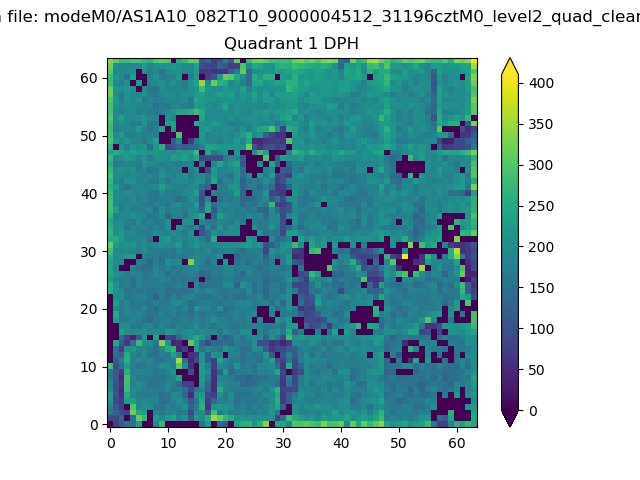 |
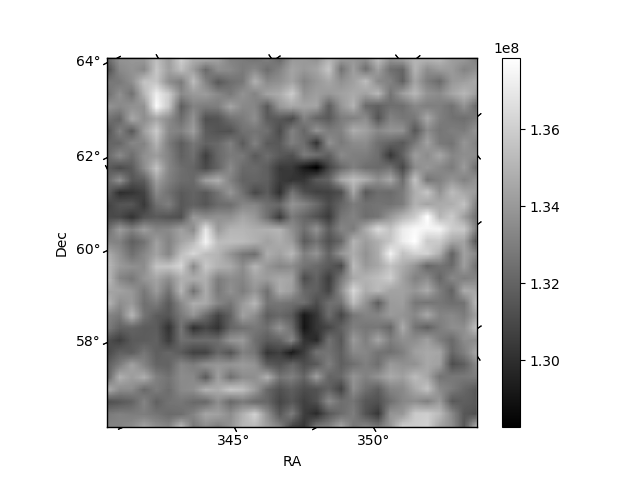
Quadrant B |
|---|---|---|---|
| Quadrant D | 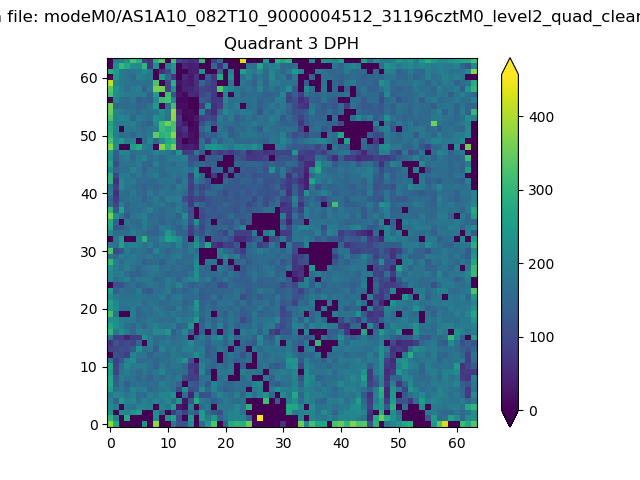 |
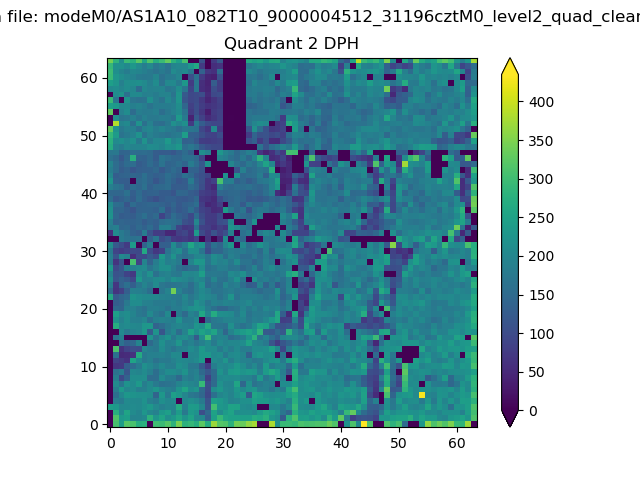 |
Quadrant C |
| Plot type | Count rate plots | Images |
|---|---|---|
| Comparison with Poisson distribution Blue bars denote a histogram of data divided into 1 sec bins. Red curve is a Poisson curve with rate = median count rate of data. |
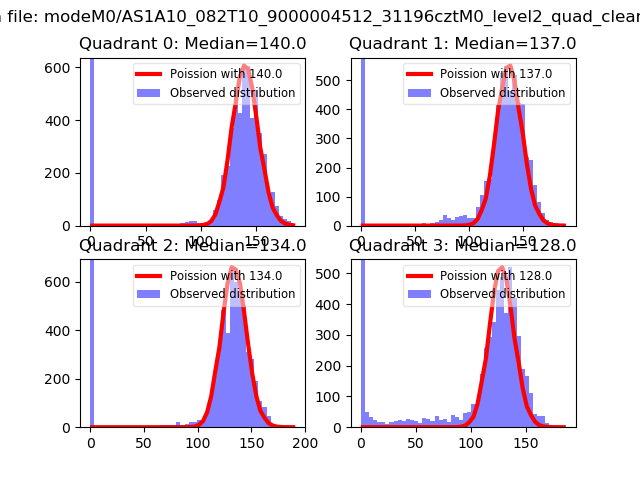 |
 |
| Quadrant-wise count rates Data is divided into 100 sec bins |
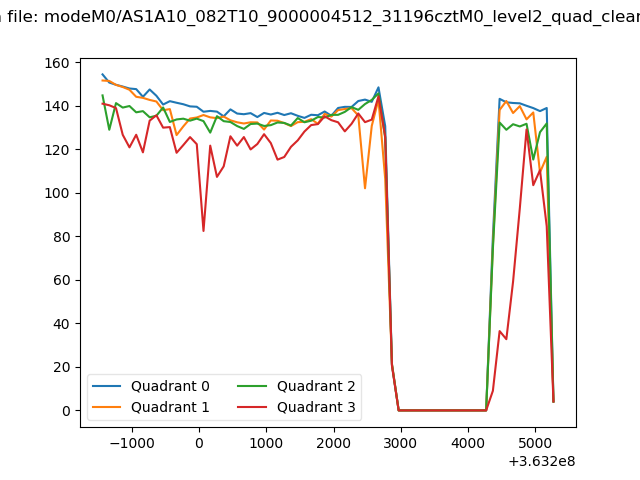 |
|
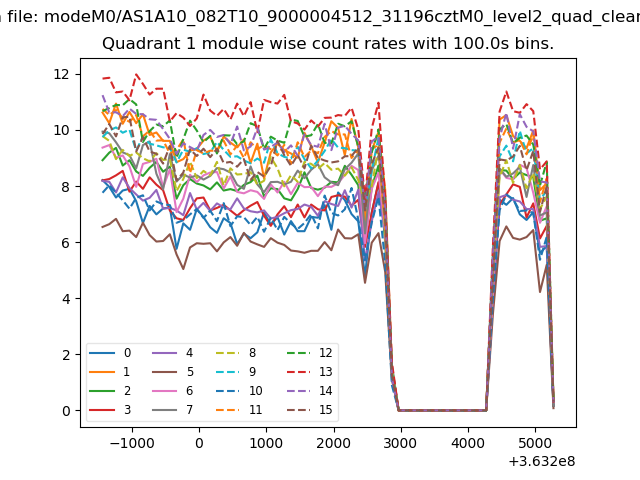
| Module-wise count rates for Quadrant A Data is divided into 100 sec bins |
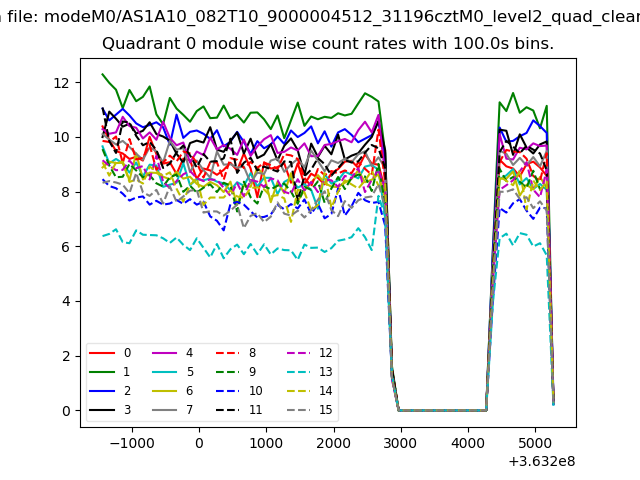 |
 |
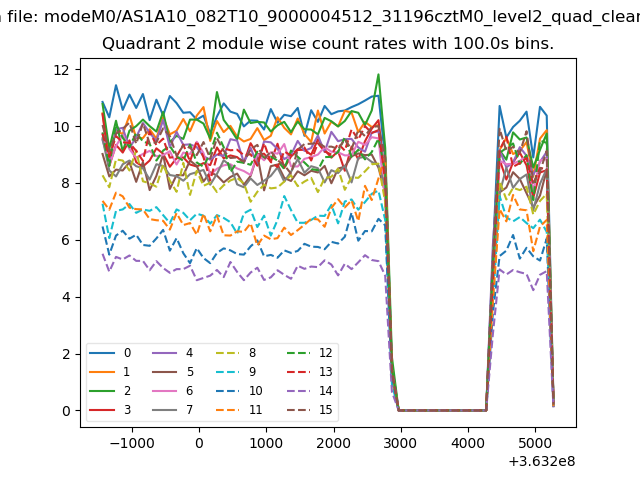
| Module-wise count rates for Quadrant B Data is divided into 100 sec bins |
 |
 |
| Module-wise count rates for Quadrant C Data is divided into 100 sec bins |
 |
 |
| Module-wise count rates for Quadrant D Data is divided into 100 sec bins |
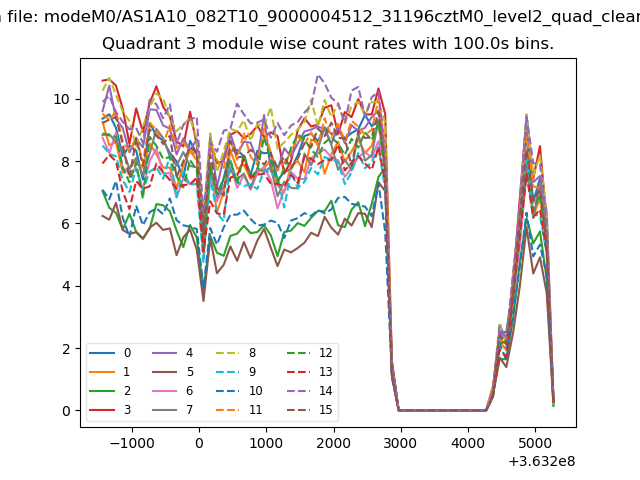 |
 |
| Parameter | Plot |
|---|---|
| CZT HV Monitor | 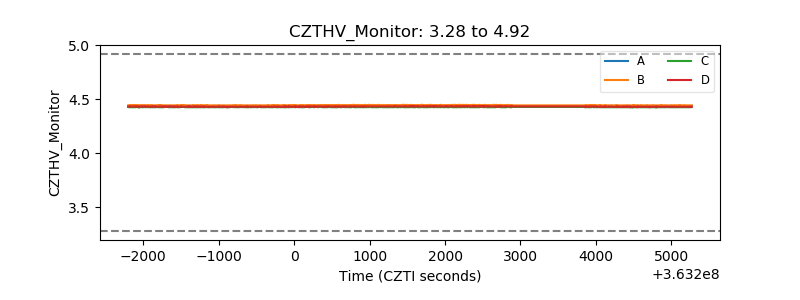 |
| D_VDD | 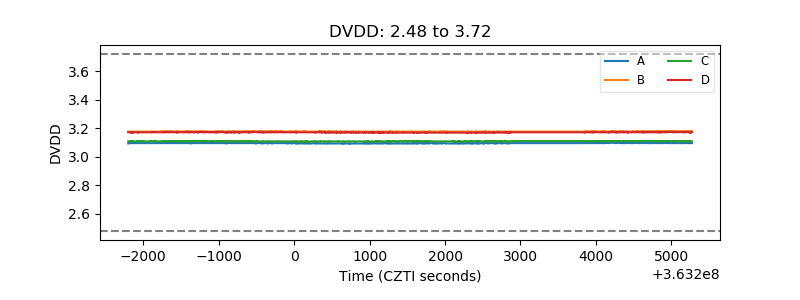 |
| Temperature 1 | 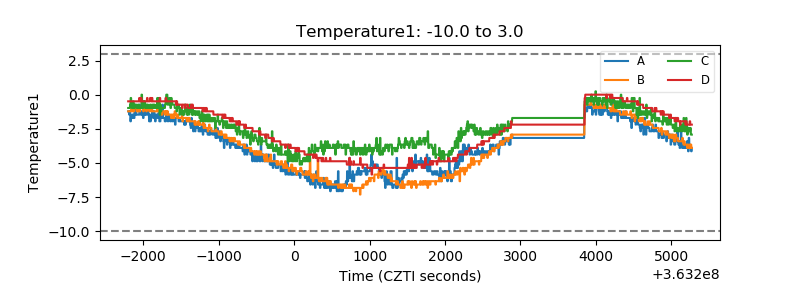 |
| Veto HV Monitor |  |
| Veto LLD | 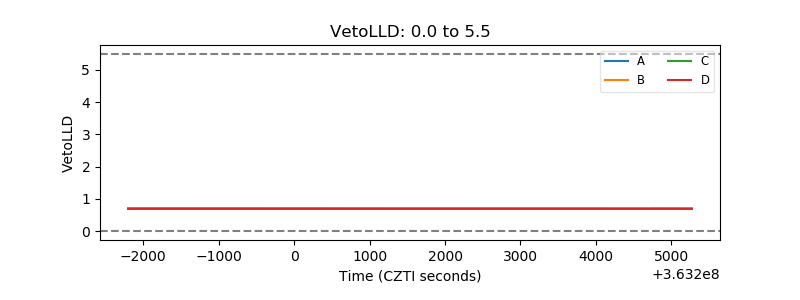 |
| Alpha Counter | 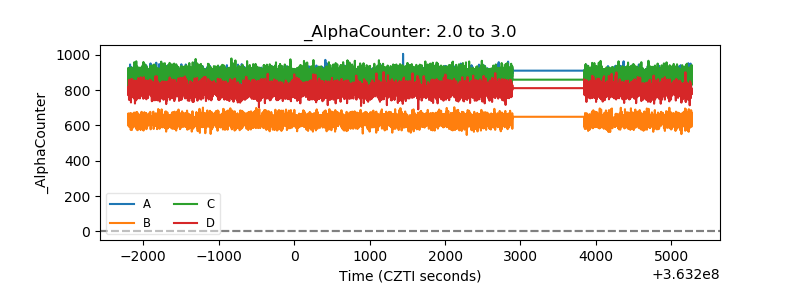 |
| _CPM_Rate | 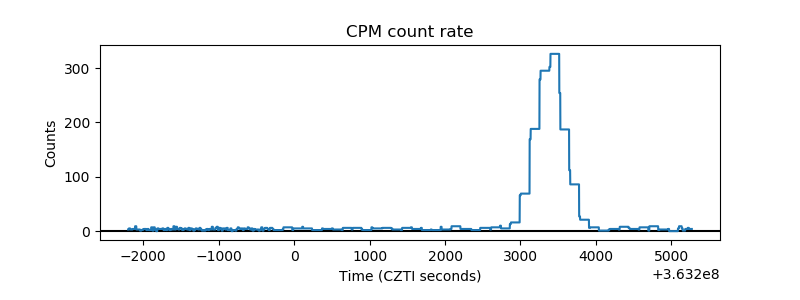 |
| CZT Counter | 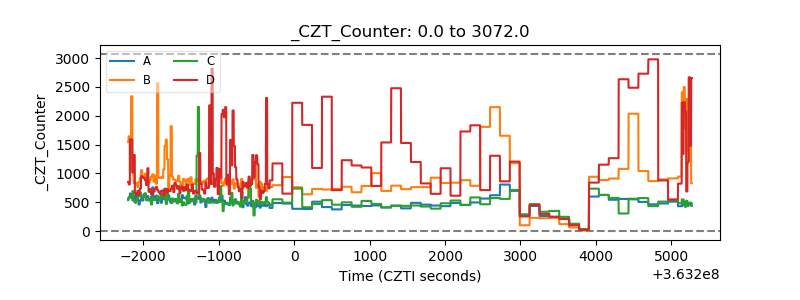 |
| +2.5 Volts monitor |  |
| +5 Volts monitor |  |
| _ROLL_ROT | 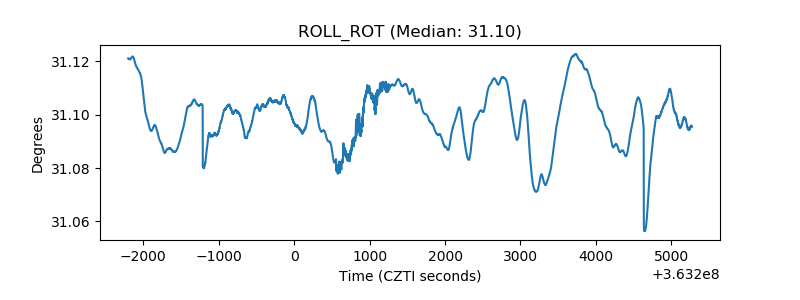 |
| _Roll_DEC | 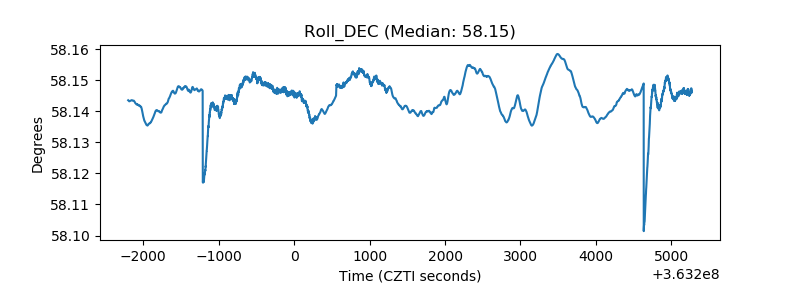 |
| _Roll_RA |  |
| Veto Counter | 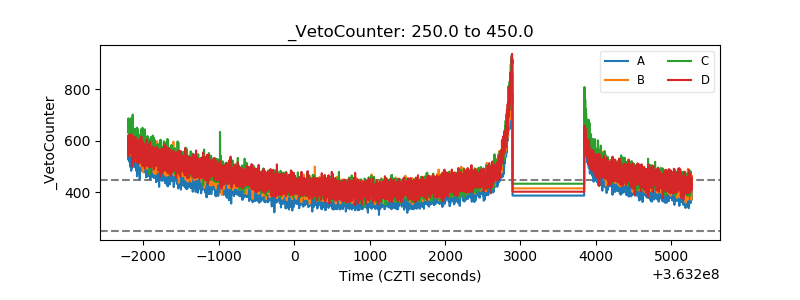 |