| Param | Original file | Final file |
|---|---|---|
| Filename | modeM0/AS1A10_082T10_9000004512_31197cztM0_level2.evt | modeM0/AS1A10_082T10_9000004512_31197cztM0_level2_quad_clean.evt |
| Size (bytes) | 163,630,080 | 18,688,320 |
| Size | 156.0 MB | 17.8 MB |
| Events in quadrant A | 580,959 | 140,386 |
| Events in quadrant B | 1,455,944 | 126,008 |
| Events in quadrant C | 738,369 | 129,277 |
| Events in quadrant D | 2,098,189 | 80,596 |
| Mode M0 | |||
|---|---|---|---|
| Quadrant | BADHDUFLAG | Total packets | Discarded packets |
| A | 0 | 2366 | 0 |
| B | 0 | 5081 | 0 |
| C | 0 | 2861 | 0 |
| D | 0 | 7067 | 0 |
| Mode SS | |||
|---|---|---|---|
| Quadrant | BADHDUFLAG | Total packets | Discarded packets |
| A | 0 | 24 | 0 |
| B | 0 | 24 | 0 |
| C | 0 | 24 | 0 |
| D | 0 | 24 | 0 |
| Quadrant | Total seconds | Saturated seconds | Saturation percentage |
|---|---|---|---|
| A | 1170 | 3 | 0.256410% |
| B | 1171 | 235 | 20.068318% |
| C | 1171 | 56 | 4.782237% |
| D | 1171 | 639 | 54.568745% |
Noise dominated data is calculated using 1-second bins in cleaned event files. If a bin has >2000 counts, and if more than 50% of those come from <1% of pixels, then it is considered to be noise-dominated and hence unusable.
| Quadrant | # 1 sec bins | Bins with >0 counts | Bins with >2000 counts | High rate bins dominated by noise | Noise dominated (total time) | Noise dominated (detector-on time) | Marked lightcurve |
|---|---|---|---|---|---|---|---|
| A | 1170 | 1170 | 0 | 0 | 0.00% | 0.00% | 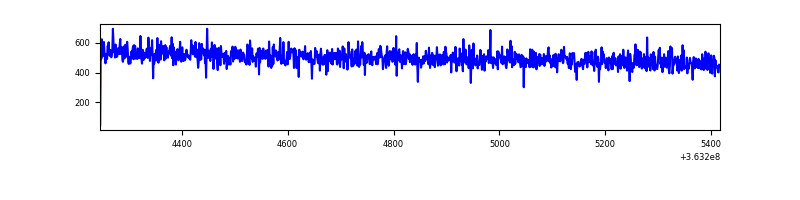 |
| B | 1170 | 1170 | 150 | 150 | 12.82% | 12.82% | 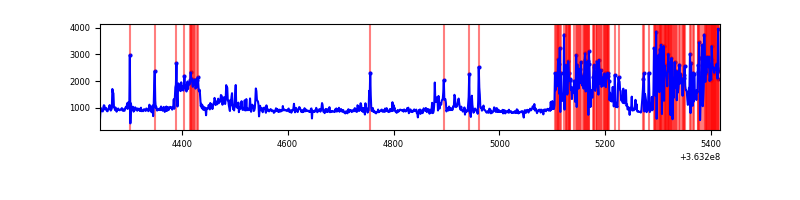 |
| C | 1171 | 1171 | 27 | 27 | 2.31% | 2.31% | 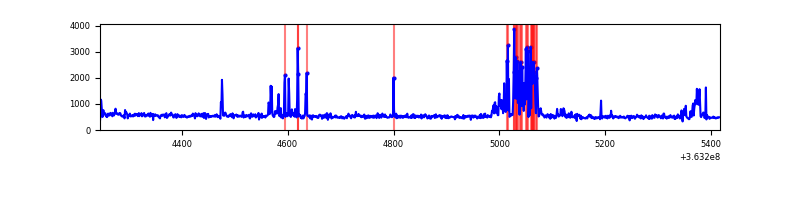 |
| D | 1171 | 1171 | 547 | 547 | 46.71% | 46.71% | 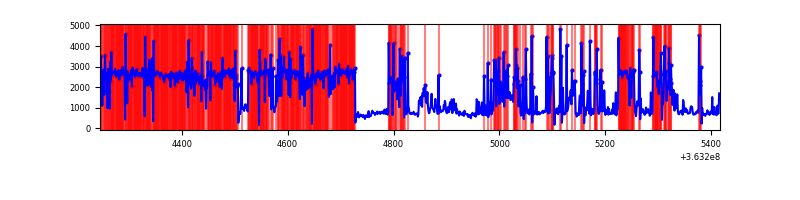 |
Top three noisy pixels from each quadrant. If the there are fewer than three noisy pixels in the level2.evt file, extra rows are filled as -1
| Pixel properties | Quadrant properties | ||||||
|---|---|---|---|---|---|---|---|
| Quadrant | DetID | PixID | Counts | Sigma | Mean | Median | Sigma |
| A | 13 | 254 | 2196 | 63.96 | 150 | 146 | 32.0 |
| A | 3 | 137 | 1406 | 39.31 | 150 | 146 | 32.0 |
| A | 0 | 226 | 1314 | 36.44 | 150 | 146 | 32.0 |
| B | 4 | 80 | 450597 | 15997.36 | 138 | 135 | 28.2 |
| B | 6 | 159 | 394712 | 14012.7 | 138 | 135 | 28.2 |
| B | 4 | 171 | 21018 | 741.62 | 138 | 135 | 28.2 |
| C | 0 | 10 | 124319 | 3532.03 | 142 | 143 | 35.2 |
| C | 14 | 238 | 24268 | 686.21 | 142 | 143 | 35.2 |
| C | 4 | 175 | 15196 | 428.16 | 142 | 143 | 35.2 |
| D | 12 | 79 | 1465264 | 66936.4 | 84 | 82 | 21.9 |
| D | 8 | 195 | 193174 | 8821.35 | 84 | 82 | 21.9 |
| D | 13 | 249 | 58723 | 2679.0 | 84 | 82 | 21.9 |
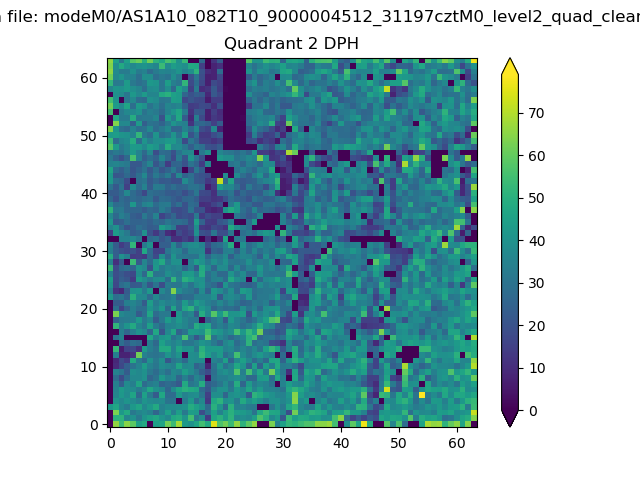
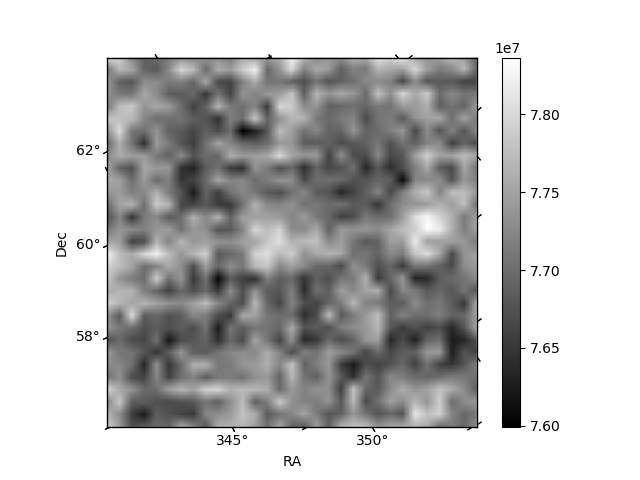
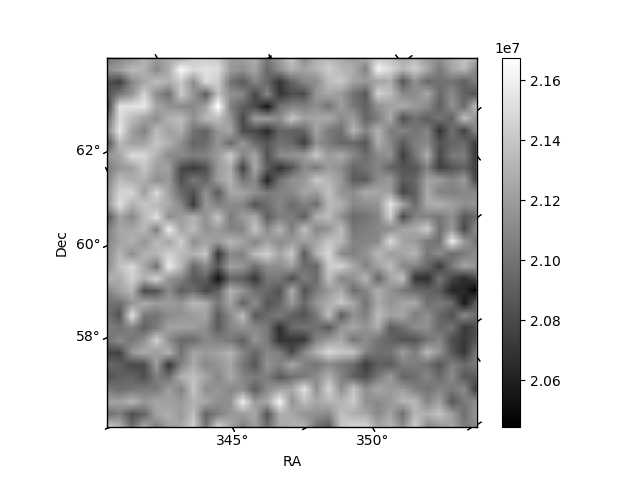
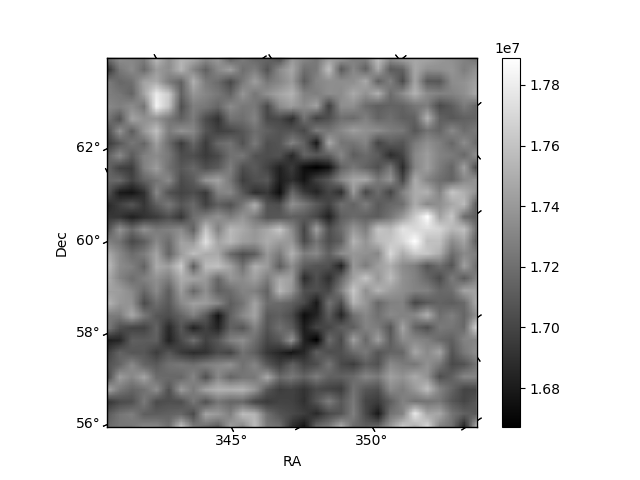
Histogram calculated using DETX and DETY for each event in the final _common_clean file
| Quadrant A | 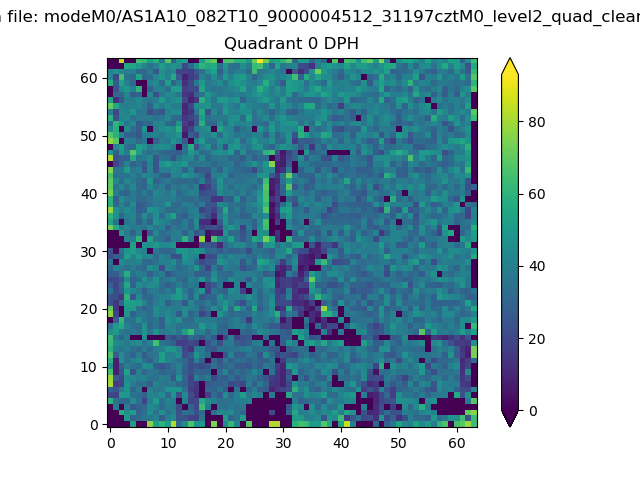 |
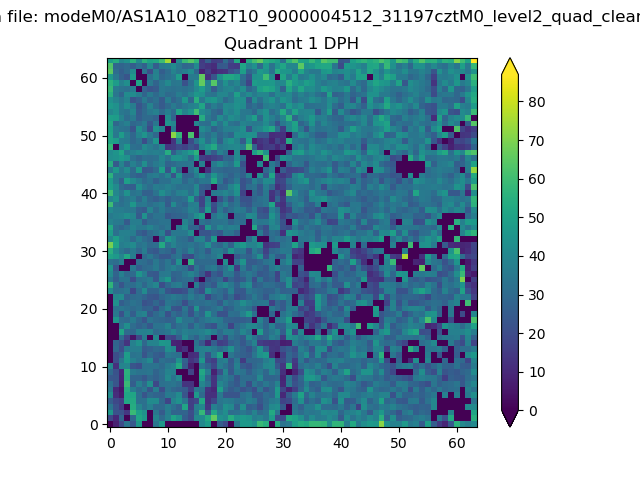 |
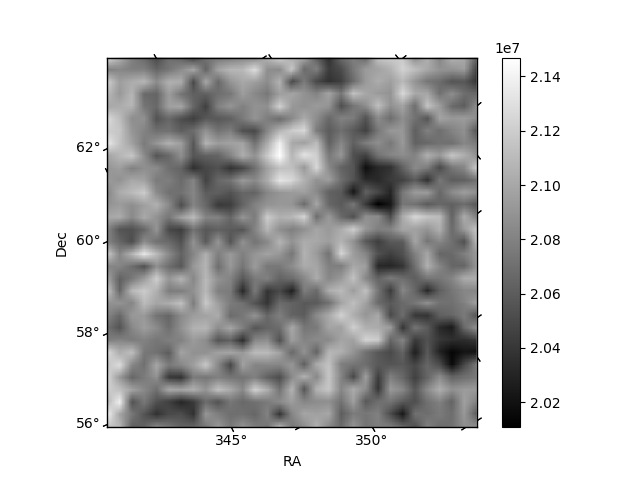
Quadrant B |
|---|---|---|---|
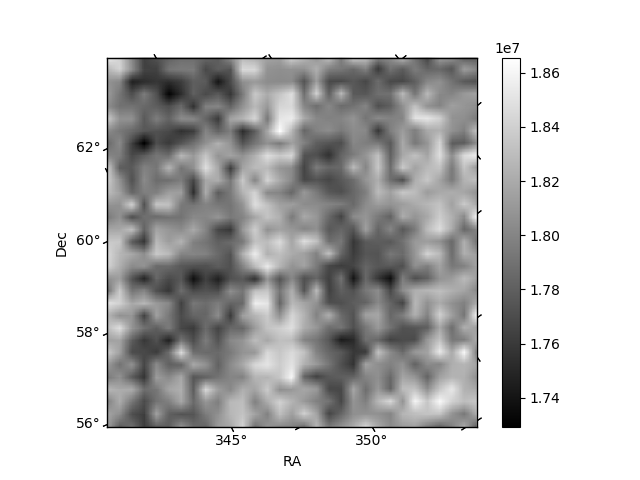
| Quadrant D | 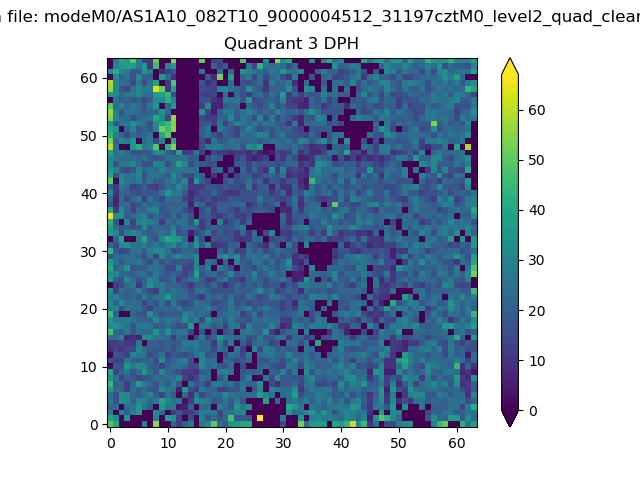 |
 |
Quadrant C |
| Plot type | Count rate plots | Images |
|---|---|---|
| Comparison with Poisson distribution Blue bars denote a histogram of data divided into 1 sec bins. Red curve is a Poisson curve with rate = median count rate of data. |
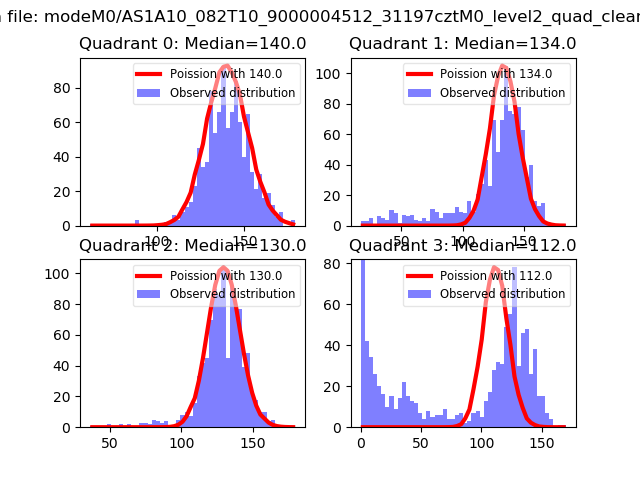 |
 |
| Quadrant-wise count rates Data is divided into 100 sec bins |
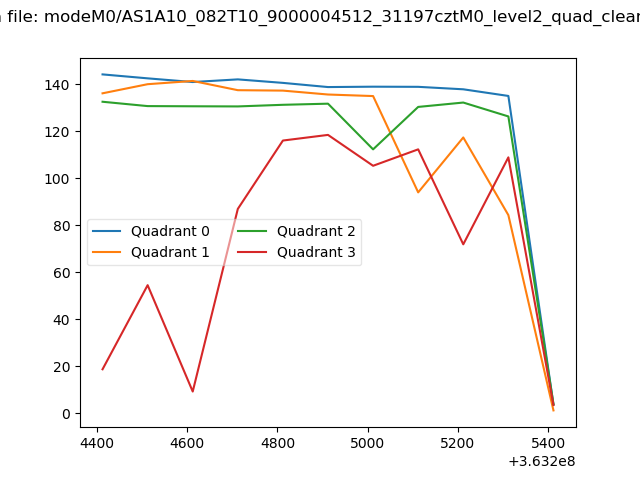 |
|
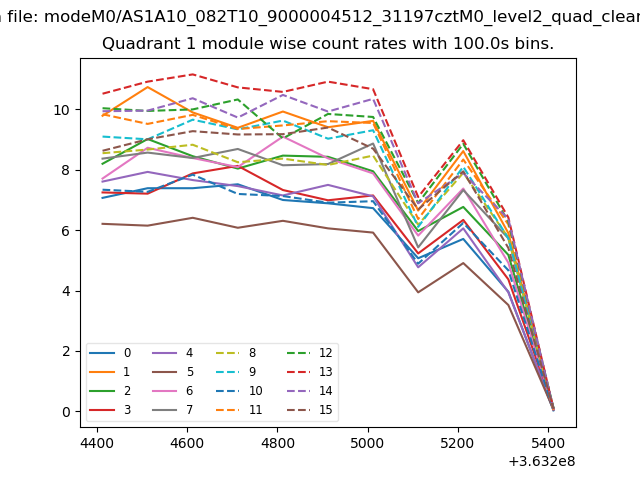
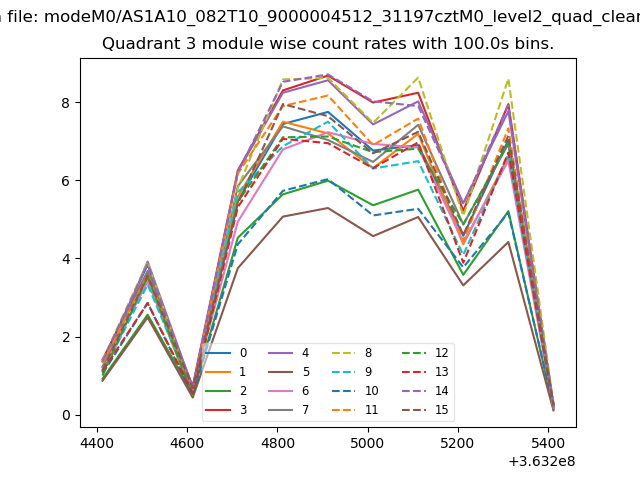
| Module-wise count rates for Quadrant A Data is divided into 100 sec bins |
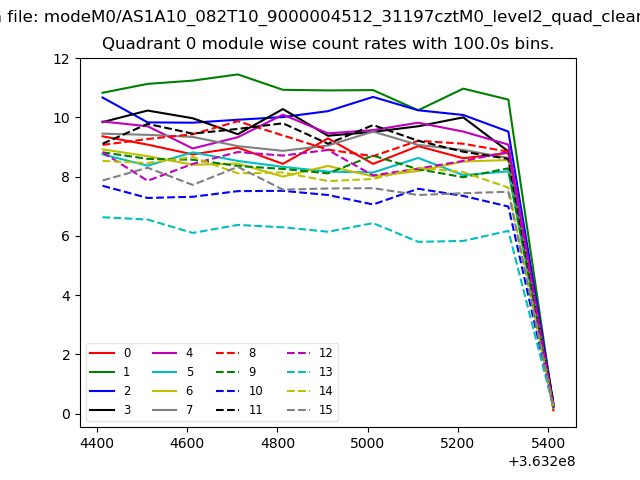 |
 |
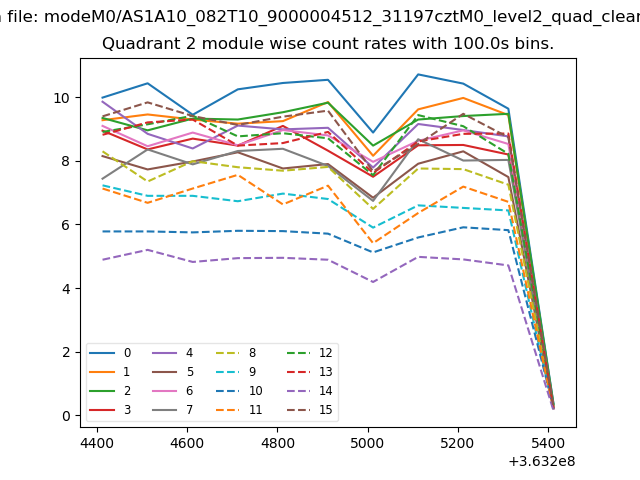
| Module-wise count rates for Quadrant B Data is divided into 100 sec bins |
 |
 |
| Module-wise count rates for Quadrant C Data is divided into 100 sec bins |
 |
 |
| Module-wise count rates for Quadrant D Data is divided into 100 sec bins |
 |
 |
| Parameter | Plot |
|---|---|
| CZT HV Monitor | 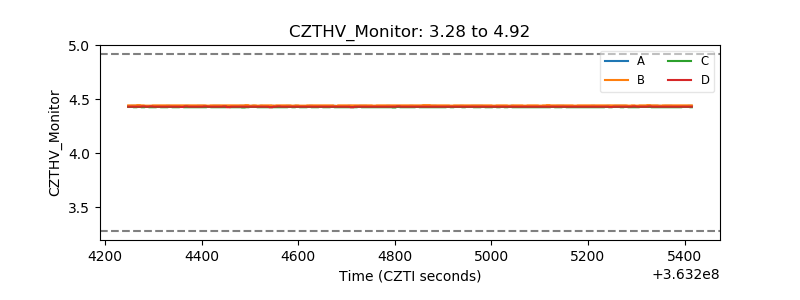 |
| D_VDD | 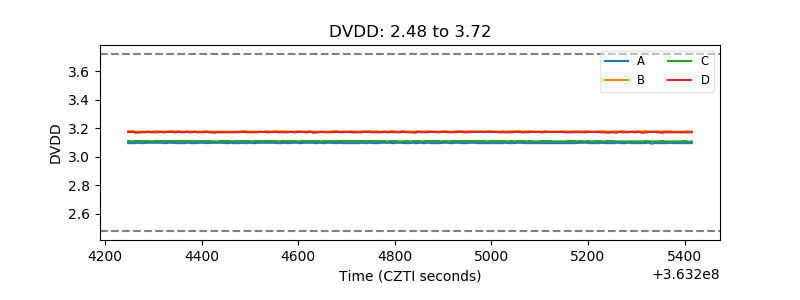 |
| Temperature 1 | 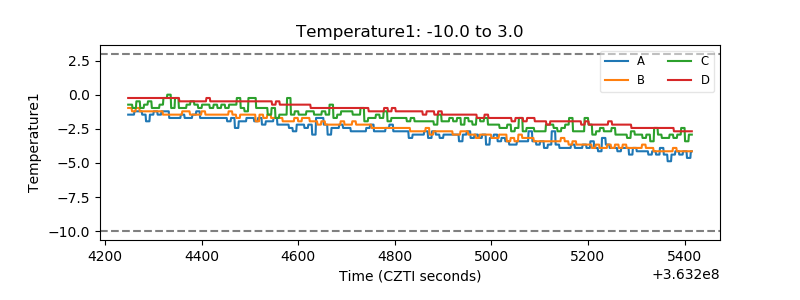 |
| Veto HV Monitor | 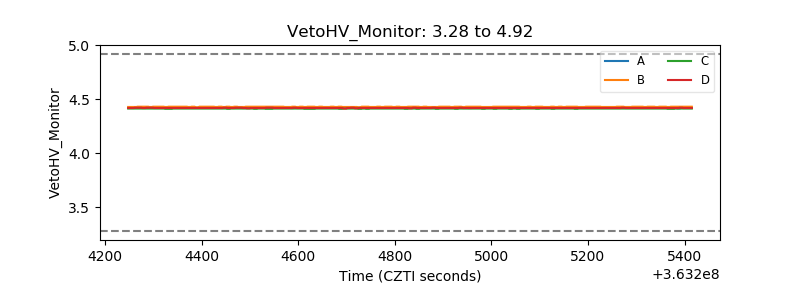 |
| Veto LLD | 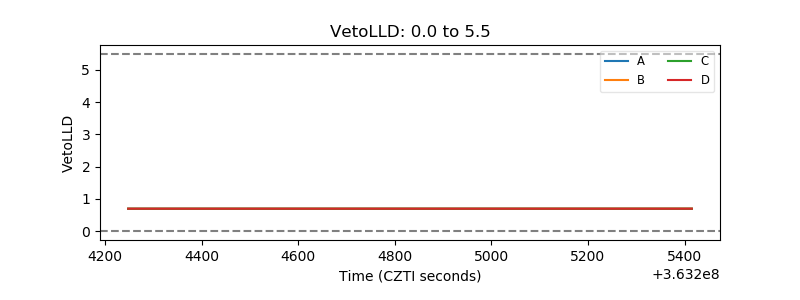 |
| Alpha Counter | 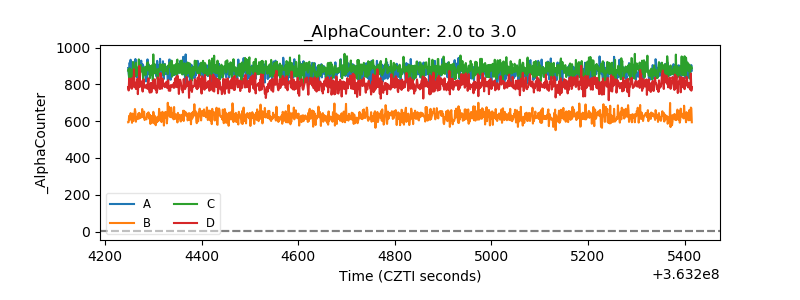 |
| _CPM_Rate | 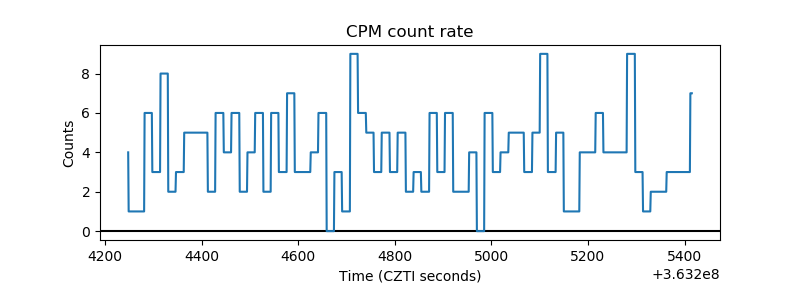 |
| CZT Counter | 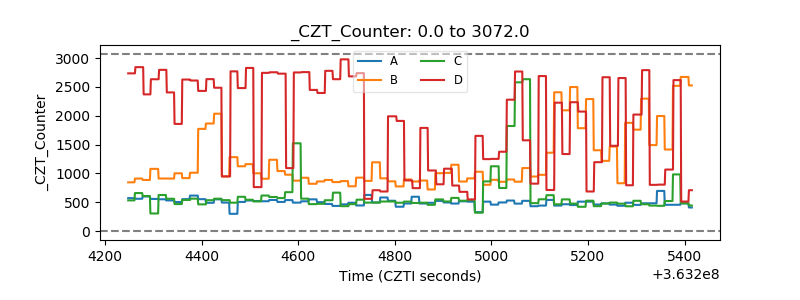 |
| +2.5 Volts monitor |  |
| +5 Volts monitor | 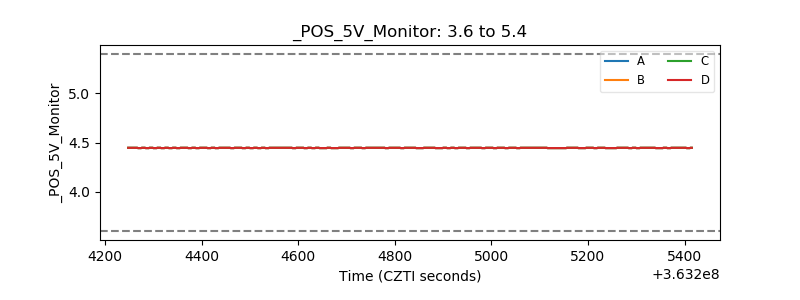 |
| _ROLL_ROT | 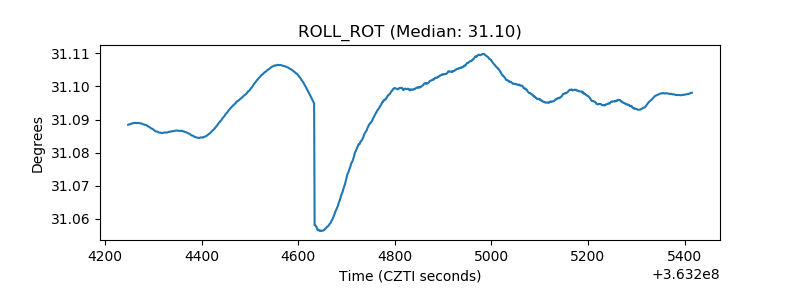 |
| _Roll_DEC | 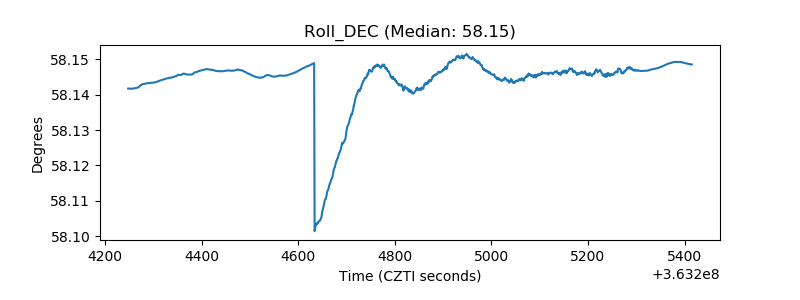 |
| _Roll_RA | 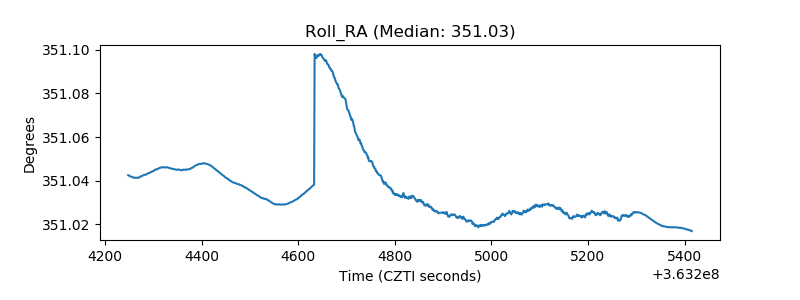 |
| Veto Counter | 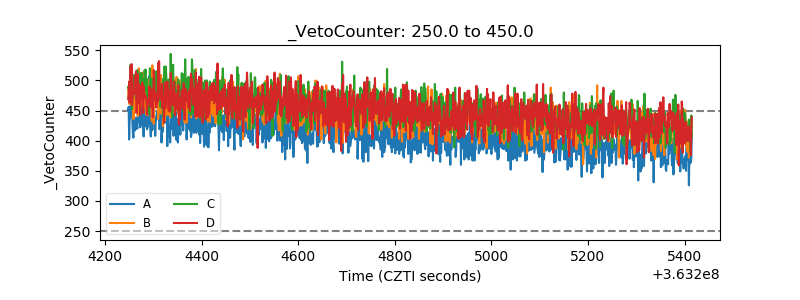 |