| Param | Original file | Final file |
|---|---|---|
| Filename | modeM0/AS1A10_103T02_9000004514_31197cztM0_level2.evt | modeM0/AS1A10_103T02_9000004514_31197cztM0_level2_quad_clean.evt |
| Size (bytes) | 423,031,680 | 54,253,440 |
| Size | 403.4 MB | 51.7 MB |
| Events in quadrant A | 2,085,848 | 350,784 |
| Events in quadrant B | 4,464,554 | 326,414 |
| Events in quadrant C | 2,217,724 | 336,922 |
| Events in quadrant D | 3,751,120 | 325,097 |
| Mode M9 | |||
|---|---|---|---|
| Quadrant | BADHDUFLAG | Total packets | Discarded packets |
| A | 0 | 5 | 0 |
| B | 0 | 5 | 0 |
| C | 0 | 5 | 0 |
| D | 0 | 5 | 0 |
| Mode SS | |||
|---|---|---|---|
| Quadrant | BADHDUFLAG | Total packets | Discarded packets |
| A | 0 | 90 | 0 |
| B | 0 | 90 | 0 |
| C | 0 | 90 | 0 |
| D | 0 | 90 | 0 |
| Mode M0 | |||
|---|---|---|---|
| Quadrant | BADHDUFLAG | Total packets | Discarded packets |
| A | 0 | 8951 | 1 |
| B | 0 | 16219 | 1 |
| C | 0 | 9279 | 2 |
| D | 0 | 14278 | 1 |
| Quadrant | Total seconds | Saturated seconds | Saturation percentage |
|---|---|---|---|
| A | 4299 | 36 | 0.837404% |
| B | 4299 | 523 | 12.165620% |
| C | 4298 | 88 | 2.047464% |
| D | 4298 | 255 | 5.932992% |
Noise dominated data is calculated using 1-second bins in cleaned event files. If a bin has >2000 counts, and if more than 50% of those come from <1% of pixels, then it is considered to be noise-dominated and hence unusable.
| Quadrant | # 1 sec bins | Bins with >0 counts | Bins with >2000 counts | High rate bins dominated by noise | Noise dominated (total time) | Noise dominated (detector-on time) | Marked lightcurve |
|---|---|---|---|---|---|---|---|
| A | 4894 | 4300 | 0 | 0 | 0.00% | 0.00% | 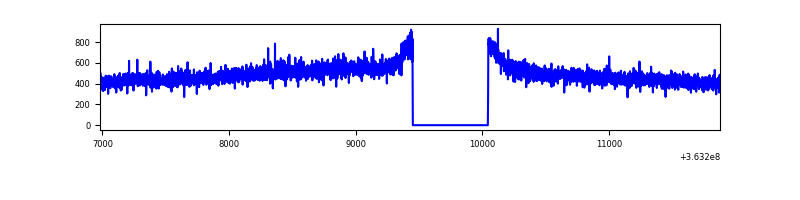 |
| B | 4894 | 4300 | 224 | 224 | 4.58% | 5.21% | 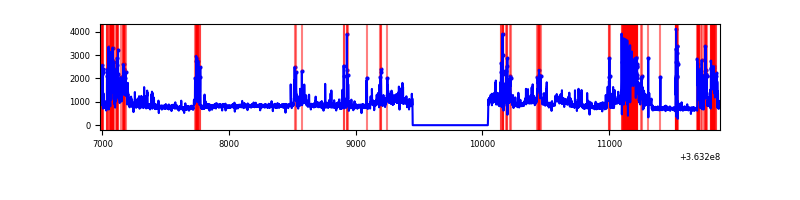 |
| C | 4893 | 4299 | 4 | 4 | 0.08% | 0.09% | 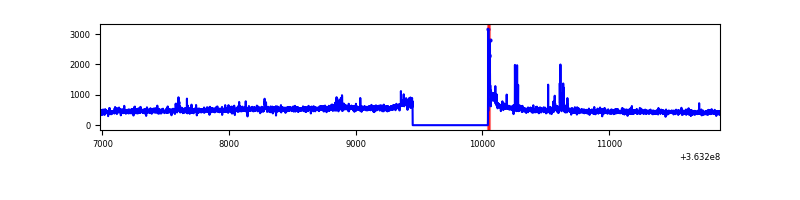 |
| D | 4893 | 4299 | 170 | 170 | 3.47% | 3.95% | 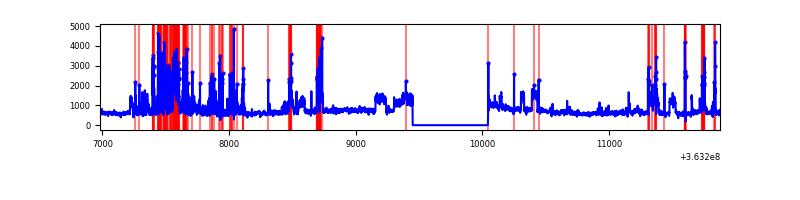 |
Top three noisy pixels from each quadrant. If the there are fewer than three noisy pixels in the level2.evt file, extra rows are filled as -1
| Pixel properties | Quadrant properties | ||||||
|---|---|---|---|---|---|---|---|
| Quadrant | DetID | PixID | Counts | Sigma | Mean | Median | Sigma |
| A | 13 | 254 | 7779 | 66.11 | 540 | 528 | 109.7 |
| A | 3 | 137 | 5748 | 47.59 | 540 | 528 | 109.7 |
| A | 0 | 226 | 4632 | 37.42 | 540 | 528 | 109.7 |
| B | 6 | 159 | 1209040 | 12084.05 | 517 | 503 | 100.0 |
| B | 4 | 80 | 1134348 | 11337.21 | 517 | 503 | 100.0 |
| B | 0 | 190 | 23752 | 232.46 | 517 | 503 | 100.0 |
| C | 14 | 238 | 84213 | 681.07 | 517 | 518 | 122.9 |
| C | 0 | 10 | 78835 | 637.31 | 517 | 518 | 122.9 |
| C | 4 | 175 | 12605 | 98.36 | 517 | 518 | 122.9 |
| D | 8 | 195 | 1099702 | 8532.64 | 512 | 498 | 128.8 |
| D | 12 | 79 | 629599 | 4883.44 | 512 | 498 | 128.8 |
| D | 13 | 249 | 27885 | 212.59 | 512 | 498 | 128.8 |
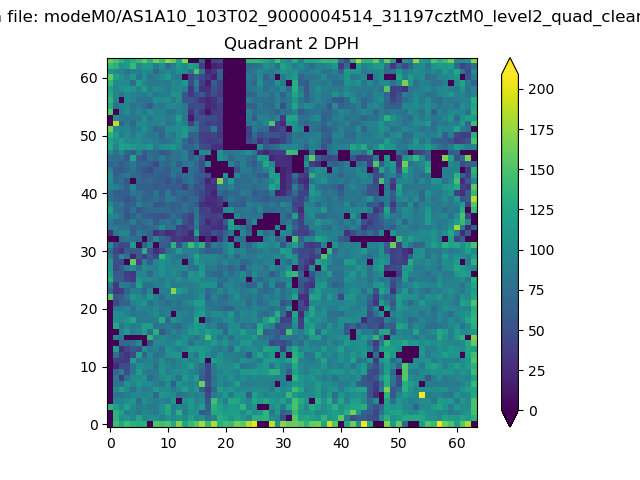
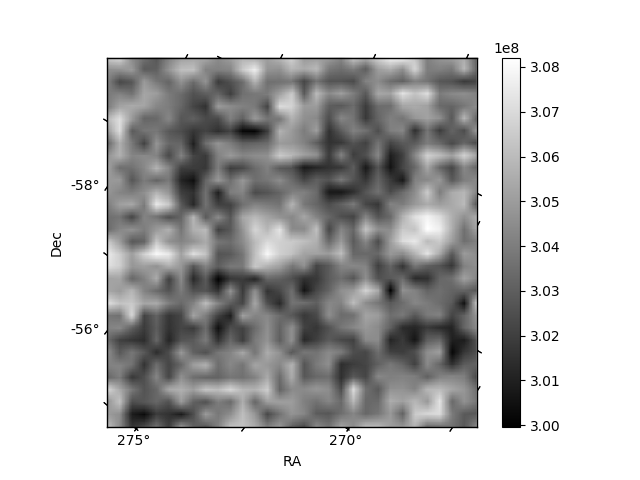
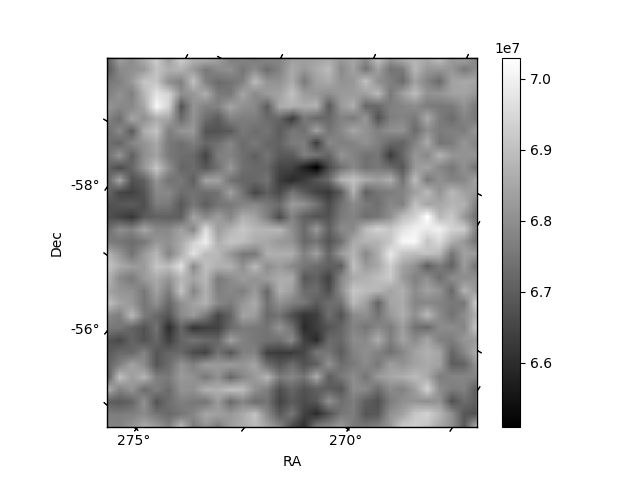
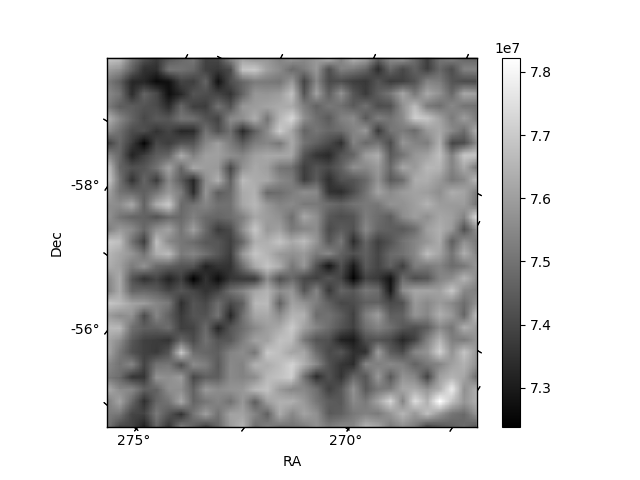
Histogram calculated using DETX and DETY for each event in the final _common_clean file
| Quadrant A | 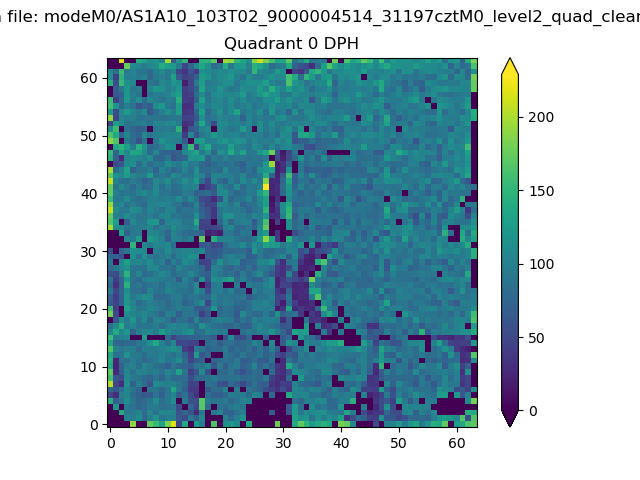 |
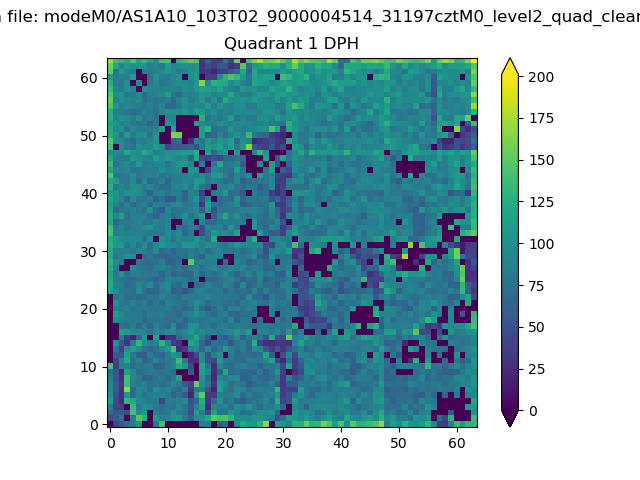 |
Quadrant B |
|---|---|---|---|
| Quadrant D | 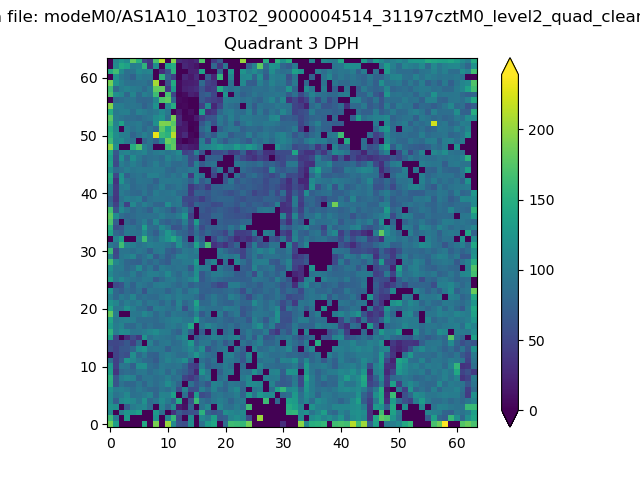 |
 |
Quadrant C |
| Plot type | Count rate plots | Images |
|---|---|---|
| Comparison with Poisson distribution Blue bars denote a histogram of data divided into 1 sec bins. Red curve is a Poisson curve with rate = median count rate of data. |
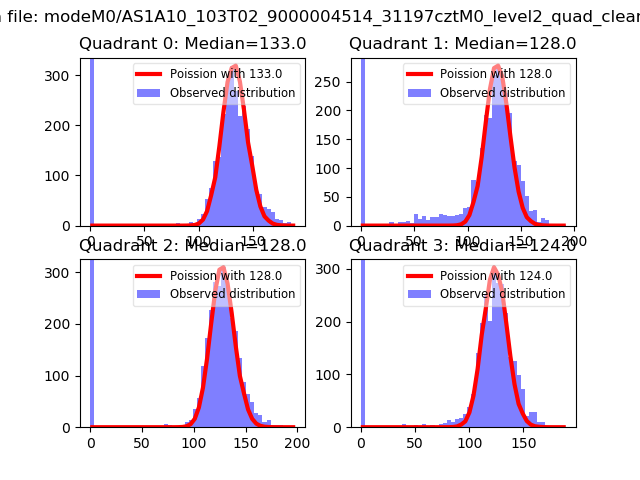 |
 |
| Quadrant-wise count rates Data is divided into 100 sec bins |
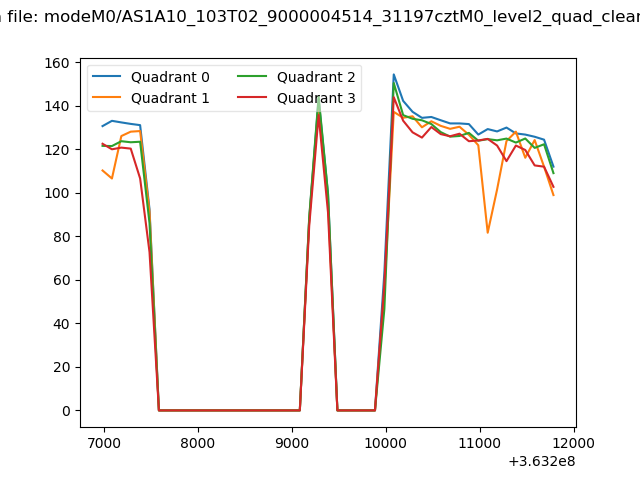 |
|
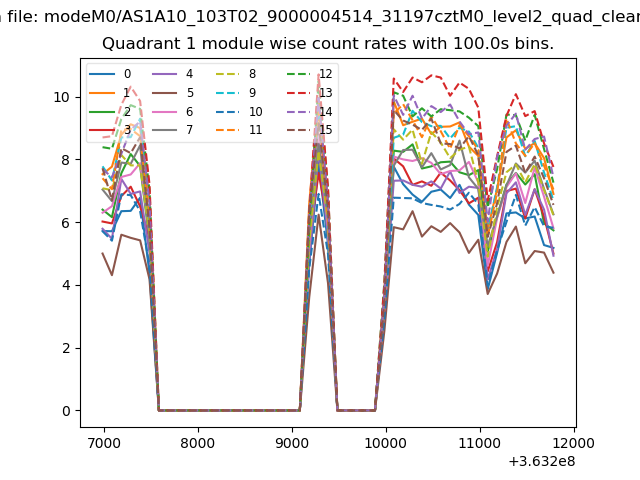
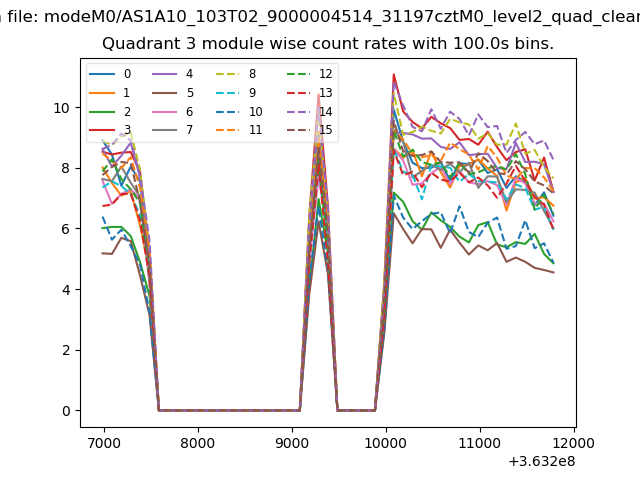
| Module-wise count rates for Quadrant A Data is divided into 100 sec bins |
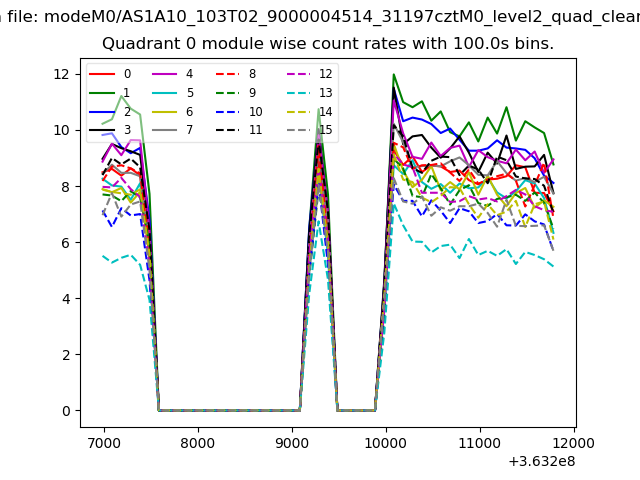 |
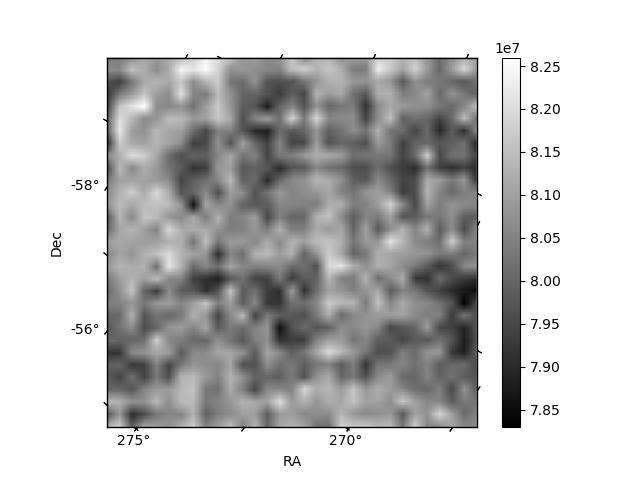 |
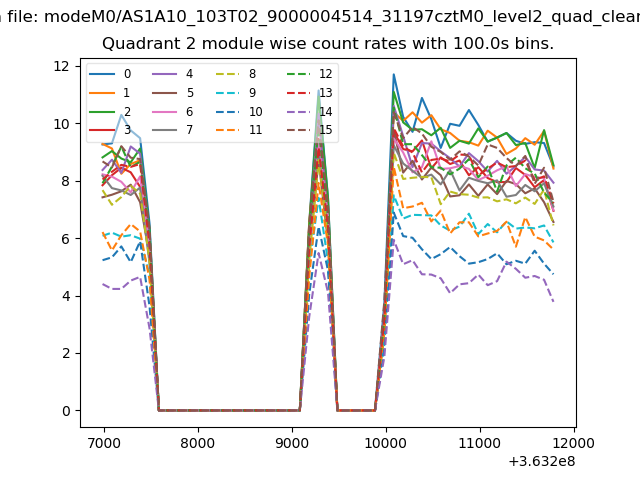
| Module-wise count rates for Quadrant B Data is divided into 100 sec bins |
 |
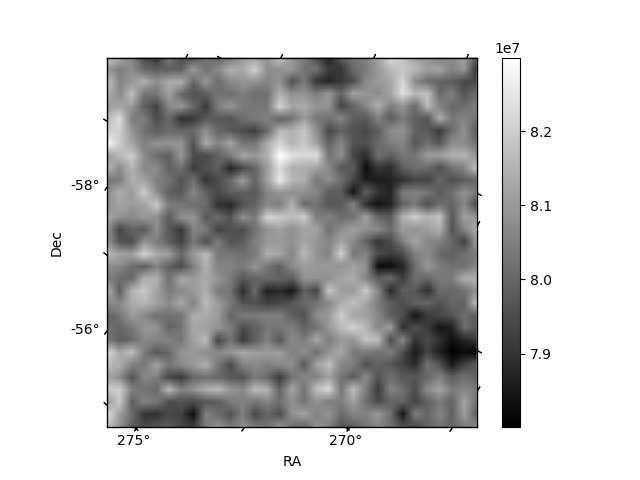 |
| Module-wise count rates for Quadrant C Data is divided into 100 sec bins |
 |
 |
| Module-wise count rates for Quadrant D Data is divided into 100 sec bins |
 |
 |
| Parameter | Plot |
|---|---|
| CZT HV Monitor | 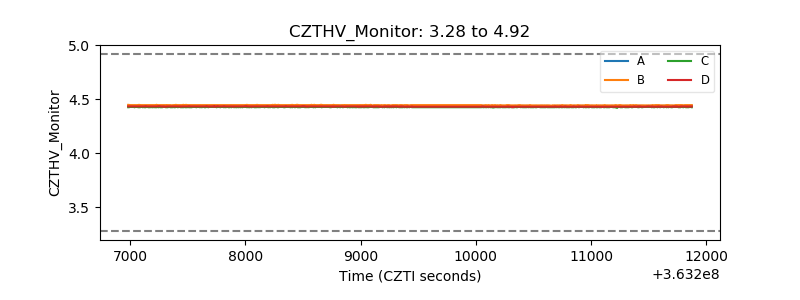 |
| D_VDD | 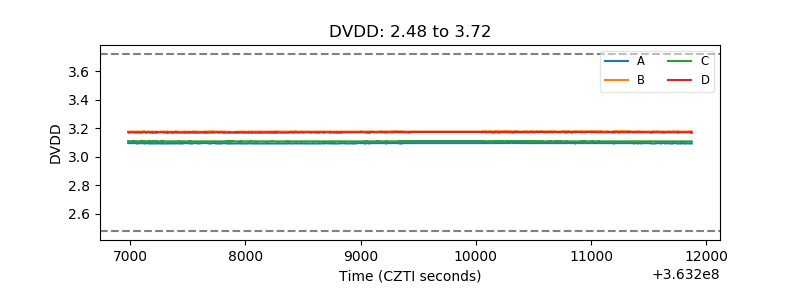 |
| Temperature 1 | 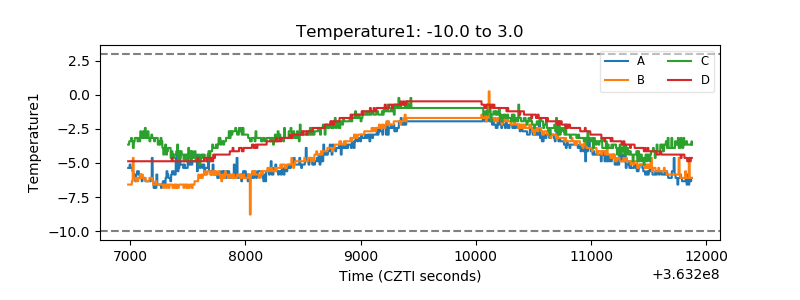 |
| Veto HV Monitor | 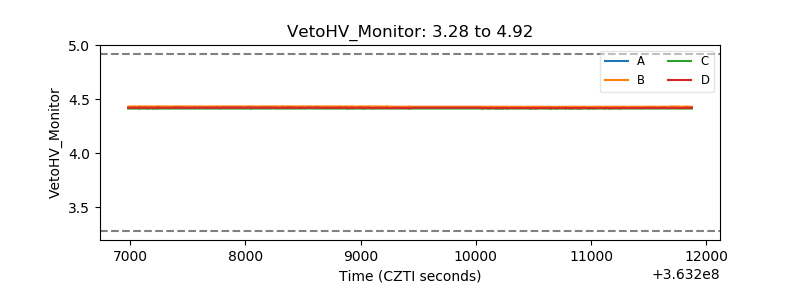 |
| Veto LLD | 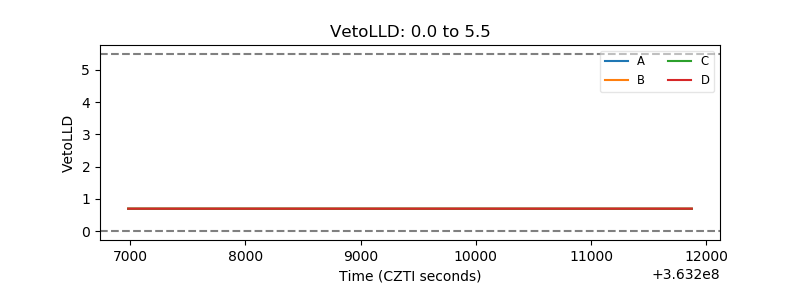 |
| Alpha Counter | 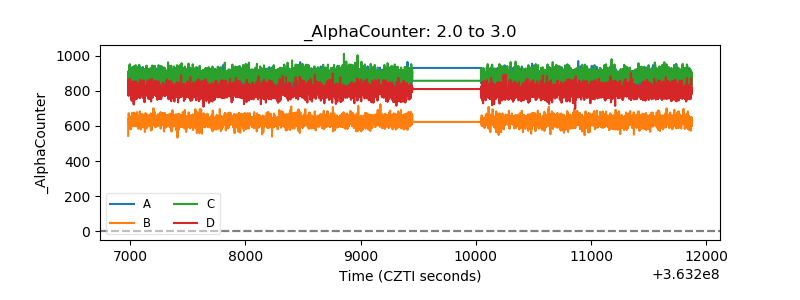 |
| _CPM_Rate | 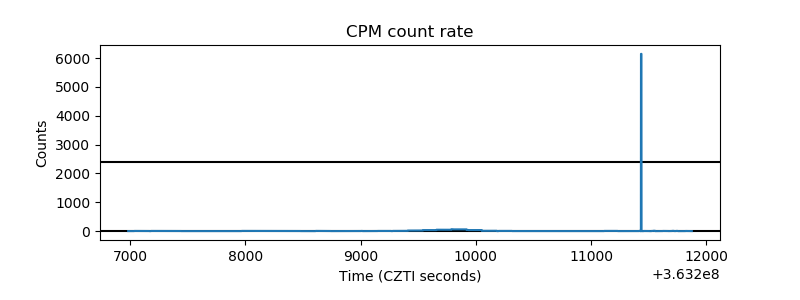 |
| CZT Counter | 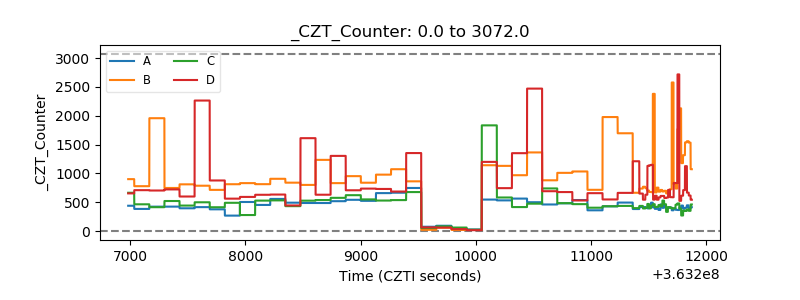 |
| +2.5 Volts monitor |  |
| +5 Volts monitor |  |
| _ROLL_ROT | 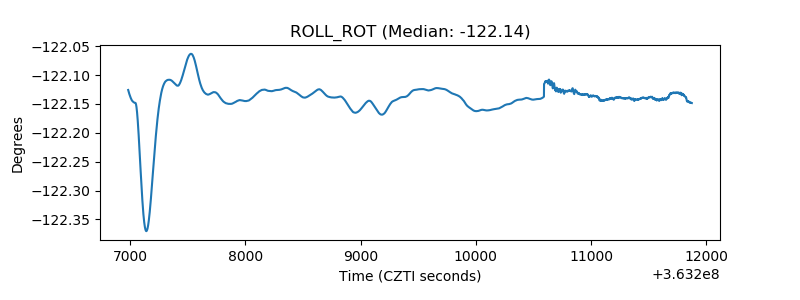 |
| _Roll_DEC | 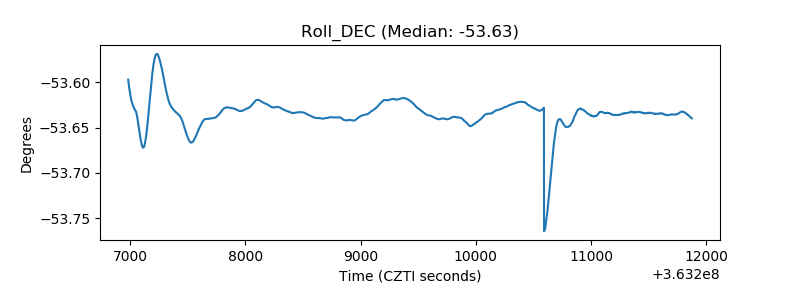 |
| _Roll_RA | 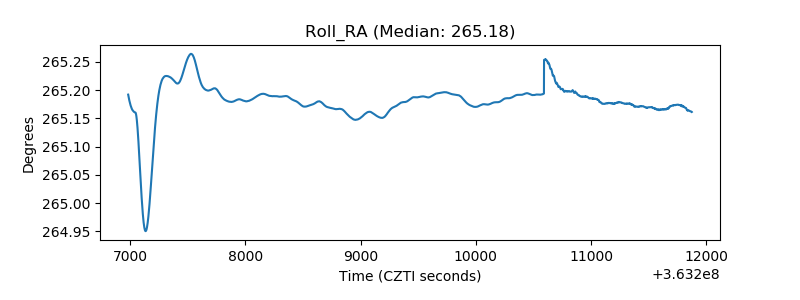 |
| Veto Counter | 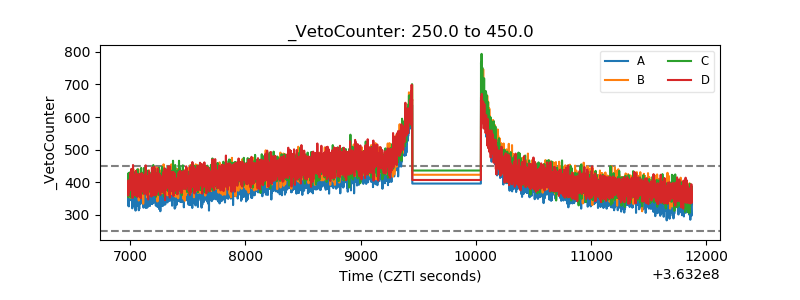 |